
|
|||||
|
 | |
| |
| |
| |
| |
| |
|
Gene: ELMO1 |
Gene summary for ELMO1 |
| Gene information | Species | Human | Gene symbol | ELMO1 | Gene ID | 9844 |
| Gene name | engulfment and cell motility 1 | |
| Gene Alias | CED-12 | |
| Cytomap | 7p14.2-p14.1 | |
| Gene Type | protein-coding | GO ID | GO:0006810 | UniProtAcc | Q92556 |
Top |
Malignant transformation analysis |
| Identification of the aberrant gene expression in precancerous and cancerous lesions by comparing the gene expression of stem-like cells in diseased tissues with normal stem cells |
| Entrez ID | Symbol | Replicates | Species | Organ | Tissue | Adj P-value | Log2FC | Malignancy |
| 9844 | ELMO1 | LZE7T | Human | Esophagus | ESCC | 6.33e-03 | 2.44e-01 | 0.0667 |
| 9844 | ELMO1 | P4T-E | Human | Esophagus | ESCC | 6.27e-06 | 1.27e-01 | 0.1323 |
| 9844 | ELMO1 | P11T-E | Human | Esophagus | ESCC | 1.72e-04 | 2.00e-01 | 0.1426 |
| 9844 | ELMO1 | P12T-E | Human | Esophagus | ESCC | 5.17e-60 | 1.70e+00 | 0.1122 |
| 9844 | ELMO1 | P15T-E | Human | Esophagus | ESCC | 1.35e-04 | 1.06e-01 | 0.1149 |
| 9844 | ELMO1 | P16T-E | Human | Esophagus | ESCC | 2.25e-17 | 3.14e-01 | 0.1153 |
| 9844 | ELMO1 | P17T-E | Human | Esophagus | ESCC | 1.49e-02 | 1.68e-01 | 0.1278 |
| 9844 | ELMO1 | P19T-E | Human | Esophagus | ESCC | 4.64e-06 | 3.83e-01 | 0.1662 |
| 9844 | ELMO1 | P20T-E | Human | Esophagus | ESCC | 5.73e-03 | 1.18e-01 | 0.1124 |
| 9844 | ELMO1 | P22T-E | Human | Esophagus | ESCC | 7.99e-06 | 9.27e-02 | 0.1236 |
| 9844 | ELMO1 | P24T-E | Human | Esophagus | ESCC | 8.80e-03 | 9.69e-02 | 0.1287 |
| 9844 | ELMO1 | P26T-E | Human | Esophagus | ESCC | 7.46e-05 | 1.08e-01 | 0.1276 |
| 9844 | ELMO1 | P27T-E | Human | Esophagus | ESCC | 6.91e-04 | 7.49e-02 | 0.1055 |
| 9844 | ELMO1 | P28T-E | Human | Esophagus | ESCC | 3.29e-08 | 9.77e-02 | 0.1149 |
| 9844 | ELMO1 | P30T-E | Human | Esophagus | ESCC | 9.20e-05 | 1.80e-01 | 0.137 |
| 9844 | ELMO1 | P31T-E | Human | Esophagus | ESCC | 4.00e-04 | 5.87e-02 | 0.1251 |
| 9844 | ELMO1 | P32T-E | Human | Esophagus | ESCC | 1.64e-05 | 1.20e-01 | 0.1666 |
| 9844 | ELMO1 | P36T-E | Human | Esophagus | ESCC | 2.98e-06 | 2.24e-01 | 0.1187 |
| 9844 | ELMO1 | P37T-E | Human | Esophagus | ESCC | 2.31e-05 | 1.37e-01 | 0.1371 |
| 9844 | ELMO1 | P40T-E | Human | Esophagus | ESCC | 1.70e-03 | 1.19e-01 | 0.109 |
| Page: 1 2 3 4 |
| Tissue | Expression Dynamics | Abbreviation |
| Colorectum (GSE201348) |  | FAP: Familial adenomatous polyposis |
| CRC: Colorectal cancer | ||
| Colorectum (HTA11) |  | AD: Adenomas |
| SER: Sessile serrated lesions | ||
| MSI-H: Microsatellite-high colorectal cancer | ||
| MSS: Microsatellite stable colorectal cancer | ||
| Endometrium | 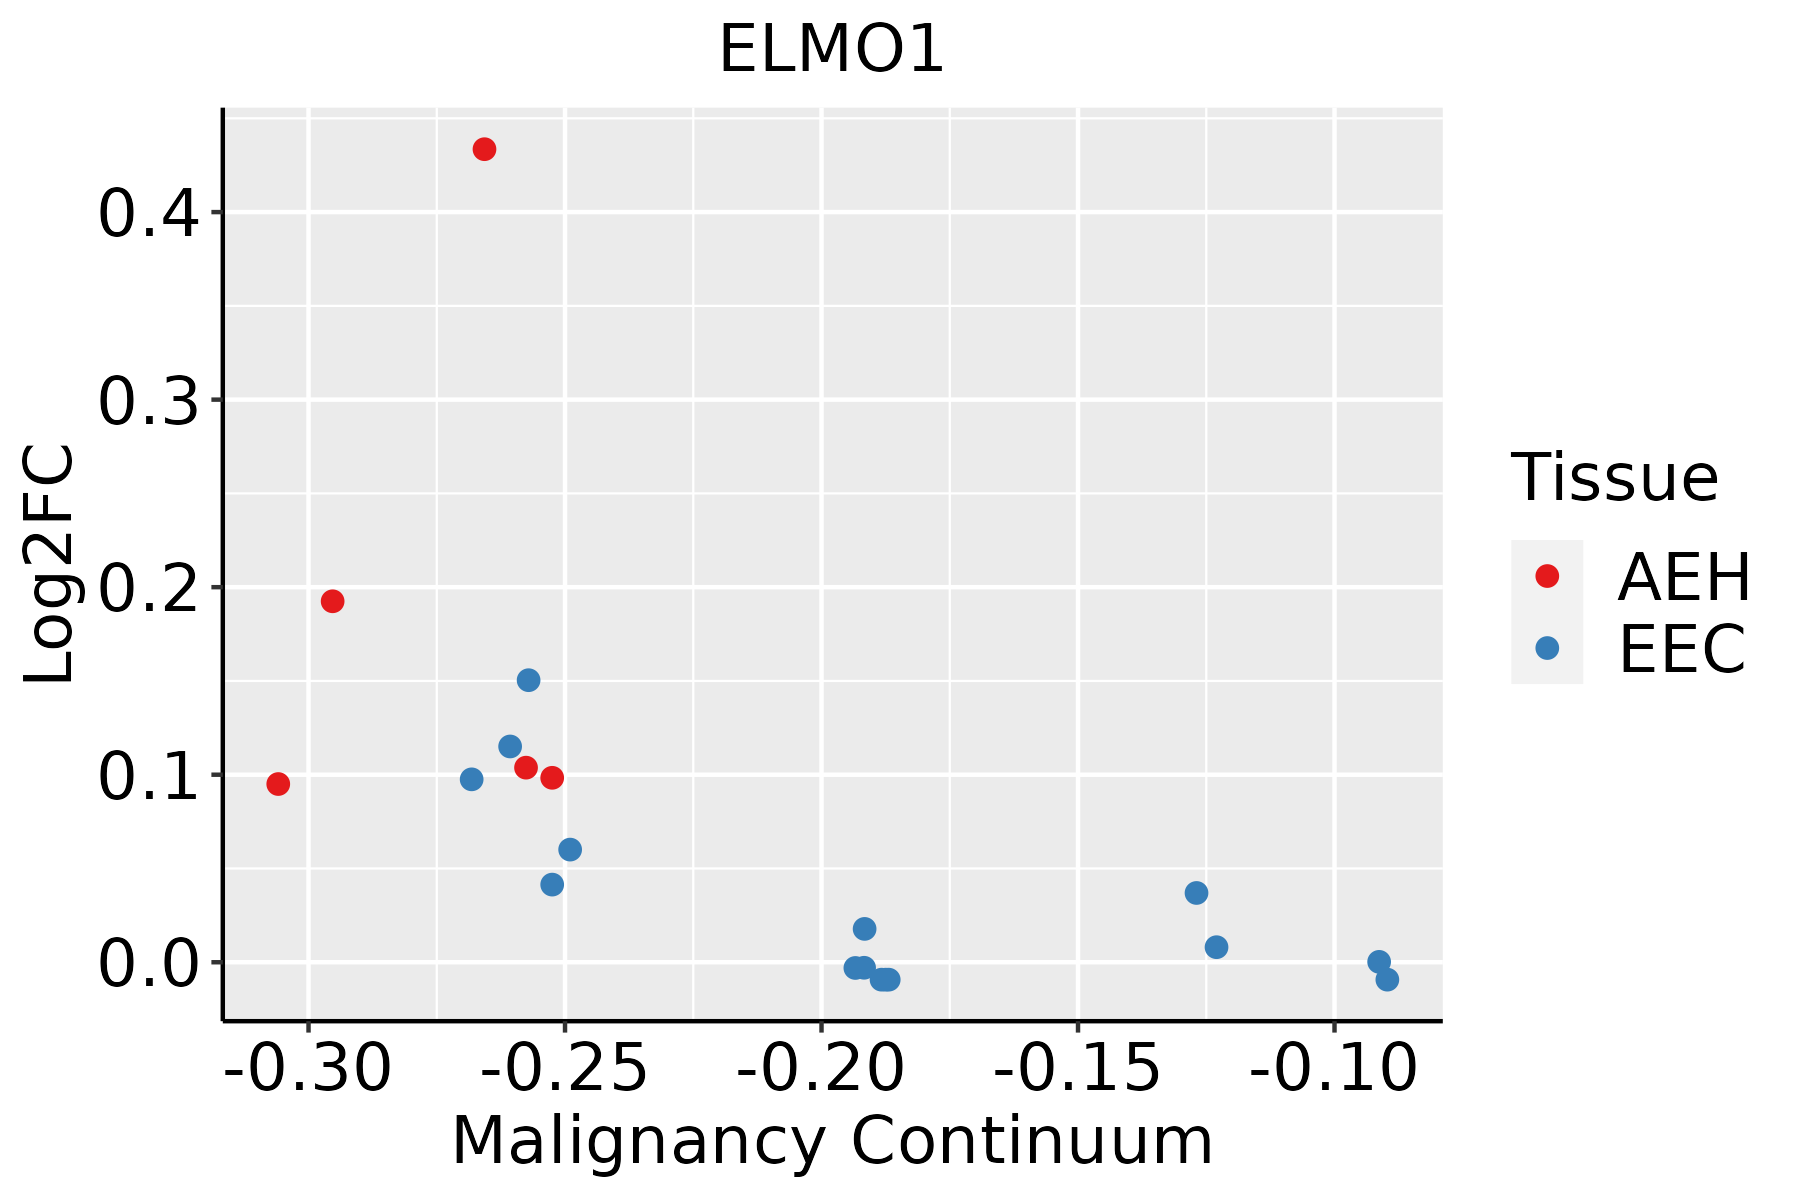 | AEH: Atypical endometrial hyperplasia |
| EEC: Endometrioid Cancer | ||
| Esophagus | 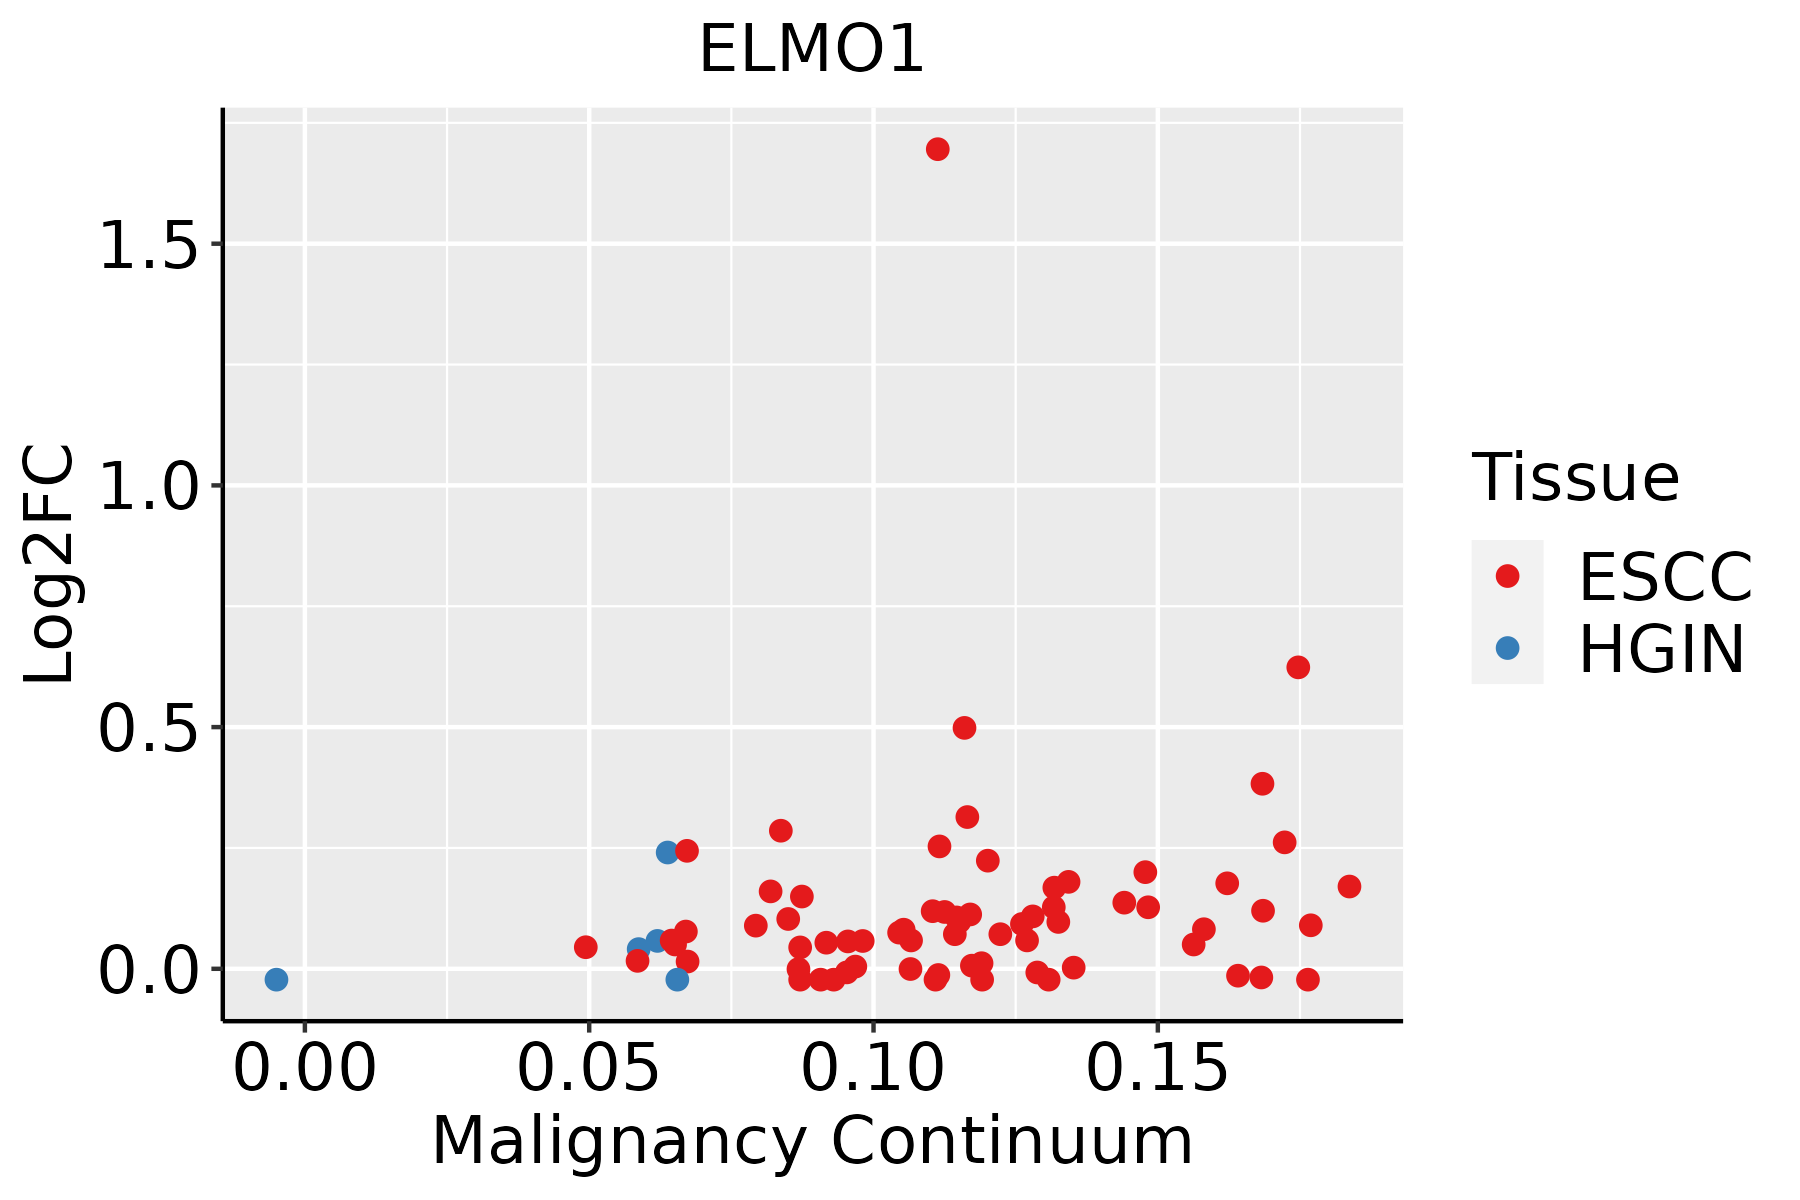 | ESCC: Esophageal squamous cell carcinoma |
| HGIN: High-grade intraepithelial neoplasias | ||
| LGIN: Low-grade intraepithelial neoplasias | ||
| Liver | 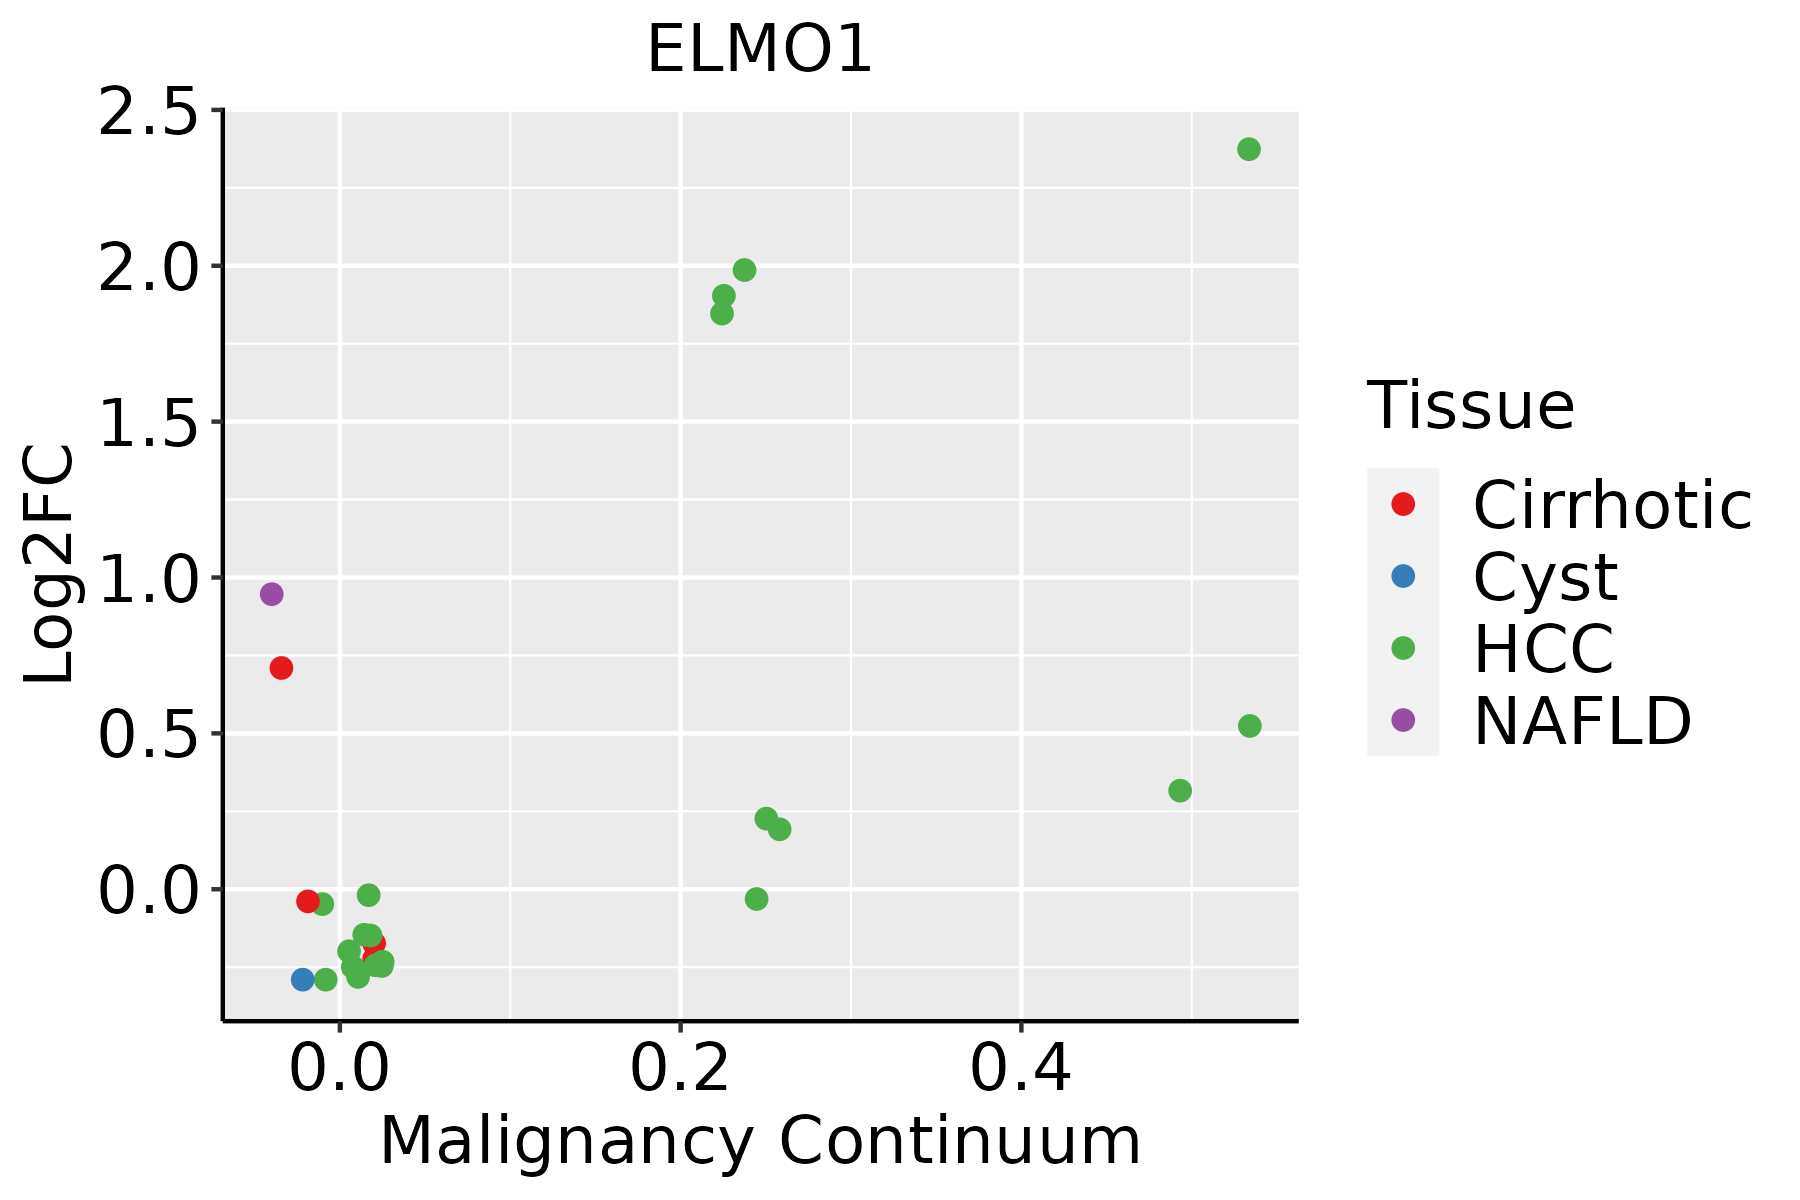 | HCC: Hepatocellular carcinoma |
| NAFLD: Non-alcoholic fatty liver disease | ||
| Oral Cavity | 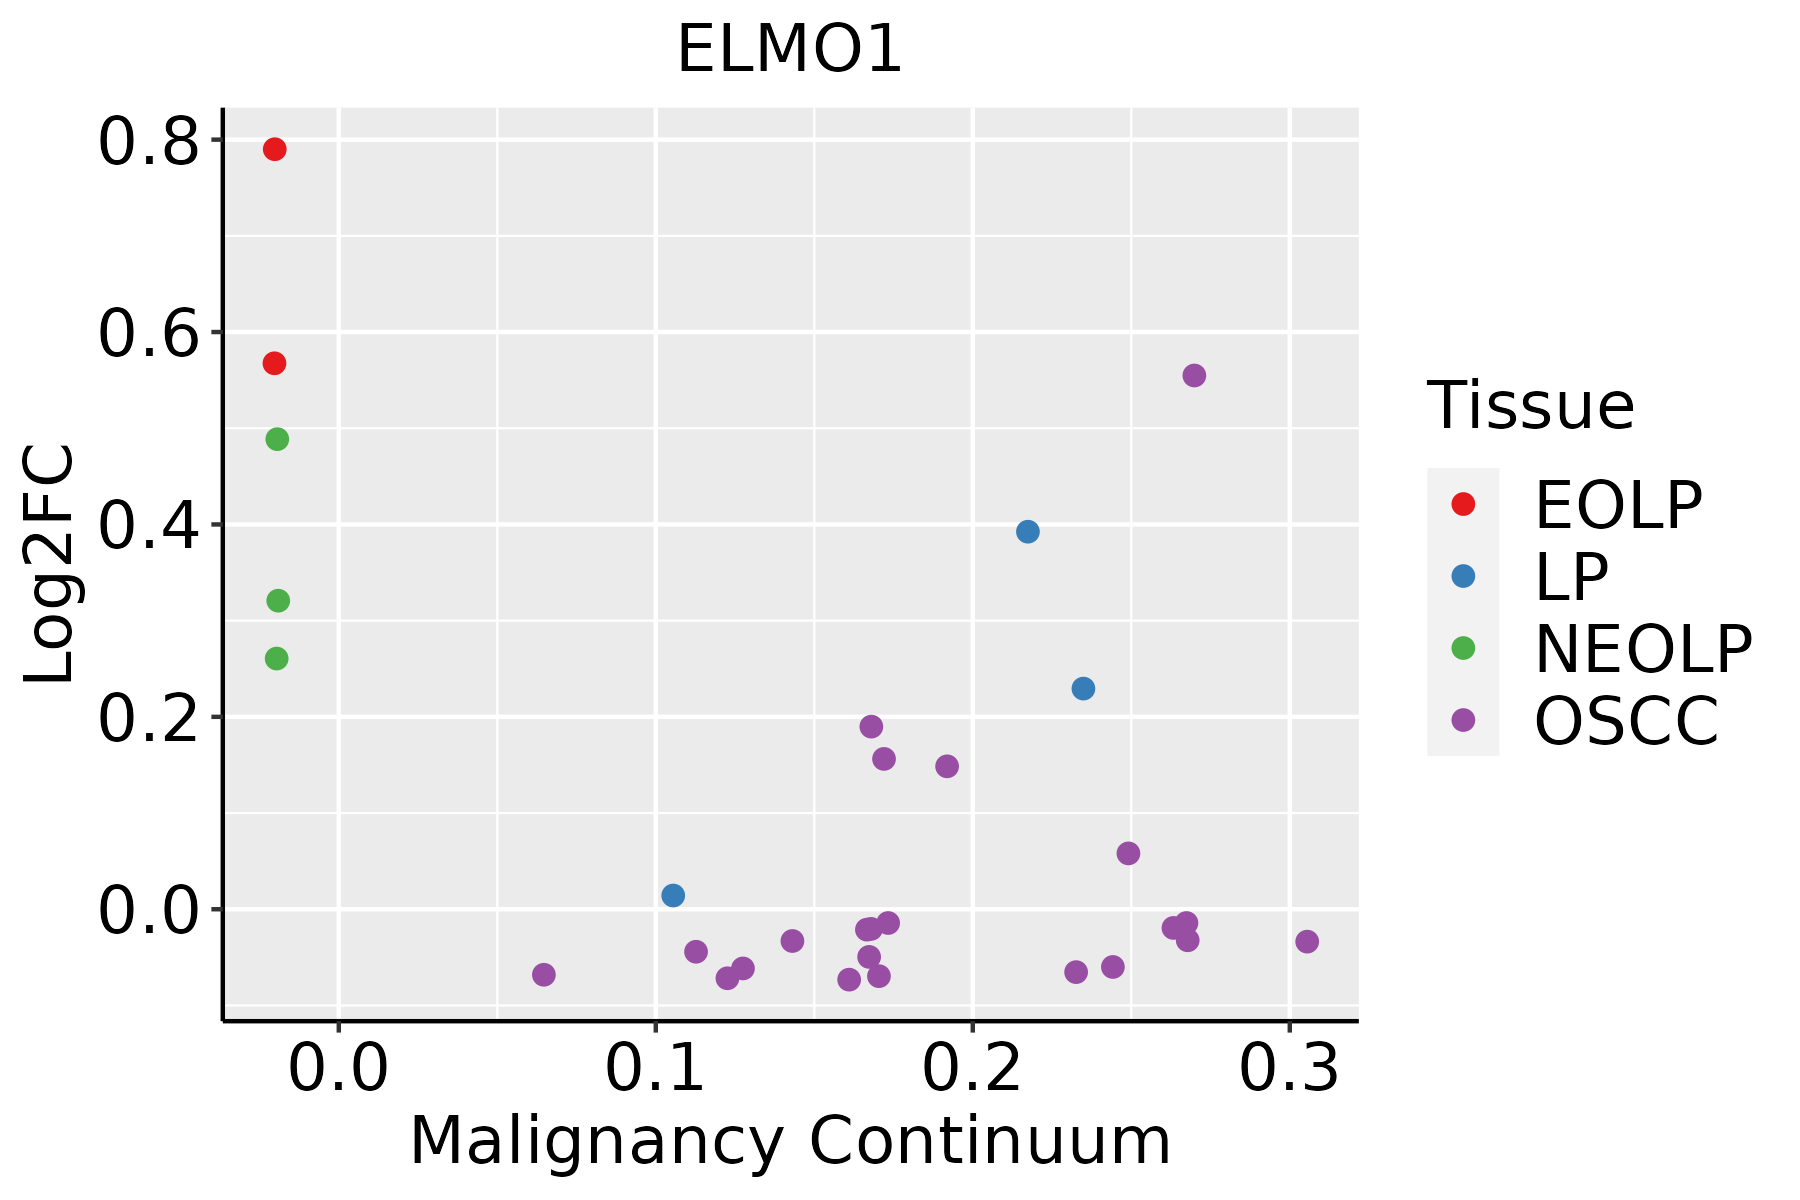 | EOLP: Erosive Oral lichen planus |
| LP: leukoplakia | ||
| NEOLP: Non-erosive oral lichen planus | ||
| OSCC: Oral squamous cell carcinoma | ||
| Thyroid | 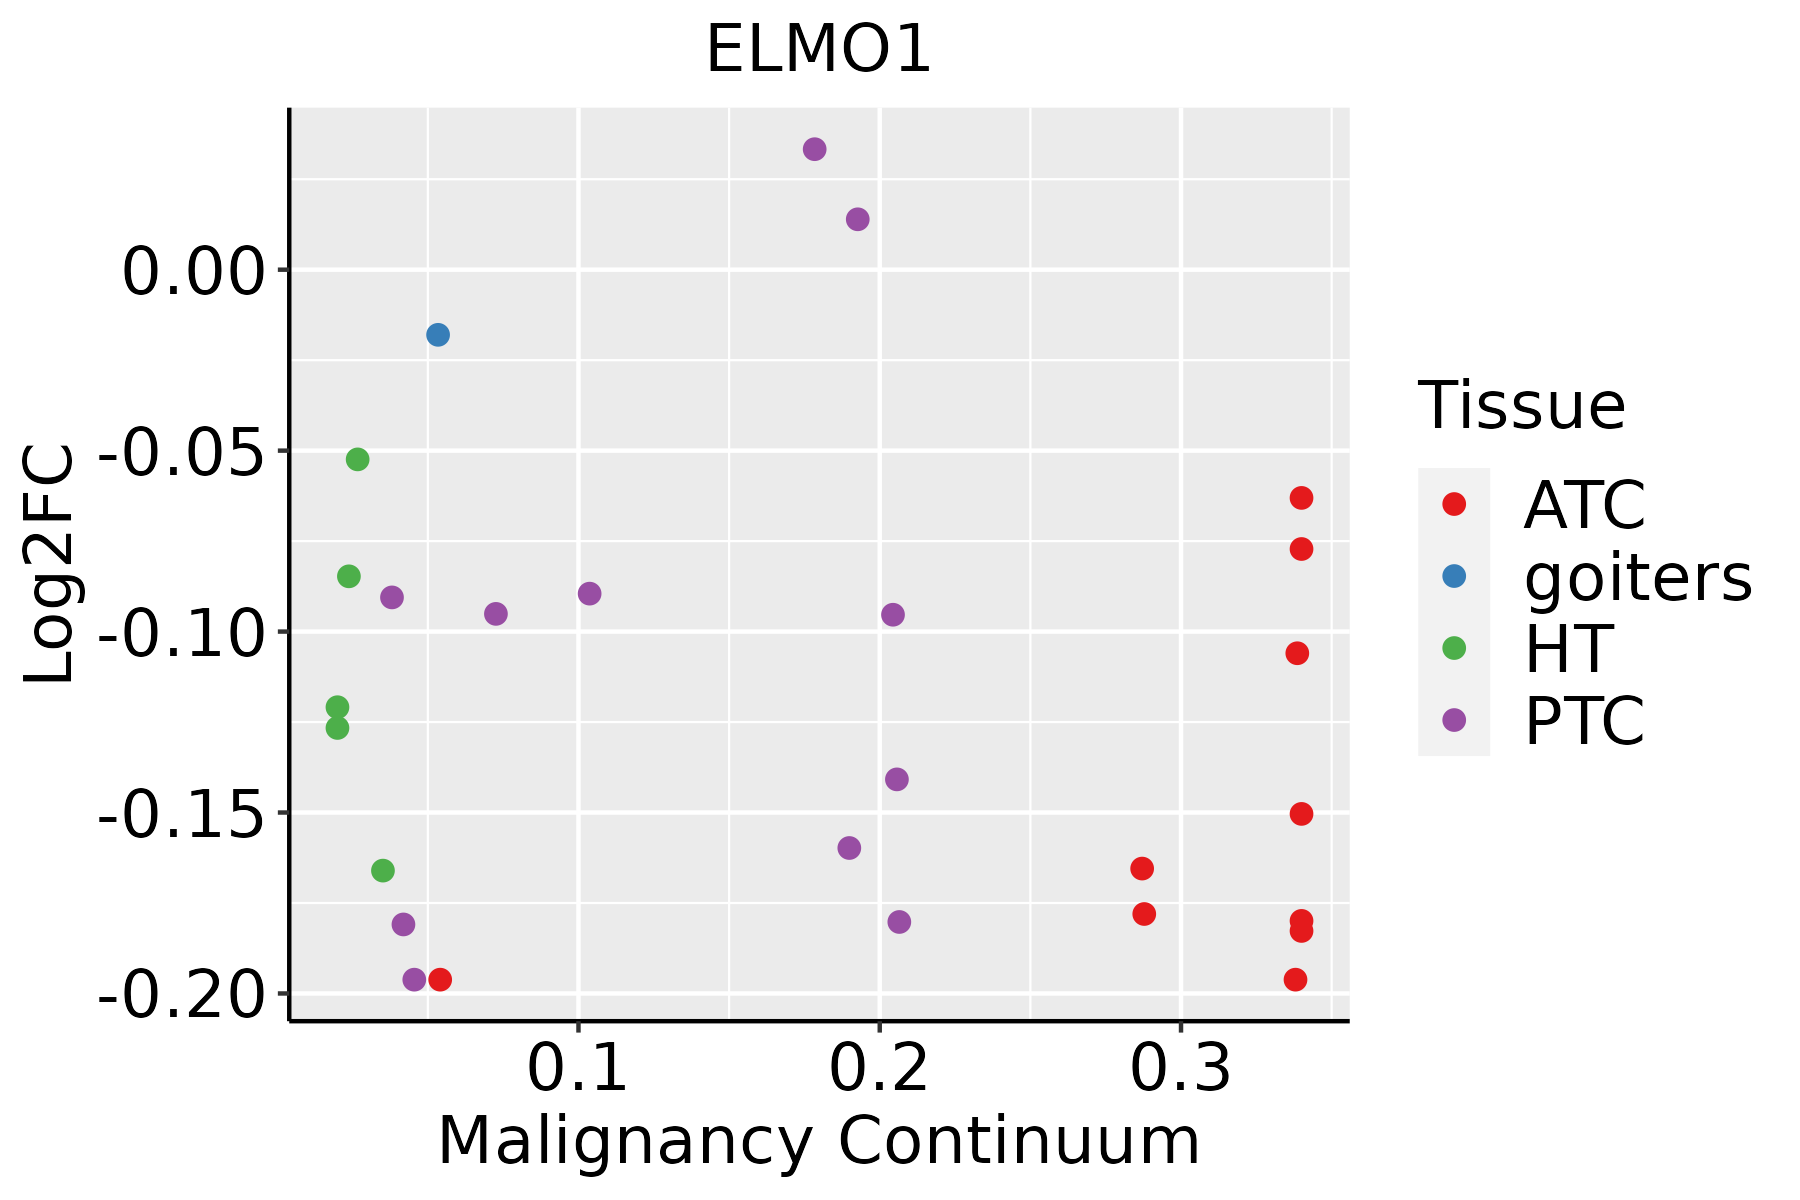 | ATC: Anaplastic thyroid cancer |
| HT: Hashimoto's thyroiditis | ||
| PTC: Papillary thyroid cancer |
| ∗log2FC in expression of this searched gene in stem-like cells from each diseased tissue sample relative to stem-like cells in normal samples in each tissue plotted against the malignancy continuum. Samples are colored based on if they are from different disease stage. |
Top |
Malignant transformation related pathway analysis |
| Find out the enriched GO biological processes and KEGG pathways involved in transition from healthy to precancer to cancer |
| Tissue | Disease Stage | Enriched GO biological Processes |
| Colorectum | AD |  |
| Colorectum | SER |  |
| Colorectum | MSS |  |
| Colorectum | MSI-H |  |
| Colorectum | FAP |  |
| ∗Top 15 enriched GO BP terms are showed in the bar plot of each disease state in each tissue. Each row represents a significant GO biological process which is colored according to the -log10(p.adjust). |
| Page: 1 2 3 4 5 6 7 8 9 |
| GO ID | Tissue | Disease Stage | Description | Gene Ratio | Bg Ratio | pvalue | p.adjust | Count |
| GO:0007015 | Colorectum | AD | actin filament organization | 167/3918 | 442/18723 | 1.65e-16 | 7.94e-14 | 167 |
| GO:0007265 | Colorectum | AD | Ras protein signal transduction | 104/3918 | 337/18723 | 1.01e-05 | 2.35e-04 | 104 |
| GO:0016601 | Colorectum | AD | Rac protein signal transduction | 20/3918 | 42/18723 | 1.02e-04 | 1.53e-03 | 20 |
| GO:00070154 | Colorectum | FAP | actin filament organization | 125/2622 | 442/18723 | 1.97e-15 | 3.03e-12 | 125 |
| GO:00072652 | Colorectum | FAP | Ras protein signal transduction | 80/2622 | 337/18723 | 9.61e-07 | 4.33e-05 | 80 |
| GO:00166012 | Colorectum | FAP | Rac protein signal transduction | 14/2622 | 42/18723 | 1.20e-03 | 1.14e-02 | 14 |
| GO:000701516 | Endometrium | AEH | actin filament organization | 98/2100 | 442/18723 | 1.99e-11 | 2.98e-09 | 98 |
| GO:00072657 | Endometrium | AEH | Ras protein signal transduction | 63/2100 | 337/18723 | 3.09e-05 | 5.66e-04 | 63 |
| GO:00166016 | Endometrium | AEH | Rac protein signal transduction | 11/2100 | 42/18723 | 5.45e-03 | 3.37e-02 | 11 |
| GO:000701517 | Endometrium | EEC | actin filament organization | 95/2168 | 442/18723 | 1.31e-09 | 1.09e-07 | 95 |
| GO:000726513 | Endometrium | EEC | Ras protein signal transduction | 64/2168 | 337/18723 | 4.31e-05 | 7.10e-04 | 64 |
| GO:000701527 | Esophagus | ESCC | actin filament organization | 259/8552 | 442/18723 | 2.37e-08 | 4.50e-07 | 259 |
| GO:000726510 | Esophagus | ESCC | Ras protein signal transduction | 201/8552 | 337/18723 | 1.44e-07 | 2.30e-06 | 201 |
| GO:00166019 | Esophagus | ESCC | Rac protein signal transduction | 33/8552 | 42/18723 | 1.35e-05 | 1.23e-04 | 33 |
| GO:00072654 | Liver | NAFLD | Ras protein signal transduction | 66/1882 | 337/18723 | 8.43e-08 | 7.09e-06 | 66 |
| GO:00070157 | Liver | NAFLD | actin filament organization | 78/1882 | 442/18723 | 5.44e-07 | 3.21e-05 | 78 |
| GO:00166014 | Liver | NAFLD | Rac protein signal transduction | 11/1882 | 42/18723 | 2.32e-03 | 2.19e-02 | 11 |
| GO:000701512 | Liver | Cirrhotic | actin filament organization | 171/4634 | 442/18723 | 3.93e-11 | 2.30e-09 | 171 |
| GO:000726511 | Liver | Cirrhotic | Ras protein signal transduction | 119/4634 | 337/18723 | 8.16e-06 | 1.22e-04 | 119 |
| GO:001660111 | Liver | Cirrhotic | Rac protein signal transduction | 19/4634 | 42/18723 | 3.00e-03 | 1.71e-02 | 19 |
| Page: 1 2 |
| Pathway ID | Tissue | Disease Stage | Description | Gene Ratio | Bg Ratio | pvalue | p.adjust | qvalue | Count |
| hsa05131 | Colorectum | AD | Shigellosis | 109/2092 | 247/8465 | 1.09e-11 | 2.44e-10 | 1.55e-10 | 109 |
| hsa05100 | Colorectum | AD | Bacterial invasion of epithelial cells | 44/2092 | 77/8465 | 1.13e-09 | 2.22e-08 | 1.42e-08 | 44 |
| hsa05132 | Colorectum | AD | Salmonella infection | 102/2092 | 249/8465 | 7.65e-09 | 1.28e-07 | 8.17e-08 | 102 |
| hsa05135 | Colorectum | AD | Yersinia infection | 58/2092 | 137/8465 | 3.90e-06 | 4.35e-05 | 2.78e-05 | 58 |
| hsa051311 | Colorectum | AD | Shigellosis | 109/2092 | 247/8465 | 1.09e-11 | 2.44e-10 | 1.55e-10 | 109 |
| hsa051001 | Colorectum | AD | Bacterial invasion of epithelial cells | 44/2092 | 77/8465 | 1.13e-09 | 2.22e-08 | 1.42e-08 | 44 |
| hsa051321 | Colorectum | AD | Salmonella infection | 102/2092 | 249/8465 | 7.65e-09 | 1.28e-07 | 8.17e-08 | 102 |
| hsa051351 | Colorectum | AD | Yersinia infection | 58/2092 | 137/8465 | 3.90e-06 | 4.35e-05 | 2.78e-05 | 58 |
| hsa051318 | Colorectum | FAP | Shigellosis | 76/1404 | 247/8465 | 1.57e-08 | 5.84e-07 | 3.55e-07 | 76 |
| hsa051008 | Colorectum | FAP | Bacterial invasion of epithelial cells | 33/1404 | 77/8465 | 4.33e-08 | 1.11e-06 | 6.77e-07 | 33 |
| hsa051356 | Colorectum | FAP | Yersinia infection | 43/1404 | 137/8465 | 1.21e-05 | 1.62e-04 | 9.86e-05 | 43 |
| hsa051328 | Colorectum | FAP | Salmonella infection | 67/1404 | 249/8465 | 2.04e-05 | 2.52e-04 | 1.53e-04 | 67 |
| hsa051319 | Colorectum | FAP | Shigellosis | 76/1404 | 247/8465 | 1.57e-08 | 5.84e-07 | 3.55e-07 | 76 |
| hsa051009 | Colorectum | FAP | Bacterial invasion of epithelial cells | 33/1404 | 77/8465 | 4.33e-08 | 1.11e-06 | 6.77e-07 | 33 |
| hsa051357 | Colorectum | FAP | Yersinia infection | 43/1404 | 137/8465 | 1.21e-05 | 1.62e-04 | 9.86e-05 | 43 |
| hsa051329 | Colorectum | FAP | Salmonella infection | 67/1404 | 249/8465 | 2.04e-05 | 2.52e-04 | 1.53e-04 | 67 |
| hsa0513126 | Endometrium | AEH | Shigellosis | 78/1197 | 247/8465 | 9.23e-13 | 2.00e-11 | 1.46e-11 | 78 |
| hsa0513226 | Endometrium | AEH | Salmonella infection | 71/1197 | 249/8465 | 1.69e-09 | 3.44e-08 | 2.52e-08 | 71 |
| hsa0510026 | Endometrium | AEH | Bacterial invasion of epithelial cells | 32/1197 | 77/8465 | 3.28e-09 | 5.91e-08 | 4.33e-08 | 32 |
| hsa05131111 | Endometrium | AEH | Shigellosis | 78/1197 | 247/8465 | 9.23e-13 | 2.00e-11 | 1.46e-11 | 78 |
| Page: 1 2 3 4 |
Top |
Cell-cell communication analysis |
| Identification of potential cell-cell interactions between two cell types and their ligand-receptor pairs for different disease states |
| Ligand | Receptor | LRpair | Pathway | Tissue | Disease Stage |
| Page: 1 |
Top |
Single-cell gene regulatory network inference analysis |
| Find out the significant the regulons (TFs) and the target genes of each regulon across cell types for different disease states |
| TF | Cell Type | Tissue | Disease Stage | Target Gene | RSS | Regulon Activity |
| ∗The dot plots of a searched regulon are shown for all cell subpopulations in each disease state of each tissue based on the regulon specific score inferred using pySCENIC and by calculating the average expression. |
| Page: 1 |
Top |
Somatic mutation of malignant transformation related genes |
| Annotation of somatic variants for genes involved in malignant transformation |
| Hugo Symbol | Variant Class | Variant Classification | dbSNP RS | HGVSc | HGVSp | HGVSp Short | SWISSPROT | BIOTYPE | SIFT | PolyPhen | Tumor Sample Barcode | Tissue | Histology | Sex | Age | Stage | Therapy Types | Drugs | Outcome |
| ELMO1 | SNV | Missense_Mutation | novel | c.1579N>C | p.Asp527His | p.D527H | Q92556 | protein_coding | deleterious(0.01) | possibly_damaging(0.885) | TCGA-5L-AAT0-01 | Breast | breast invasive carcinoma | Female | <65 | I/II | Hormone Therapy | tamoxiphen | SD |
| ELMO1 | SNV | Missense_Mutation | c.1219N>C | p.Asp407His | p.D407H | Q92556 | protein_coding | deleterious(0) | probably_damaging(1) | TCGA-AC-A23H-01 | Breast | breast invasive carcinoma | Female | >=65 | I/II | Unknown | Unknown | PD | |
| ELMO1 | SNV | Missense_Mutation | novel | c.1752A>C | p.Lys584Asn | p.K584N | Q92556 | protein_coding | deleterious(0) | probably_damaging(0.991) | TCGA-AN-A046-01 | Breast | breast invasive carcinoma | Female | >=65 | I/II | Unknown | Unknown | SD |
| ELMO1 | SNV | Missense_Mutation | rs537643098 | c.714A>C | p.Glu238Asp | p.E238D | Q92556 | protein_coding | tolerated(0.38) | benign(0.021) | TCGA-AN-A046-01 | Breast | breast invasive carcinoma | Female | >=65 | I/II | Unknown | Unknown | SD |
| ELMO1 | SNV | Missense_Mutation | rs778770532 | c.872N>T | p.Ala291Val | p.A291V | Q92556 | protein_coding | deleterious(0) | probably_damaging(0.95) | TCGA-AN-A0FY-01 | Breast | breast invasive carcinoma | Female | <65 | I/II | Unknown | Unknown | SD |
| ELMO1 | SNV | Missense_Mutation | rs753142024 | c.788C>T | p.Ala263Val | p.A263V | Q92556 | protein_coding | tolerated(0.22) | possibly_damaging(0.57) | TCGA-BH-A0W4-01 | Breast | breast invasive carcinoma | Female | <65 | I/II | Unknown | Unknown | SD |
| ELMO1 | SNV | Missense_Mutation | c.156N>C | p.Gln52His | p.Q52H | Q92556 | protein_coding | deleterious(0.03) | possibly_damaging(0.873) | TCGA-D8-A1JA-01 | Breast | breast invasive carcinoma | Female | <65 | III/IV | Chemotherapy | adriamycin | PD | |
| ELMO1 | SNV | Missense_Mutation | rs868556780 | c.1552N>T | p.Arg518Cys | p.R518C | Q92556 | protein_coding | deleterious(0.01) | probably_damaging(0.972) | TCGA-GM-A2DC-01 | Breast | breast invasive carcinoma | Female | <65 | I/II | Chemotherapy | xeloda | CR |
| ELMO1 | deletion | Frame_Shift_Del | c.1888delN | p.Ala630ProfsTer23 | p.A630Pfs*23 | Q92556 | protein_coding | TCGA-D8-A27V-01 | Breast | breast invasive carcinoma | Female | <65 | I/II | Hormone Therapy | tamoxiphen | SD | |||
| ELMO1 | deletion | Frame_Shift_Del | novel | c.654delN | p.Val219TrpfsTer28 | p.V219Wfs*28 | Q92556 | protein_coding | TCGA-D8-A27V-01 | Breast | breast invasive carcinoma | Female | <65 | I/II | Hormone Therapy | tamoxiphen | SD |
| Page: 1 2 3 4 5 6 7 8 9 10 11 12 13 14 15 |
Top |
Related drugs of malignant transformation related genes |
| Identification of chemicals and drugs interact with genes involved in malignant transfromation |
| (DGIdb 4.0) |
| Entrez ID | Symbol | Category | Interaction Types | Drug Claim Name | Drug Name | PMIDs |
| Page: 1 |

Copyright 2023-Present -The University of Texas Health Science Center at Houston |