
|
|||||
|
 | |
| |
| |
| |
| |
| |
|
Gene: EIF4G1 |
Gene summary for EIF4G1 |
| Gene information | Species | Human | Gene symbol | EIF4G1 | Gene ID | 1981 |
| Gene name | eukaryotic translation initiation factor 4 gamma 1 | |
| Gene Alias | EIF-4G1 | |
| Cytomap | 3q27.1 | |
| Gene Type | protein-coding | GO ID | GO:0000082 | UniProtAcc | B2RU06 |
Top |
Malignant transformation analysis |
| Identification of the aberrant gene expression in precancerous and cancerous lesions by comparing the gene expression of stem-like cells in diseased tissues with normal stem cells |
| Entrez ID | Symbol | Replicates | Species | Organ | Tissue | Adj P-value | Log2FC | Malignancy |
| 1981 | EIF4G1 | HTA11_6801_2000001011 | Human | Colorectum | SER | 1.35e-07 | 1.01e+00 | 0.0171 |
| 1981 | EIF4G1 | HTA11_10711_2000001011 | Human | Colorectum | AD | 5.36e-09 | 6.33e-01 | 0.0338 |
| 1981 | EIF4G1 | HTA11_7696_3000711011 | Human | Colorectum | AD | 7.83e-34 | 1.20e+00 | 0.0674 |
| 1981 | EIF4G1 | HTA11_6818_2000001011 | Human | Colorectum | AD | 2.46e-05 | 6.92e-01 | 0.0112 |
| 1981 | EIF4G1 | HTA11_7469_2000001011 | Human | Colorectum | AD | 4.16e-03 | 7.84e-01 | -0.0124 |
| 1981 | EIF4G1 | HTA11_6818_2000001021 | Human | Colorectum | AD | 2.51e-10 | 5.81e-01 | 0.0588 |
| 1981 | EIF4G1 | HTA11_99999970781_79442 | Human | Colorectum | MSS | 8.53e-31 | 1.02e+00 | 0.294 |
| 1981 | EIF4G1 | HTA11_99999965062_69753 | Human | Colorectum | MSI-H | 6.44e-07 | 1.32e+00 | 0.3487 |
| 1981 | EIF4G1 | HTA11_99999965104_69814 | Human | Colorectum | MSS | 3.61e-21 | 8.80e-01 | 0.281 |
| 1981 | EIF4G1 | HTA11_99999971662_82457 | Human | Colorectum | MSS | 1.03e-46 | 1.45e+00 | 0.3859 |
| 1981 | EIF4G1 | HTA11_99999973899_84307 | Human | Colorectum | MSS | 1.16e-08 | 7.33e-01 | 0.2585 |
| 1981 | EIF4G1 | HTA11_99999974143_84620 | Human | Colorectum | MSS | 3.74e-26 | 8.43e-01 | 0.3005 |
| 1981 | EIF4G1 | A015-C-203 | Human | Colorectum | FAP | 4.84e-04 | 1.77e-02 | -0.1294 |
| 1981 | EIF4G1 | A002-C-205 | Human | Colorectum | FAP | 1.07e-05 | 2.44e-01 | -0.1236 |
| 1981 | EIF4G1 | A015-C-104 | Human | Colorectum | FAP | 8.47e-06 | 5.62e-02 | -0.1899 |
| 1981 | EIF4G1 | A002-C-016 | Human | Colorectum | FAP | 1.60e-04 | -7.99e-03 | 0.0521 |
| 1981 | EIF4G1 | A002-C-116 | Human | Colorectum | FAP | 1.45e-06 | 4.00e-02 | -0.0452 |
| 1981 | EIF4G1 | LZE2T | Human | Esophagus | ESCC | 6.14e-10 | 1.83e+00 | 0.082 |
| 1981 | EIF4G1 | LZE4T | Human | Esophagus | ESCC | 2.38e-34 | 1.15e+00 | 0.0811 |
| 1981 | EIF4G1 | LZE5T | Human | Esophagus | ESCC | 1.87e-03 | 8.28e-01 | 0.0514 |
| Page: 1 2 3 4 5 6 7 8 9 10 |
| Tissue | Expression Dynamics | Abbreviation |
| Colorectum (GSE201348) | 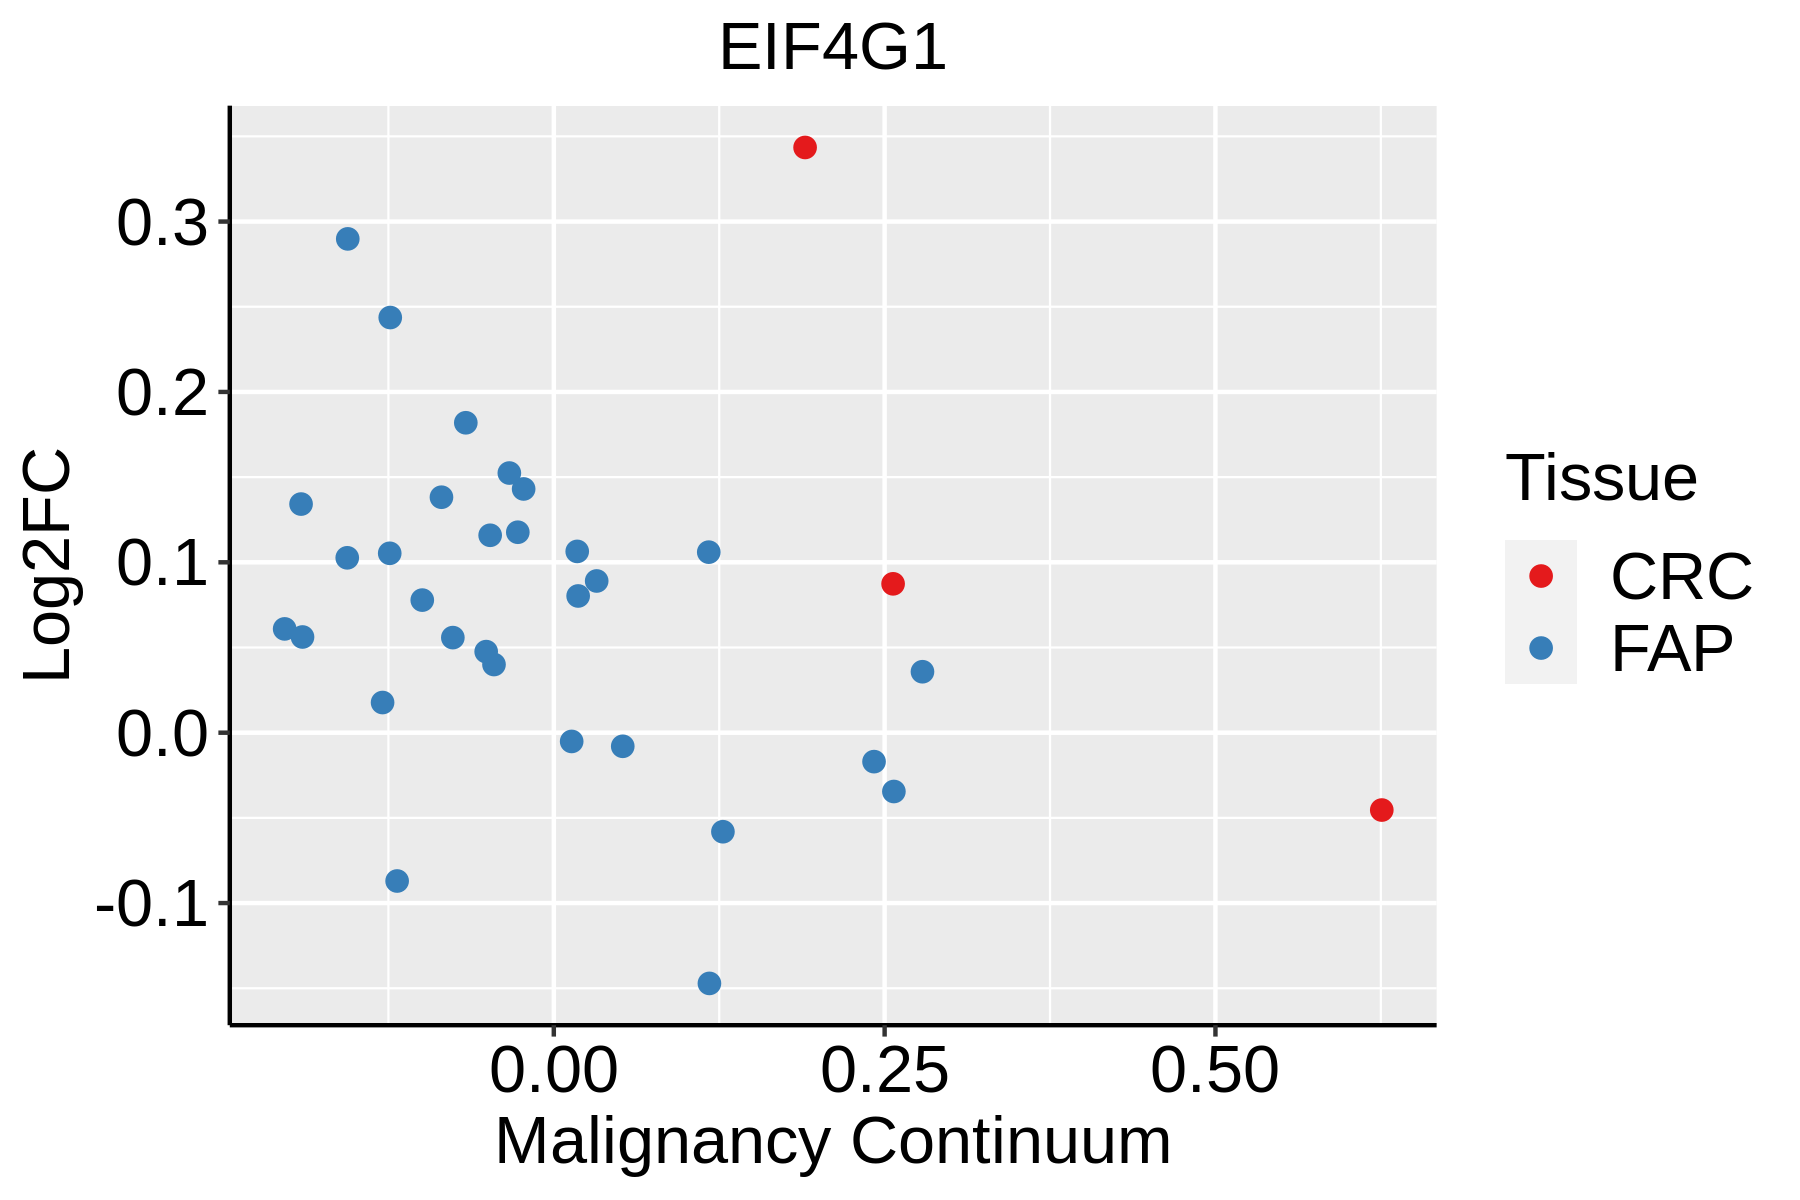 | FAP: Familial adenomatous polyposis |
| CRC: Colorectal cancer | ||
| Colorectum (HTA11) |  | AD: Adenomas |
| SER: Sessile serrated lesions | ||
| MSI-H: Microsatellite-high colorectal cancer | ||
| MSS: Microsatellite stable colorectal cancer | ||
| Esophagus | 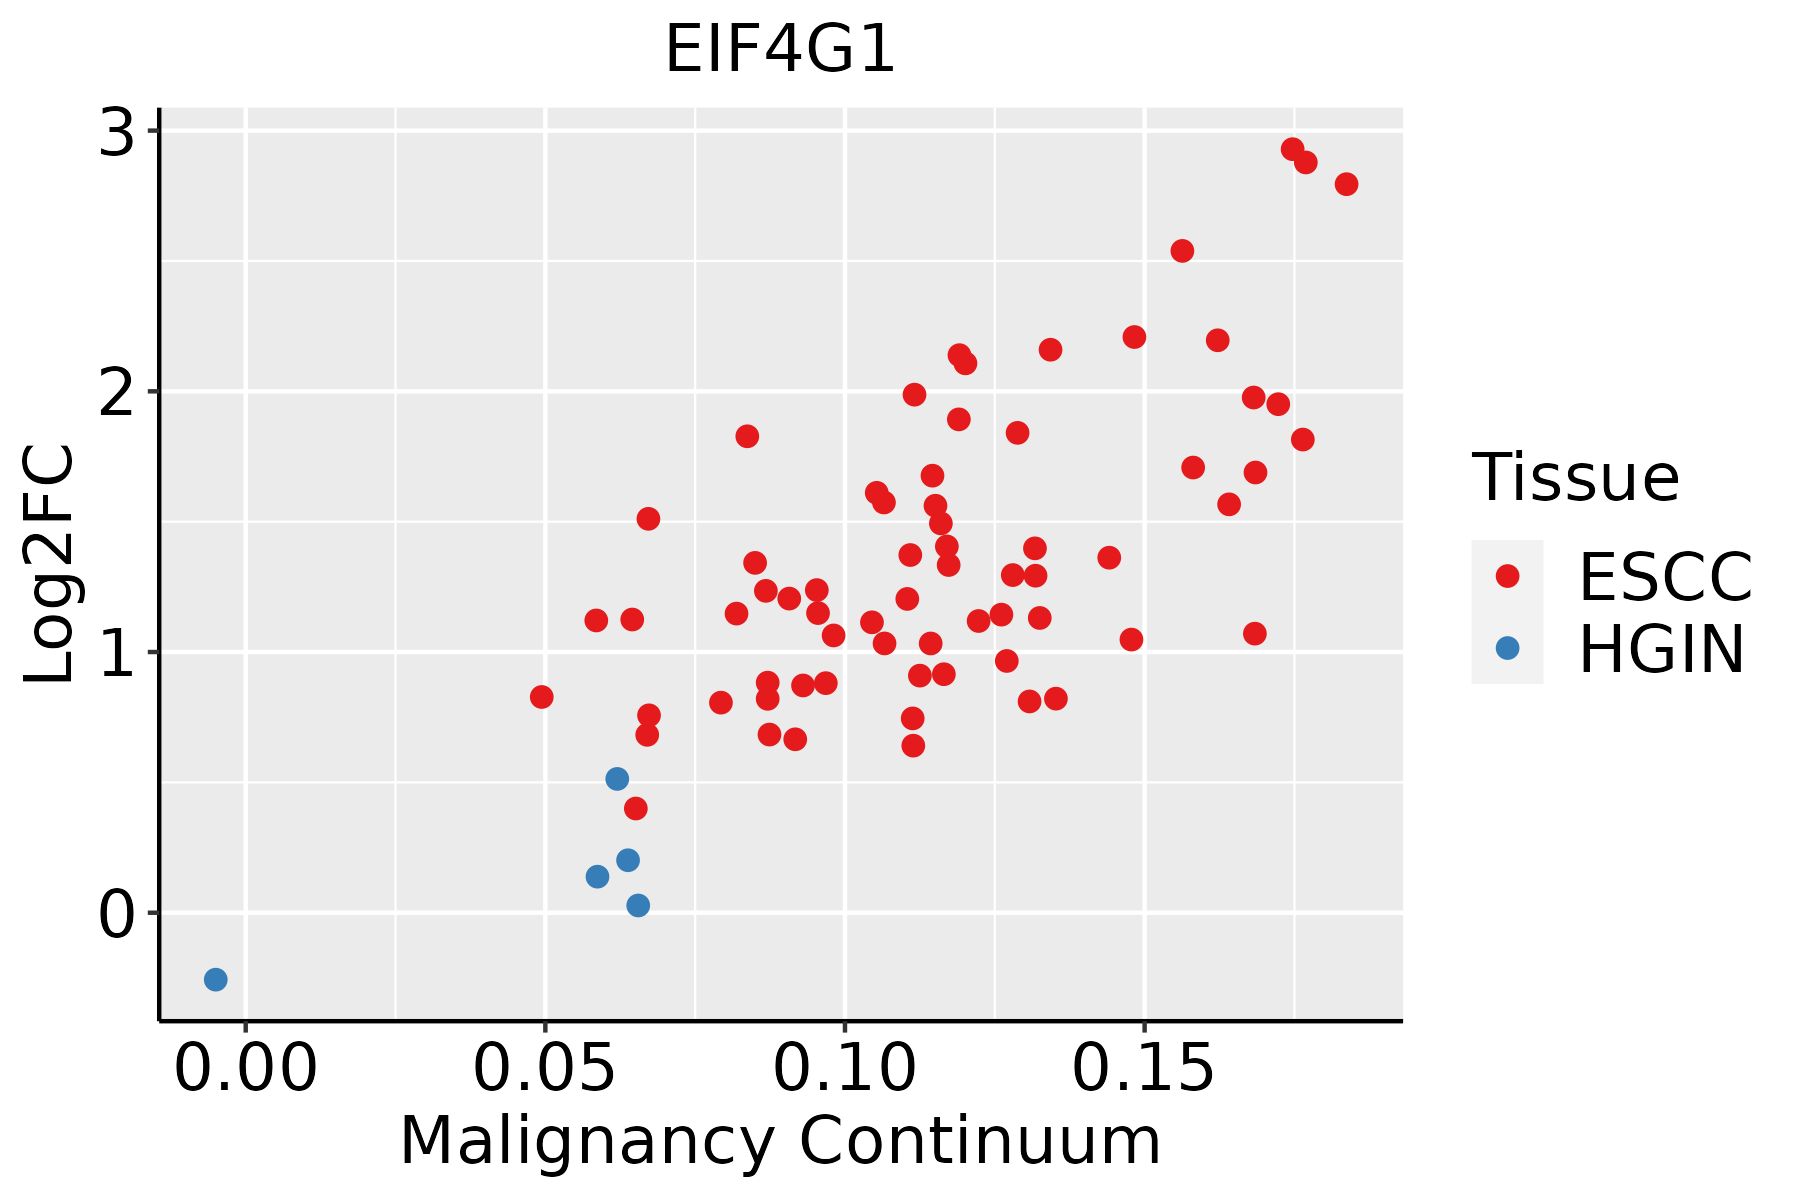 | ESCC: Esophageal squamous cell carcinoma |
| HGIN: High-grade intraepithelial neoplasias | ||
| LGIN: Low-grade intraepithelial neoplasias | ||
| Liver |  | HCC: Hepatocellular carcinoma |
| NAFLD: Non-alcoholic fatty liver disease | ||
| Oral Cavity | 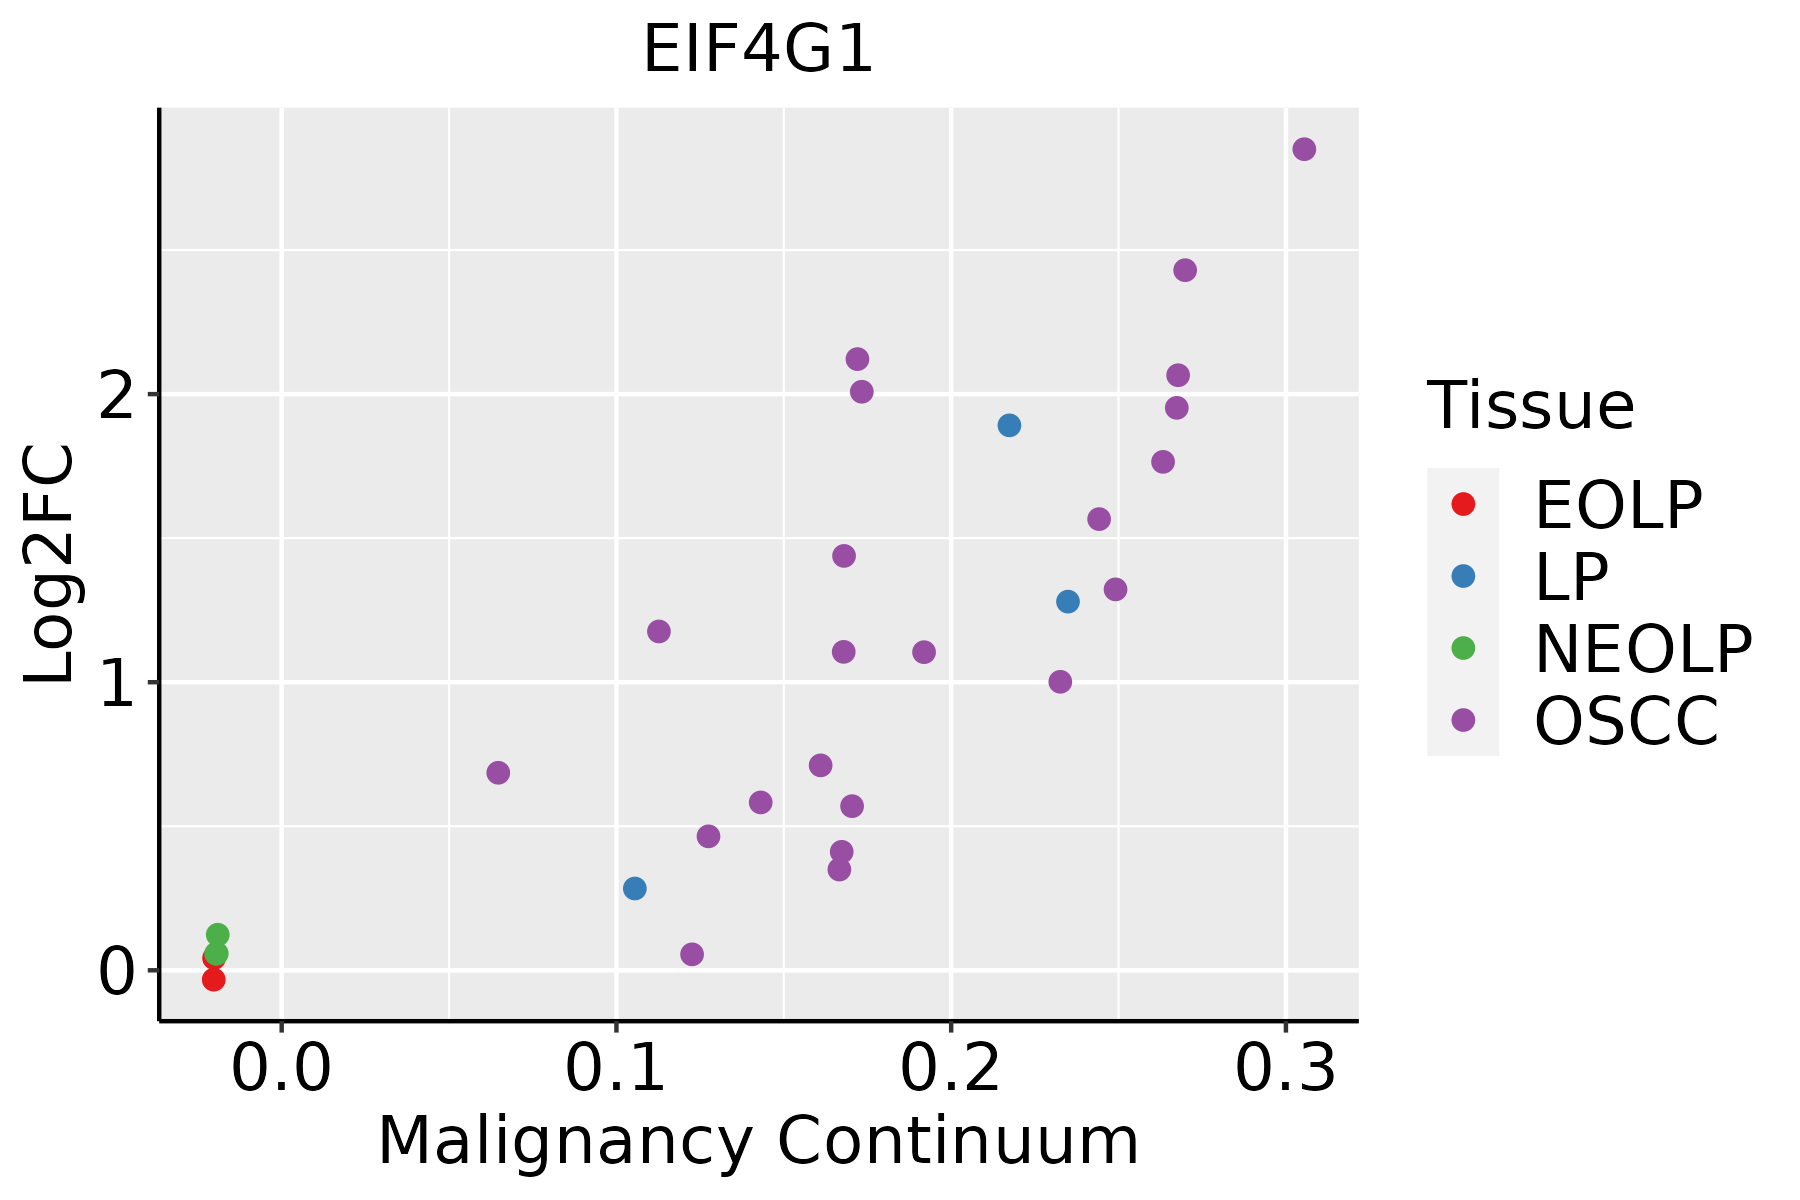 | EOLP: Erosive Oral lichen planus |
| LP: leukoplakia | ||
| NEOLP: Non-erosive oral lichen planus | ||
| OSCC: Oral squamous cell carcinoma | ||
| Prostate | 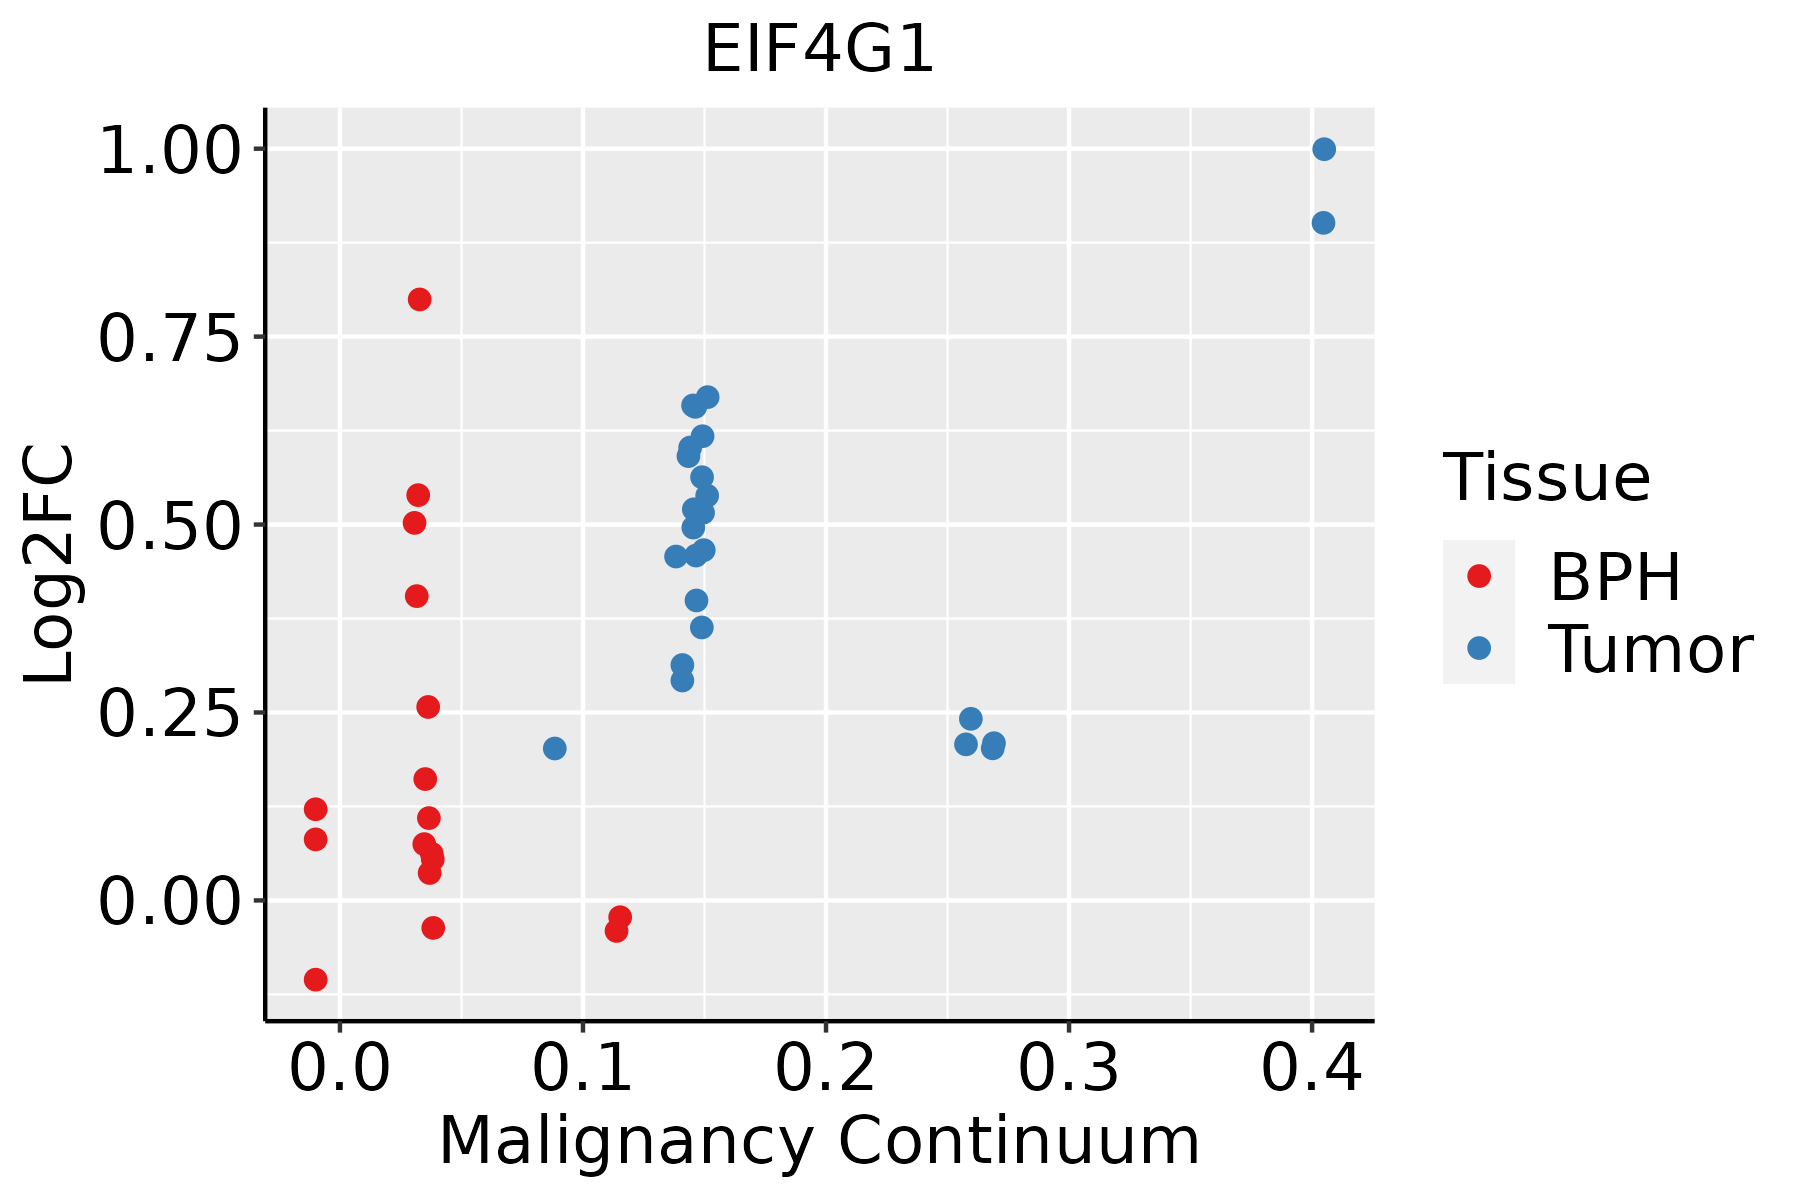 | BPH: Benign Prostatic Hyperplasia |
| Skin | 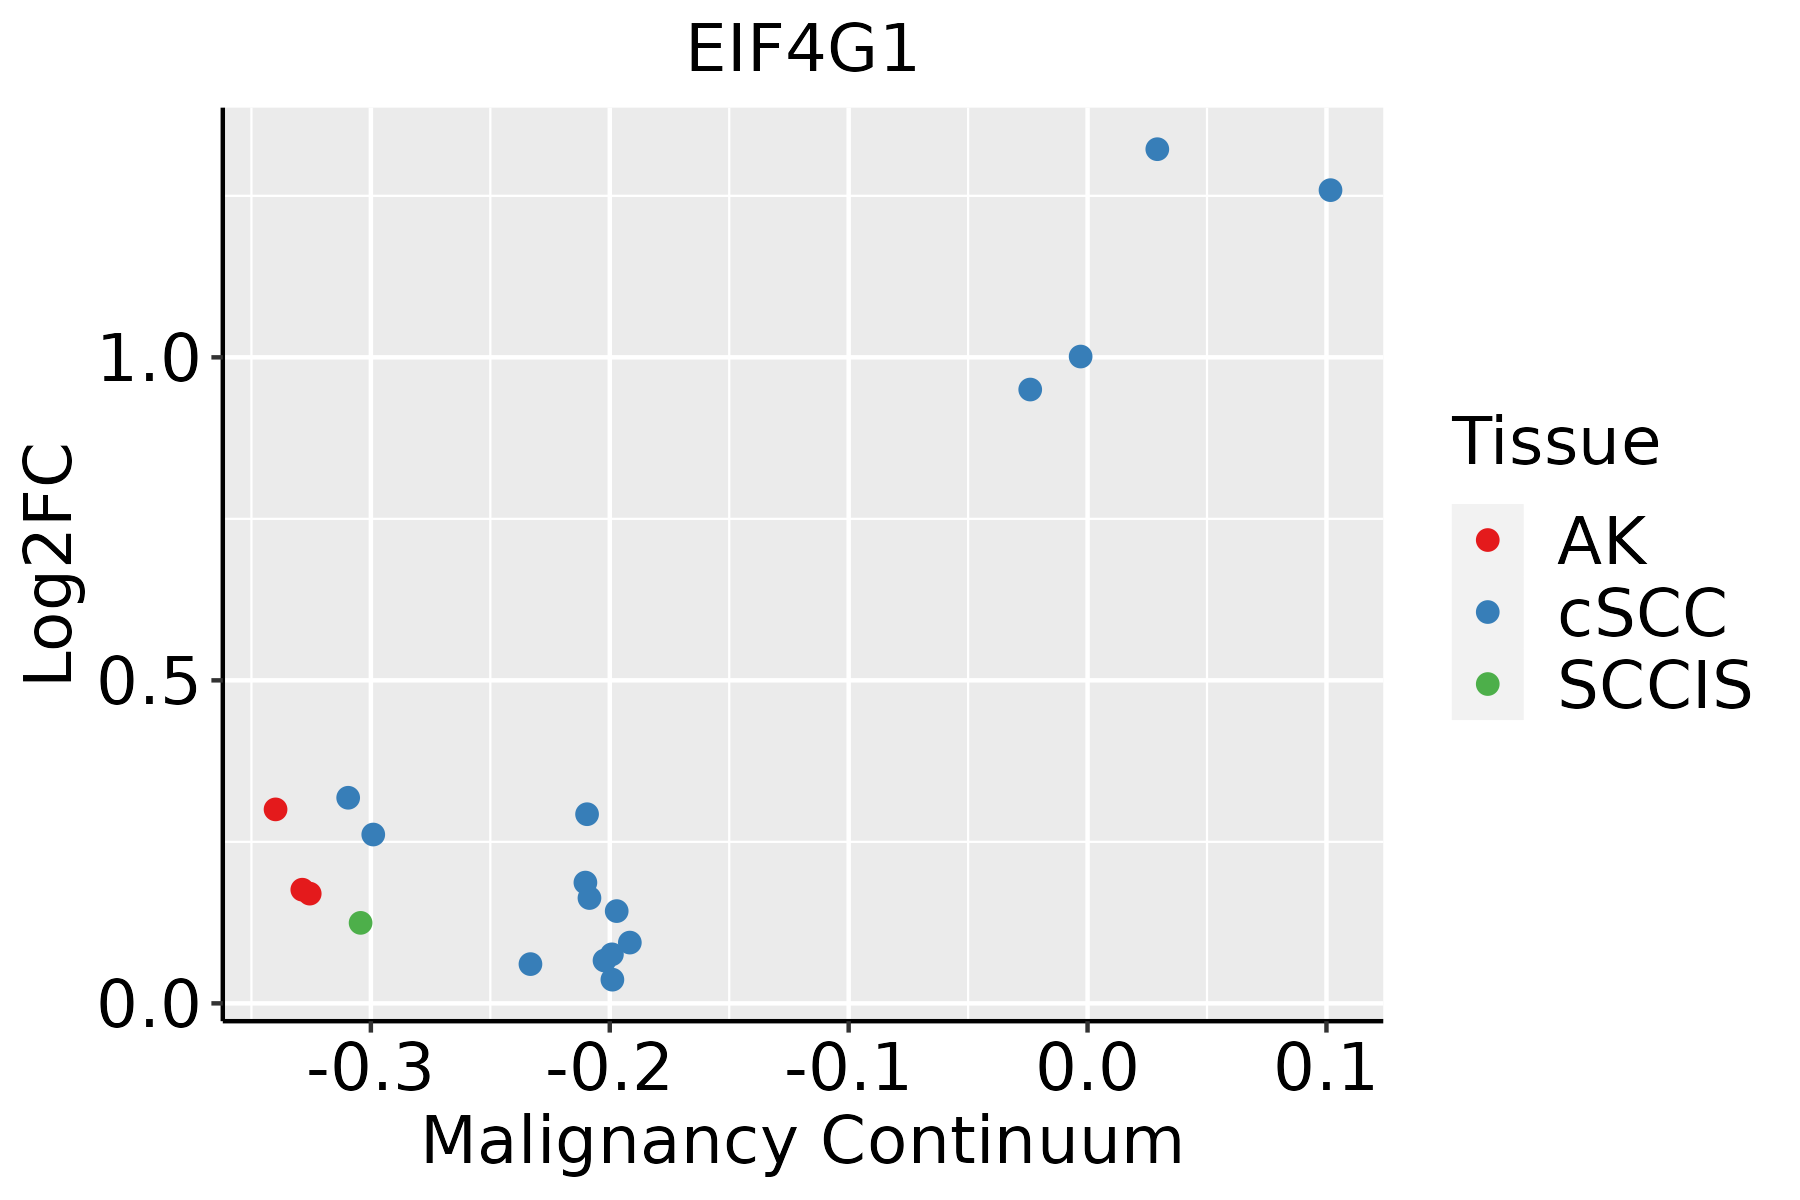 | AK: Actinic keratosis |
| cSCC: Cutaneous squamous cell carcinoma | ||
| SCCIS:squamous cell carcinoma in situ | ||
| Thyroid | 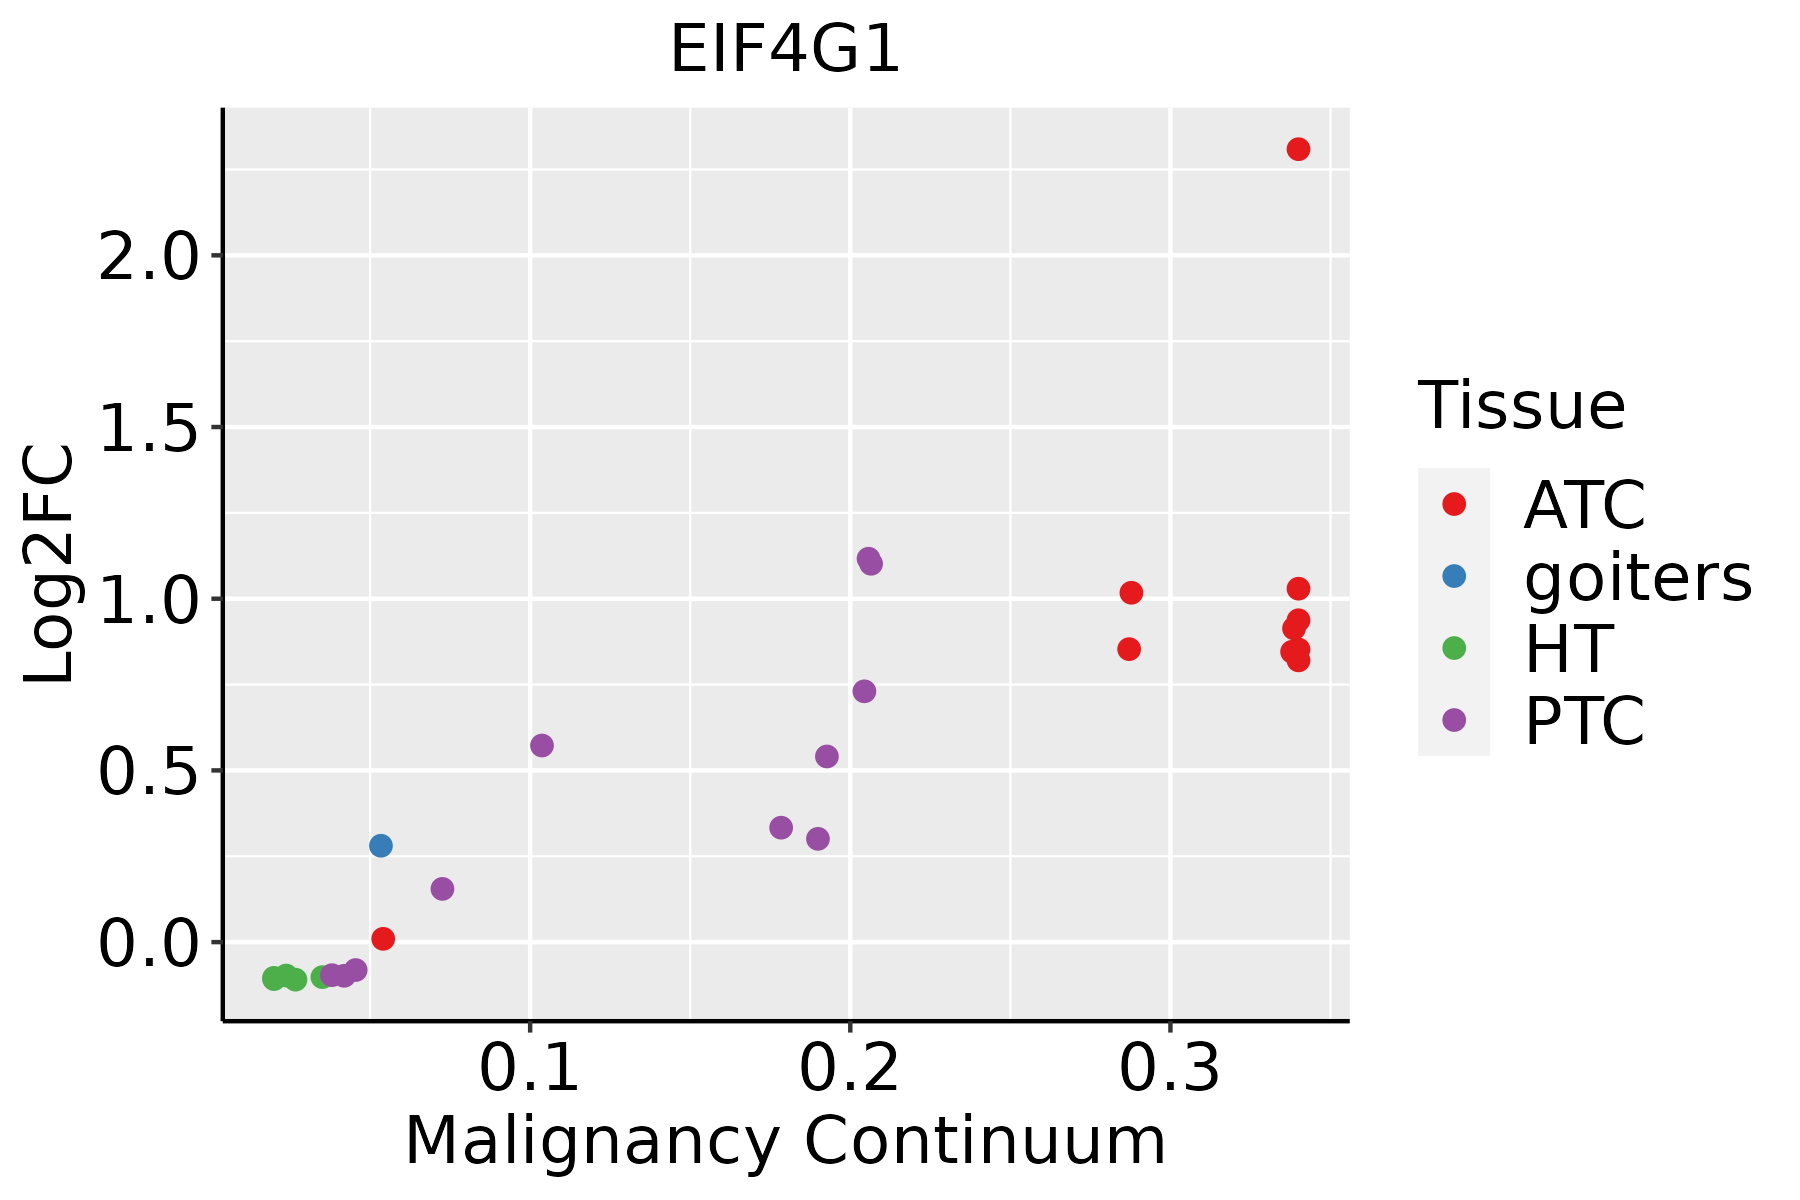 | ATC: Anaplastic thyroid cancer |
| HT: Hashimoto's thyroiditis | ||
| PTC: Papillary thyroid cancer |
| ∗log2FC in expression of this searched gene in stem-like cells from each diseased tissue sample relative to stem-like cells in normal samples in each tissue plotted against the malignancy continuum. Samples are colored based on if they are from different disease stage. |
Top |
Malignant transformation related pathway analysis |
| Find out the enriched GO biological processes and KEGG pathways involved in transition from healthy to precancer to cancer |
| Tissue | Disease Stage | Enriched GO biological Processes |
| Colorectum | AD |  |
| Colorectum | SER |  |
| Colorectum | MSS |  |
| Colorectum | MSI-H |  |
| Colorectum | FAP |  |
| ∗Top 15 enriched GO BP terms are showed in the bar plot of each disease state in each tissue. Each row represents a significant GO biological process which is colored according to the -log10(p.adjust). |
| Page: 1 2 3 4 5 6 7 8 9 |
| GO ID | Tissue | Disease Stage | Description | Gene Ratio | Bg Ratio | pvalue | p.adjust | Count |
| GO:0002181 | Colorectum | AD | cytoplasmic translation | 109/3918 | 148/18723 | 3.40e-43 | 2.13e-39 | 109 |
| GO:0009895 | Colorectum | AD | negative regulation of catabolic process | 124/3918 | 320/18723 | 1.66e-13 | 3.35e-11 | 124 |
| GO:0031330 | Colorectum | AD | negative regulation of cellular catabolic process | 104/3918 | 262/18723 | 2.66e-12 | 3.96e-10 | 104 |
| GO:0043254 | Colorectum | AD | regulation of protein-containing complex assembly | 148/3918 | 428/18723 | 2.64e-11 | 3.18e-09 | 148 |
| GO:0031334 | Colorectum | AD | positive regulation of protein-containing complex assembly | 91/3918 | 237/18723 | 4.78e-10 | 3.99e-08 | 91 |
| GO:0051098 | Colorectum | AD | regulation of binding | 126/3918 | 363/18723 | 6.01e-10 | 4.88e-08 | 126 |
| GO:0010506 | Colorectum | AD | regulation of autophagy | 111/3918 | 317/18723 | 3.57e-09 | 2.35e-07 | 111 |
| GO:0034329 | Colorectum | AD | cell junction assembly | 136/3918 | 420/18723 | 2.02e-08 | 1.15e-06 | 136 |
| GO:0034976 | Colorectum | AD | response to endoplasmic reticulum stress | 90/3918 | 256/18723 | 8.48e-08 | 4.28e-06 | 90 |
| GO:0051099 | Colorectum | AD | positive regulation of binding | 66/3918 | 173/18723 | 1.47e-07 | 6.64e-06 | 66 |
| GO:0002183 | Colorectum | AD | cytoplasmic translational initiation | 21/3918 | 34/18723 | 2.73e-07 | 1.09e-05 | 21 |
| GO:0070997 | Colorectum | AD | neuron death | 114/3918 | 361/18723 | 1.13e-06 | 3.72e-05 | 114 |
| GO:0006417 | Colorectum | AD | regulation of translation | 141/3918 | 468/18723 | 1.32e-06 | 4.22e-05 | 141 |
| GO:0016049 | Colorectum | AD | cell growth | 143/3918 | 482/18723 | 2.83e-06 | 8.09e-05 | 143 |
| GO:0001558 | Colorectum | AD | regulation of cell growth | 124/3918 | 414/18723 | 7.67e-06 | 1.86e-04 | 124 |
| GO:0031667 | Colorectum | AD | response to nutrient levels | 138/3918 | 474/18723 | 1.22e-05 | 2.68e-04 | 138 |
| GO:0010563 | Colorectum | AD | negative regulation of phosphorus metabolic process | 130/3918 | 442/18723 | 1.26e-05 | 2.76e-04 | 130 |
| GO:1901214 | Colorectum | AD | regulation of neuron death | 99/3918 | 319/18723 | 1.26e-05 | 2.76e-04 | 99 |
| GO:0006413 | Colorectum | AD | translational initiation | 45/3918 | 118/18723 | 1.35e-05 | 2.92e-04 | 45 |
| GO:0045936 | Colorectum | AD | negative regulation of phosphate metabolic process | 129/3918 | 441/18723 | 1.81e-05 | 3.76e-04 | 129 |
| Page: 1 2 3 4 5 6 7 8 9 10 11 12 13 14 15 16 17 18 19 20 21 22 23 24 25 26 27 28 29 30 31 32 33 34 35 36 37 38 39 40 41 42 43 44 45 46 47 48 49 50 51 |
| Pathway ID | Tissue | Disease Stage | Description | Gene Ratio | Bg Ratio | pvalue | p.adjust | qvalue | Count |
| hsa05416 | Colorectum | MSI-H | Viral myocarditis | 14/797 | 60/8465 | 1.09e-03 | 1.20e-02 | 1.01e-02 | 14 |
| hsa054161 | Colorectum | MSI-H | Viral myocarditis | 14/797 | 60/8465 | 1.09e-03 | 1.20e-02 | 1.01e-02 | 14 |
| hsa0541630 | Esophagus | ESCC | Viral myocarditis | 41/4205 | 60/8465 | 2.59e-03 | 7.05e-03 | 3.61e-03 | 41 |
| hsa05416114 | Esophagus | ESCC | Viral myocarditis | 41/4205 | 60/8465 | 2.59e-03 | 7.05e-03 | 3.61e-03 | 41 |
| hsa0541614 | Liver | Cirrhotic | Viral myocarditis | 28/2530 | 60/8465 | 4.38e-03 | 1.68e-02 | 1.03e-02 | 28 |
| hsa0541615 | Liver | Cirrhotic | Viral myocarditis | 28/2530 | 60/8465 | 4.38e-03 | 1.68e-02 | 1.03e-02 | 28 |
| hsa0541629 | Oral cavity | OSCC | Viral myocarditis | 39/3704 | 60/8465 | 7.13e-04 | 2.09e-03 | 1.07e-03 | 39 |
| hsa05416113 | Oral cavity | OSCC | Viral myocarditis | 39/3704 | 60/8465 | 7.13e-04 | 2.09e-03 | 1.07e-03 | 39 |
| hsa05416210 | Oral cavity | LP | Viral myocarditis | 32/2418 | 60/8465 | 4.55e-05 | 2.91e-04 | 1.88e-04 | 32 |
| hsa0541637 | Oral cavity | LP | Viral myocarditis | 32/2418 | 60/8465 | 4.55e-05 | 2.91e-04 | 1.88e-04 | 32 |
| hsa0541662 | Oral cavity | NEOLP | Viral myocarditis | 17/1112 | 60/8465 | 1.38e-03 | 6.45e-03 | 4.06e-03 | 17 |
| hsa0541672 | Oral cavity | NEOLP | Viral myocarditis | 17/1112 | 60/8465 | 1.38e-03 | 6.45e-03 | 4.06e-03 | 17 |
| hsa0541627 | Prostate | BPH | Viral myocarditis | 23/1718 | 60/8465 | 9.59e-04 | 4.47e-03 | 2.76e-03 | 23 |
| hsa05416112 | Prostate | BPH | Viral myocarditis | 23/1718 | 60/8465 | 9.59e-04 | 4.47e-03 | 2.76e-03 | 23 |
| hsa0541628 | Prostate | Tumor | Viral myocarditis | 24/1791 | 60/8465 | 6.83e-04 | 3.33e-03 | 2.06e-03 | 24 |
| hsa0541636 | Prostate | Tumor | Viral myocarditis | 24/1791 | 60/8465 | 6.83e-04 | 3.33e-03 | 2.06e-03 | 24 |
| Page: 1 |
Top |
Cell-cell communication analysis |
| Identification of potential cell-cell interactions between two cell types and their ligand-receptor pairs for different disease states |
| Ligand | Receptor | LRpair | Pathway | Tissue | Disease Stage |
| Page: 1 |
Top |
Single-cell gene regulatory network inference analysis |
| Find out the significant the regulons (TFs) and the target genes of each regulon across cell types for different disease states |
| TF | Cell Type | Tissue | Disease Stage | Target Gene | RSS | Regulon Activity |
| ∗The dot plots of a searched regulon are shown for all cell subpopulations in each disease state of each tissue based on the regulon specific score inferred using pySCENIC and by calculating the average expression. |
| Page: 1 |
Top |
Somatic mutation of malignant transformation related genes |
| Annotation of somatic variants for genes involved in malignant transformation |
| Hugo Symbol | Variant Class | Variant Classification | dbSNP RS | HGVSc | HGVSp | HGVSp Short | SWISSPROT | BIOTYPE | SIFT | PolyPhen | Tumor Sample Barcode | Tissue | Histology | Sex | Age | Stage | Therapy Types | Drugs | Outcome |
| EIF4G1 | SNV | Missense_Mutation | novel | c.4172N>A | p.Cys1391Tyr | p.C1391Y | Q04637 | protein_coding | deleterious(0) | probably_damaging(0.999) | TCGA-A7-A0CG-01 | Breast | breast invasive carcinoma | Female | >=65 | I/II | Unknown | Unknown | SD |
| EIF4G1 | SNV | Missense_Mutation | c.184C>T | p.Arg62Trp | p.R62W | Q04637 | protein_coding | deleterious(0) | possibly_damaging(0.609) | TCGA-A7-A13E-01 | Breast | breast invasive carcinoma | Female | <65 | I/II | Targeted Molecular therapy | bevacizumab | PD | |
| EIF4G1 | SNV | Missense_Mutation | c.2188N>A | p.Glu730Lys | p.E730K | Q04637 | protein_coding | deleterious(0.01) | possibly_damaging(0.905) | TCGA-AN-A046-01 | Breast | breast invasive carcinoma | Female | >=65 | I/II | Unknown | Unknown | SD | |
| EIF4G1 | SNV | Missense_Mutation | c.2701N>T | p.Arg901Cys | p.R901C | Q04637 | protein_coding | deleterious(0.01) | benign(0.344) | TCGA-BH-A0B3-01 | Breast | breast invasive carcinoma | Female | <65 | I/II | Chemotherapy | cyclophosphamide | SD | |
| EIF4G1 | SNV | Missense_Mutation | novel | c.364N>T | p.Val122Phe | p.V122F | Q04637 | protein_coding | deleterious(0.04) | possibly_damaging(0.862) | TCGA-BH-A0HL-01 | Breast | breast invasive carcinoma | Female | <65 | I/II | Chemotherapy | cyclophosphamide | SD |
| EIF4G1 | SNV | Missense_Mutation | rs571849011 | c.197C>T | p.Pro66Leu | p.P66L | Q04637 | protein_coding | deleterious(0) | benign(0.098) | TCGA-BH-A18U-01 | Breast | breast invasive carcinoma | Female | >=65 | III/IV | Unknown | Unknown | SD |
| EIF4G1 | SNV | Missense_Mutation | c.1457N>T | p.Gly486Val | p.G486V | Q04637 | protein_coding | tolerated(0.31) | probably_damaging(0.942) | TCGA-D8-A27G-01 | Breast | breast invasive carcinoma | Female | >=65 | I/II | Unknown | Unknown | SD | |
| EIF4G1 | SNV | Missense_Mutation | rs73053766 | c.3791A>G | p.Asn1264Ser | p.N1264S | Q04637 | protein_coding | deleterious(0.05) | benign(0.076) | TCGA-LD-A74U-01 | Breast | breast invasive carcinoma | Female | >=65 | III/IV | Chemotherapy | taxotere | SD |
| EIF4G1 | insertion | Frame_Shift_Ins | novel | c.3123_3124insGTTAA | p.Pro1042ValfsTer59 | p.P1042Vfs*59 | Q04637 | protein_coding | TCGA-A8-A093-01 | Breast | breast invasive carcinoma | Female | <65 | I/II | Hormone Therapy | tamoxiphen | SD | ||
| EIF4G1 | insertion | Nonsense_Mutation | novel | c.3124_3125insAGAGGCAATAATGCATGA | p.Pro1042delinsGlnArgGlnTerCysMetThr | p.P1042delinsQRQ*CMT | Q04637 | protein_coding | TCGA-A8-A093-01 | Breast | breast invasive carcinoma | Female | <65 | I/II | Hormone Therapy | tamoxiphen | SD |
| Page: 1 2 3 4 5 6 7 8 9 10 11 12 13 14 15 16 17 18 19 |
Top |
Related drugs of malignant transformation related genes |
| Identification of chemicals and drugs interact with genes involved in malignant transfromation |
| (DGIdb 4.0) |
| Entrez ID | Symbol | Category | Interaction Types | Drug Claim Name | Drug Name | PMIDs |
| 1981 | EIF4G1 | NA | INSULIN | INSULIN | 8521827 |
| Page: 1 |

Copyright 2023-Present -The University of Texas Health Science Center at Houston |