
|
|||||
|
 | |
| |
| |
| |
| |
| |
|
Gene: EIF1AD |
Gene summary for EIF1AD |
| Gene information | Species | Human | Gene symbol | EIF1AD | Gene ID | 84285 |
| Gene name | eukaryotic translation initiation factor 1A domain containing | |
| Gene Alias | OBELIX | |
| Cytomap | 11q13.1 | |
| Gene Type | protein-coding | GO ID | GO:0006412 | UniProtAcc | A0A024R5B9 |
Top |
Malignant transformation analysis |
| Identification of the aberrant gene expression in precancerous and cancerous lesions by comparing the gene expression of stem-like cells in diseased tissues with normal stem cells |
| Entrez ID | Symbol | Replicates | Species | Organ | Tissue | Adj P-value | Log2FC | Malignancy |
| 84285 | EIF1AD | P26T-E | Human | Esophagus | ESCC | 1.49e-11 | 2.49e-01 | 0.1276 |
| 84285 | EIF1AD | P27T-E | Human | Esophagus | ESCC | 2.91e-09 | 1.41e-01 | 0.1055 |
| 84285 | EIF1AD | P28T-E | Human | Esophagus | ESCC | 5.24e-29 | 5.13e-01 | 0.1149 |
| 84285 | EIF1AD | P30T-E | Human | Esophagus | ESCC | 7.11e-15 | 4.92e-01 | 0.137 |
| 84285 | EIF1AD | P31T-E | Human | Esophagus | ESCC | 5.83e-17 | 2.75e-01 | 0.1251 |
| 84285 | EIF1AD | P32T-E | Human | Esophagus | ESCC | 1.30e-22 | 4.38e-01 | 0.1666 |
| 84285 | EIF1AD | P36T-E | Human | Esophagus | ESCC | 5.53e-12 | 3.49e-01 | 0.1187 |
| 84285 | EIF1AD | P37T-E | Human | Esophagus | ESCC | 5.26e-14 | 2.81e-01 | 0.1371 |
| 84285 | EIF1AD | P39T-E | Human | Esophagus | ESCC | 2.20e-07 | 9.88e-02 | 0.0894 |
| 84285 | EIF1AD | P40T-E | Human | Esophagus | ESCC | 4.07e-02 | 7.51e-02 | 0.109 |
| 84285 | EIF1AD | P42T-E | Human | Esophagus | ESCC | 1.15e-07 | 3.13e-01 | 0.1175 |
| 84285 | EIF1AD | P44T-E | Human | Esophagus | ESCC | 9.98e-04 | 1.98e-01 | 0.1096 |
| 84285 | EIF1AD | P47T-E | Human | Esophagus | ESCC | 2.31e-11 | 1.52e-01 | 0.1067 |
| 84285 | EIF1AD | P48T-E | Human | Esophagus | ESCC | 2.88e-04 | 2.68e-02 | 0.0959 |
| 84285 | EIF1AD | P49T-E | Human | Esophagus | ESCC | 8.62e-12 | 1.01e+00 | 0.1768 |
| 84285 | EIF1AD | P52T-E | Human | Esophagus | ESCC | 9.00e-15 | 2.90e-01 | 0.1555 |
| 84285 | EIF1AD | P54T-E | Human | Esophagus | ESCC | 4.83e-09 | 1.57e-01 | 0.0975 |
| 84285 | EIF1AD | P56T-E | Human | Esophagus | ESCC | 2.97e-05 | 7.33e-01 | 0.1613 |
| 84285 | EIF1AD | P57T-E | Human | Esophagus | ESCC | 3.31e-03 | 9.37e-02 | 0.0926 |
| 84285 | EIF1AD | P61T-E | Human | Esophagus | ESCC | 2.90e-10 | 1.88e-01 | 0.099 |
| Page: 1 2 3 4 |
| Tissue | Expression Dynamics | Abbreviation |
| Esophagus | 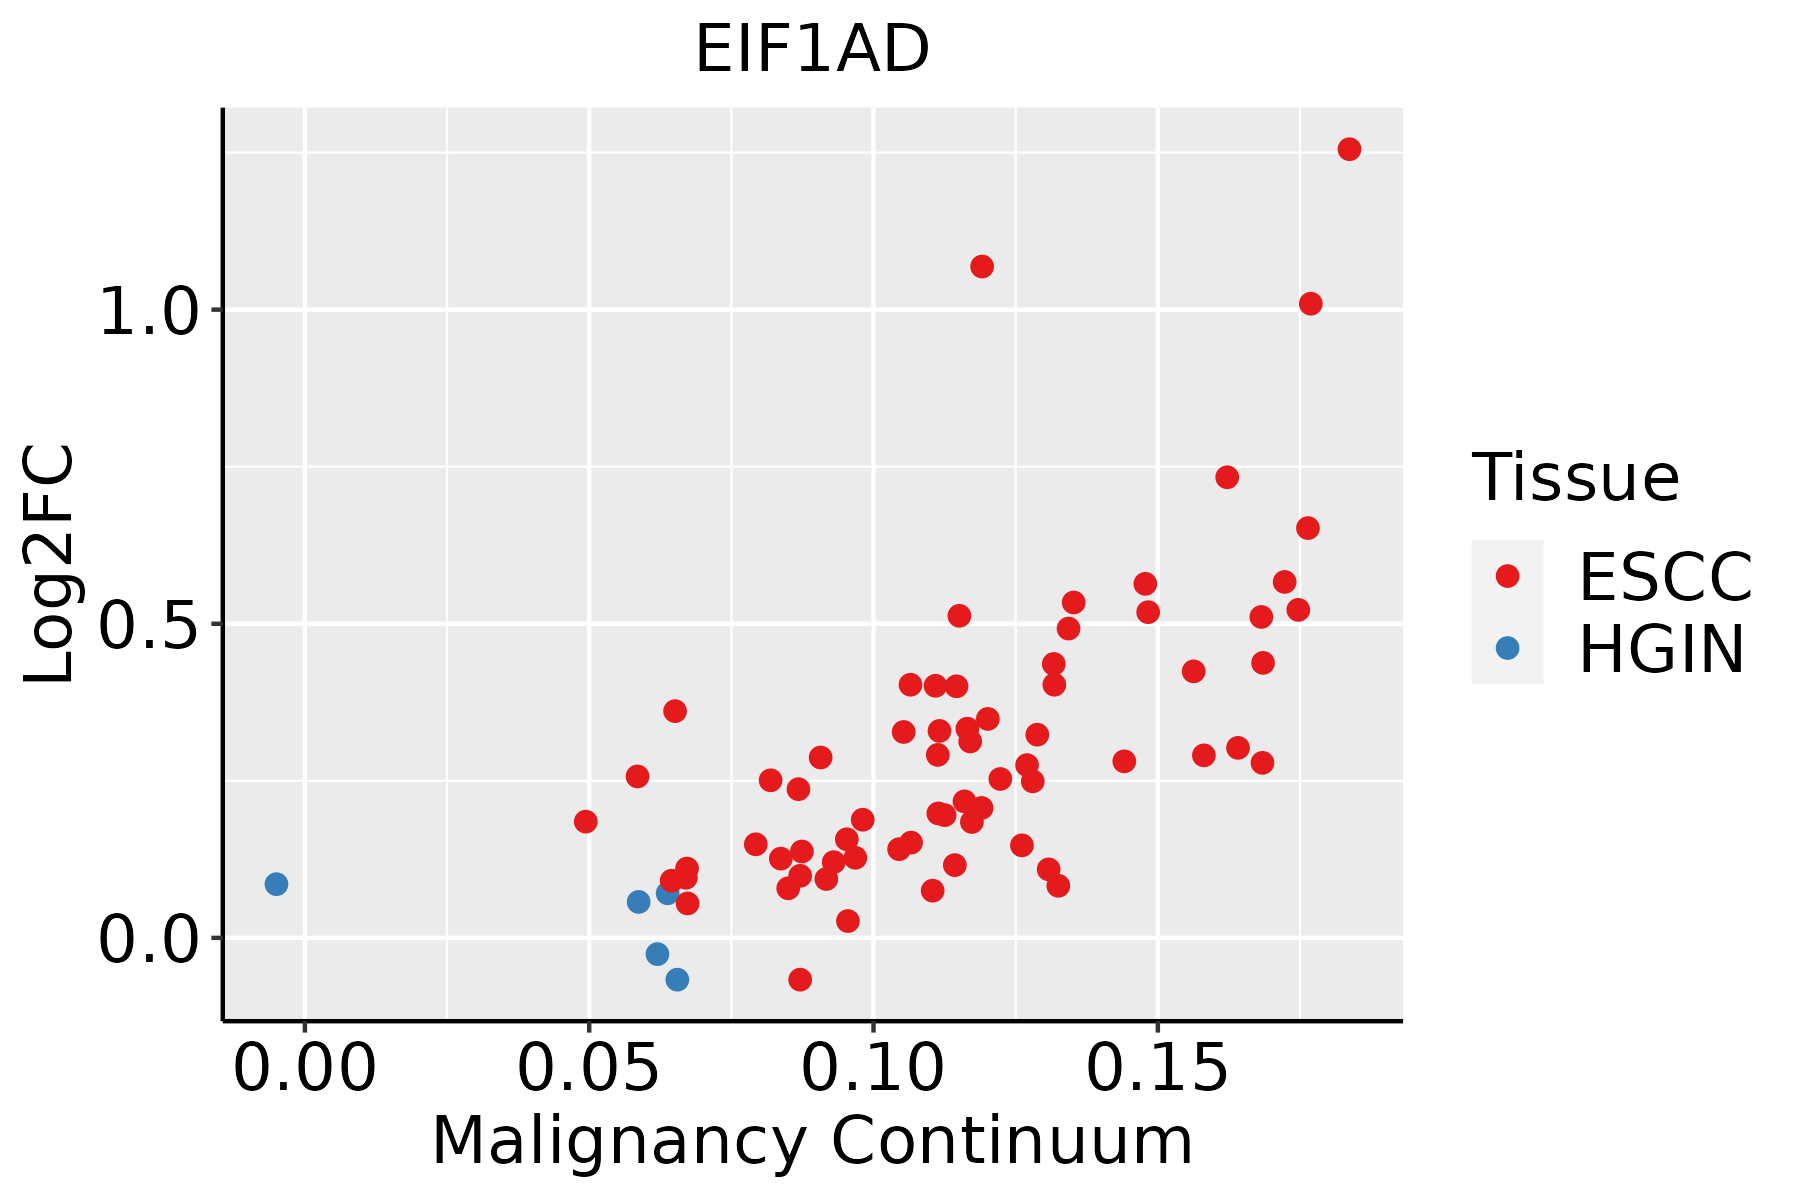 | ESCC: Esophageal squamous cell carcinoma |
| HGIN: High-grade intraepithelial neoplasias | ||
| LGIN: Low-grade intraepithelial neoplasias | ||
| Oral Cavity | 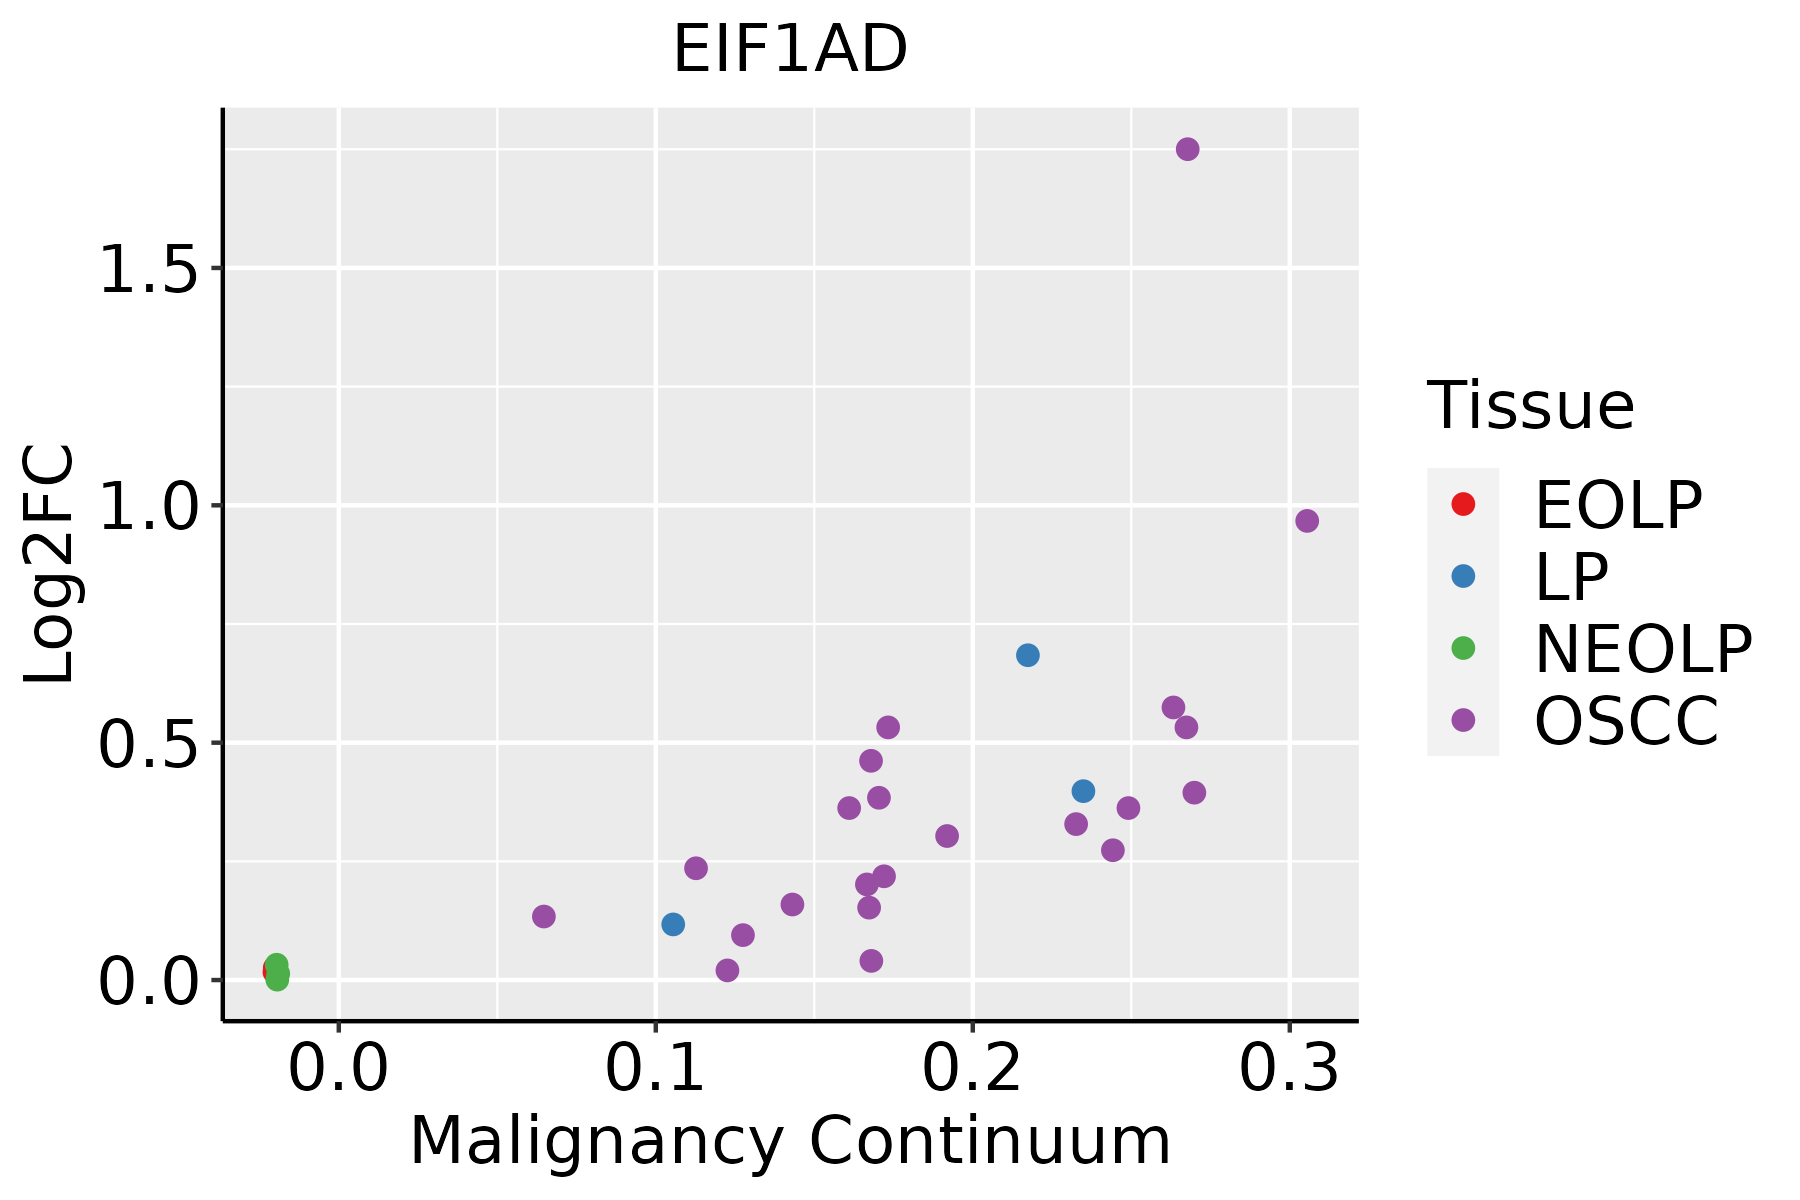 | EOLP: Erosive Oral lichen planus |
| LP: leukoplakia | ||
| NEOLP: Non-erosive oral lichen planus | ||
| OSCC: Oral squamous cell carcinoma |
| ∗log2FC in expression of this searched gene in stem-like cells from each diseased tissue sample relative to stem-like cells in normal samples in each tissue plotted against the malignancy continuum. Samples are colored based on if they are from different disease stage. |
Top |
Malignant transformation related pathway analysis |
| Find out the enriched GO biological processes and KEGG pathways involved in transition from healthy to precancer to cancer |
| Tissue | Disease Stage | Enriched GO biological Processes |
| Colorectum | AD |  |
| Colorectum | SER |  |
| Colorectum | MSS |  |
| Colorectum | MSI-H |  |
| Colorectum | FAP |  |
| ∗Top 15 enriched GO BP terms are showed in the bar plot of each disease state in each tissue. Each row represents a significant GO biological process which is colored according to the -log10(p.adjust). |
| Page: 1 2 3 4 5 6 7 8 9 |
| GO ID | Tissue | Disease Stage | Description | Gene Ratio | Bg Ratio | pvalue | p.adjust | Count |
| GO:0006413110 | Esophagus | ESCC | translational initiation | 100/8552 | 118/18723 | 1.16e-18 | 1.25e-16 | 100 |
| GO:000641318 | Oral cavity | OSCC | translational initiation | 96/7305 | 118/18723 | 4.02e-21 | 7.06e-19 | 96 |
| GO:000641319 | Oral cavity | LP | translational initiation | 75/4623 | 118/18723 | 3.96e-19 | 7.52e-17 | 75 |
| Page: 1 |
| Pathway ID | Tissue | Disease Stage | Description | Gene Ratio | Bg Ratio | pvalue | p.adjust | qvalue | Count |
| Page: 1 |
Top |
Cell-cell communication analysis |
| Identification of potential cell-cell interactions between two cell types and their ligand-receptor pairs for different disease states |
| Ligand | Receptor | LRpair | Pathway | Tissue | Disease Stage |
| Page: 1 |
Top |
Single-cell gene regulatory network inference analysis |
| Find out the significant the regulons (TFs) and the target genes of each regulon across cell types for different disease states |
| TF | Cell Type | Tissue | Disease Stage | Target Gene | RSS | Regulon Activity |
| ∗The dot plots of a searched regulon are shown for all cell subpopulations in each disease state of each tissue based on the regulon specific score inferred using pySCENIC and by calculating the average expression. |
| Page: 1 |
Top |
Somatic mutation of malignant transformation related genes |
| Annotation of somatic variants for genes involved in malignant transformation |
| Hugo Symbol | Variant Class | Variant Classification | dbSNP RS | HGVSc | HGVSp | HGVSp Short | SWISSPROT | BIOTYPE | SIFT | PolyPhen | Tumor Sample Barcode | Tissue | Histology | Sex | Age | Stage | Therapy Types | Drugs | Outcome |
| EIF1AD | SNV | Missense_Mutation | c.13A>G | p.Thr5Ala | p.T5A | Q8N9N8 | protein_coding | deleterious(0) | possibly_damaging(0.622) | TCGA-C8-A12K-01 | Breast | breast invasive carcinoma | Female | >=65 | I/II | Unknown | Unknown | SD | |
| EIF1AD | SNV | Missense_Mutation | rs763730593 | c.143N>A | p.Arg48His | p.R48H | Q8N9N8 | protein_coding | tolerated(0.09) | benign(0.018) | TCGA-F4-6703-01 | Colorectum | colon adenocarcinoma | Male | <65 | I/II | Unknown | Unknown | SD |
| EIF1AD | SNV | Missense_Mutation | novel | c.49G>A | p.Glu17Lys | p.E17K | Q8N9N8 | protein_coding | deleterious(0.04) | benign(0.412) | TCGA-AJ-A3BH-01 | Endometrium | uterine corpus endometrioid carcinoma | Female | Unknown | I/II | Unknown | Unknown | SD |
| EIF1AD | SNV | Missense_Mutation | rs201148001 | c.281N>A | p.Arg94His | p.R94H | Q8N9N8 | protein_coding | tolerated(0.05) | possibly_damaging(0.649) | TCGA-AP-A1DK-01 | Endometrium | uterine corpus endometrioid carcinoma | Female | <65 | I/II | Unknown | Unknown | SD |
| EIF1AD | SNV | Missense_Mutation | rs377762380 | c.280N>T | p.Arg94Cys | p.R94C | Q8N9N8 | protein_coding | deleterious(0) | possibly_damaging(0.859) | TCGA-AX-A1CE-01 | Endometrium | uterine corpus endometrioid carcinoma | Female | <65 | I/II | Unspecific | Paclitaxel | SD |
| EIF1AD | SNV | Missense_Mutation | novel | c.387N>T | p.Gln129His | p.Q129H | Q8N9N8 | protein_coding | tolerated(0.24) | benign(0) | TCGA-DF-A2KU-01 | Endometrium | uterine corpus endometrioid carcinoma | Female | Unknown | I/II | Unknown | Unknown | SD |
| EIF1AD | SNV | Missense_Mutation | novel | c.421N>G | p.Ser141Ala | p.S141A | Q8N9N8 | protein_coding | tolerated(0.2) | benign(0.344) | TCGA-E6-A1LX-01 | Endometrium | uterine corpus endometrioid carcinoma | Female | <65 | I/II | Unknown | Unknown | SD |
| EIF1AD | SNV | Missense_Mutation | c.452N>T | p.Gln151Leu | p.Q151L | Q8N9N8 | protein_coding | tolerated(0.06) | benign(0.003) | TCGA-53-7624-01 | Lung | lung adenocarcinoma | Female | <65 | III/IV | Chemotherapy | cisplatin | PD | |
| EIF1AD | SNV | Missense_Mutation | c.305G>T | p.Trp102Leu | p.W102L | Q8N9N8 | protein_coding | deleterious(0) | probably_damaging(0.999) | TCGA-43-5668-01 | Lung | lung squamous cell carcinoma | Male | >=65 | I/II | Other, specify in notesMAGE3-AS15-NSC-003 | clinical | PD | |
| EIF1AD | SNV | Missense_Mutation | novel | c.455N>G | p.Tyr152Cys | p.Y152C | Q8N9N8 | protein_coding | deleterious(0.01) | benign(0) | TCGA-68-8250-01 | Lung | lung squamous cell carcinoma | Male | >=65 | I/II | Unknown | Unknown | SD |
| Page: 1 2 |
Top |
Related drugs of malignant transformation related genes |
| Identification of chemicals and drugs interact with genes involved in malignant transfromation |
| (DGIdb 4.0) |
| Entrez ID | Symbol | Category | Interaction Types | Drug Claim Name | Drug Name | PMIDs |
| Page: 1 |

Copyright 2023-Present -The University of Texas Health Science Center at Houston |