
|
|||||
|
 | |
| |
| |
| |
| |
| |
|
Gene: EGR3 |
Gene summary for EGR3 |
| Gene information | Species | Human | Gene symbol | EGR3 | Gene ID | 1960 |
| Gene name | early growth response 3 | |
| Gene Alias | EGR-3 | |
| Cytomap | 8p21.3 | |
| Gene Type | protein-coding | GO ID | GO:0001525 | UniProtAcc | B4DH80 |
Top |
Malignant transformation analysis |
| Identification of the aberrant gene expression in precancerous and cancerous lesions by comparing the gene expression of stem-like cells in diseased tissues with normal stem cells |
| Entrez ID | Symbol | Replicates | Species | Organ | Tissue | Adj P-value | Log2FC | Malignancy |
| 1960 | EGR3 | P37T-E | Human | Esophagus | ESCC | 3.07e-02 | -9.30e-03 | 0.1371 |
| 1960 | EGR3 | P42T-E | Human | Esophagus | ESCC | 2.44e-03 | 2.55e-01 | 0.1175 |
| 1960 | EGR3 | P47T-E | Human | Esophagus | ESCC | 4.78e-14 | 7.00e-01 | 0.1067 |
| 1960 | EGR3 | P48T-E | Human | Esophagus | ESCC | 3.73e-05 | 5.41e-01 | 0.0959 |
| 1960 | EGR3 | P54T-E | Human | Esophagus | ESCC | 2.10e-07 | 5.06e-01 | 0.0975 |
| 1960 | EGR3 | P56T-E | Human | Esophagus | ESCC | 5.88e-03 | 1.30e-01 | 0.1613 |
| 1960 | EGR3 | P61T-E | Human | Esophagus | ESCC | 3.76e-04 | 1.76e-01 | 0.099 |
| 1960 | EGR3 | P62T-E | Human | Esophagus | ESCC | 1.37e-20 | 6.05e-01 | 0.1302 |
| 1960 | EGR3 | P74T-E | Human | Esophagus | ESCC | 7.64e-07 | -5.15e-02 | 0.1479 |
| 1960 | EGR3 | P76T-E | Human | Esophagus | ESCC | 1.77e-04 | 1.09e-01 | 0.1207 |
| 1960 | EGR3 | P80T-E | Human | Esophagus | ESCC | 7.88e-04 | 2.09e-01 | 0.155 |
| 1960 | EGR3 | P89T-E | Human | Esophagus | ESCC | 6.12e-05 | -5.45e-02 | 0.1752 |
| 1960 | EGR3 | P127T-E | Human | Esophagus | ESCC | 8.17e-03 | 2.80e-02 | 0.0826 |
| 1960 | EGR3 | P128T-E | Human | Esophagus | ESCC | 1.59e-06 | 1.15e-02 | 0.1241 |
| 1960 | EGR3 | C08 | Human | Oral cavity | OSCC | 5.83e-04 | 2.24e-01 | 0.1919 |
| 1960 | EGR3 | C86 | Human | Oral cavity | OSCC | 6.74e-03 | 3.57e-01 | 0.161 |
| 1960 | EGR3 | C09 | Human | Oral cavity | OSCC | 2.70e-39 | 1.89e+00 | 0.1431 |
| 1960 | EGR3 | SYSMH2 | Human | Oral cavity | OSCC | 3.40e-13 | 5.33e-01 | 0.2326 |
| 1960 | EGR3 | SYSMH3 | Human | Oral cavity | OSCC | 1.34e-02 | 2.43e-01 | 0.2442 |
| 1960 | EGR3 | SYSMH4 | Human | Oral cavity | OSCC | 1.29e-14 | 4.01e-01 | 0.1226 |
| Page: 1 2 3 |
| Tissue | Expression Dynamics | Abbreviation |
| Esophagus | 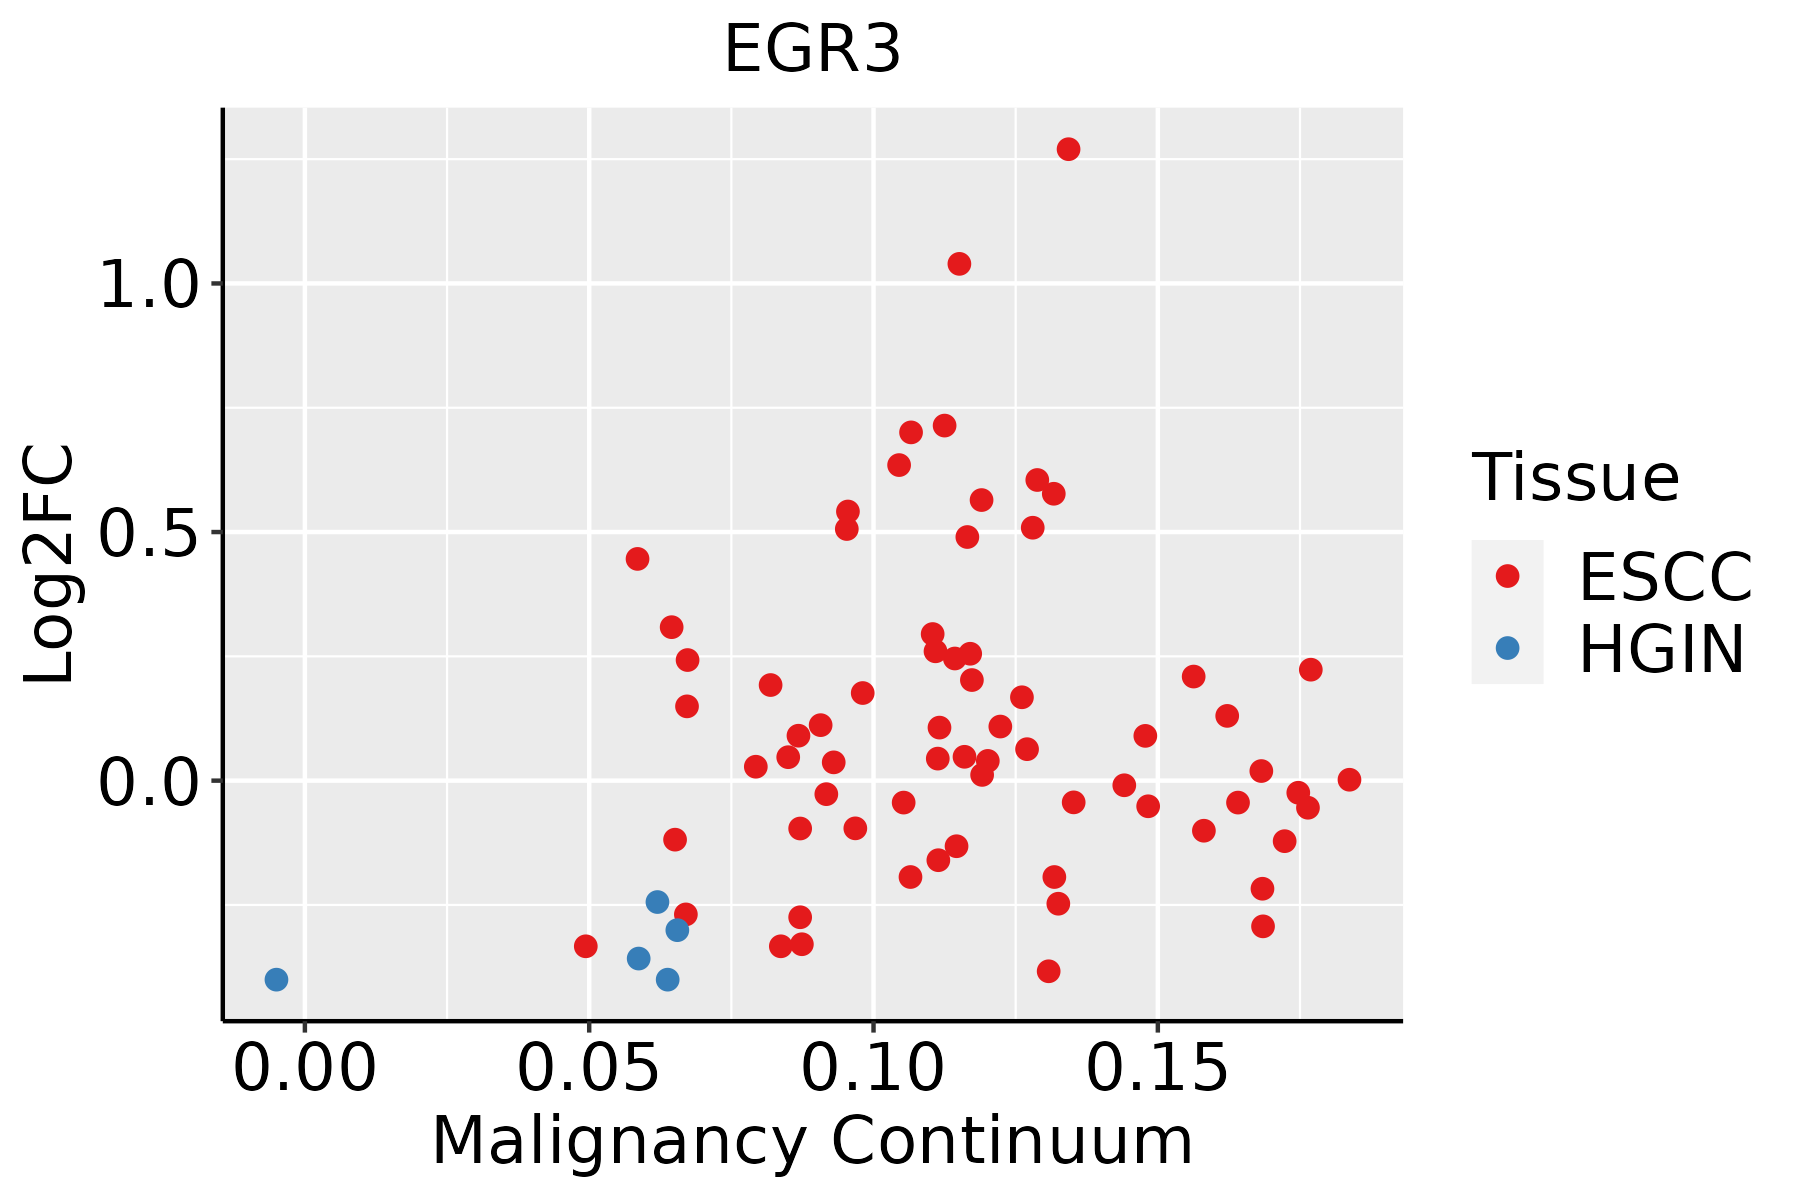 | ESCC: Esophageal squamous cell carcinoma |
| HGIN: High-grade intraepithelial neoplasias | ||
| LGIN: Low-grade intraepithelial neoplasias | ||
| Oral Cavity | 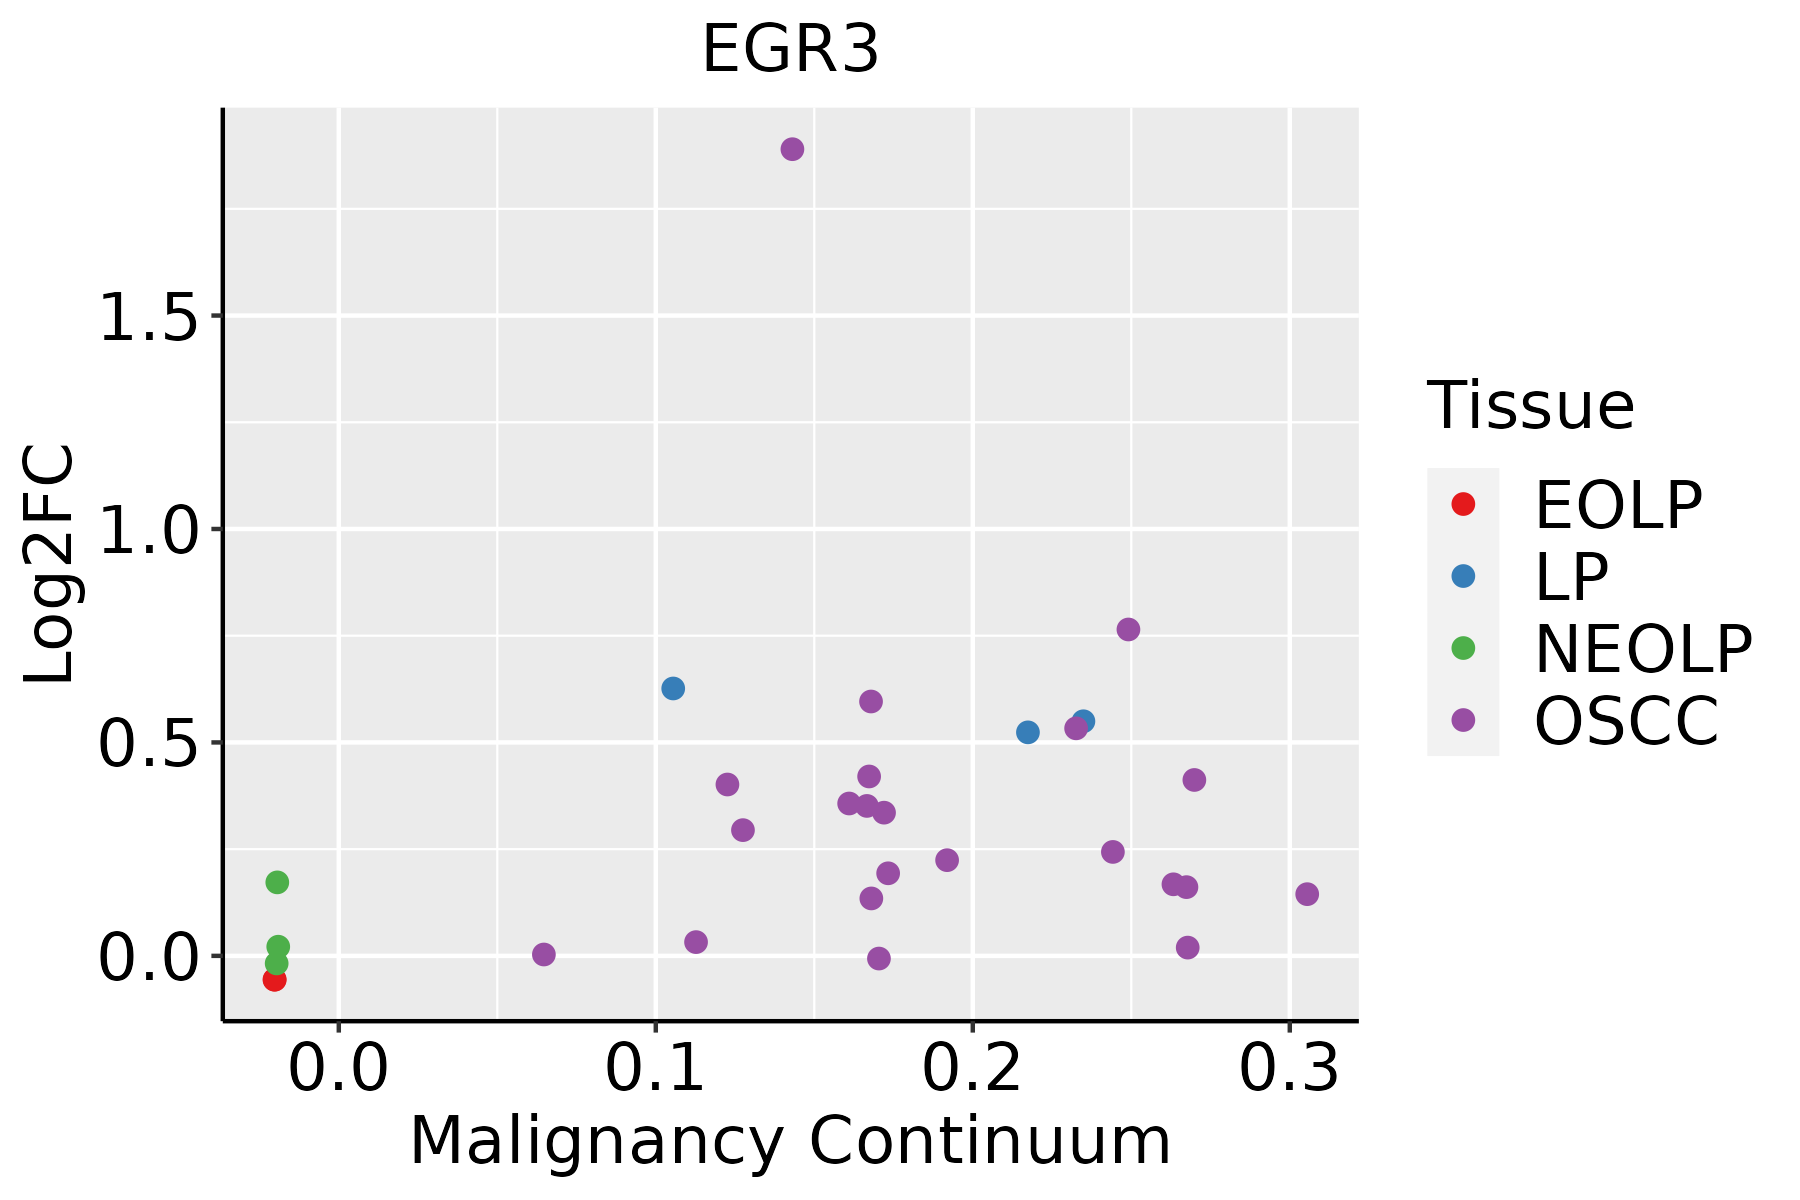 | EOLP: Erosive Oral lichen planus |
| LP: leukoplakia | ||
| NEOLP: Non-erosive oral lichen planus | ||
| OSCC: Oral squamous cell carcinoma |
| ∗log2FC in expression of this searched gene in stem-like cells from each diseased tissue sample relative to stem-like cells in normal samples in each tissue plotted against the malignancy continuum. Samples are colored based on if they are from different disease stage. |
Top |
Malignant transformation related pathway analysis |
| Find out the enriched GO biological processes and KEGG pathways involved in transition from healthy to precancer to cancer |
| Tissue | Disease Stage | Enriched GO biological Processes |
| Colorectum | AD |  |
| Colorectum | SER |  |
| Colorectum | MSS |  |
| Colorectum | MSI-H |  |
| Colorectum | FAP |  |
| ∗Top 15 enriched GO BP terms are showed in the bar plot of each disease state in each tissue. Each row represents a significant GO biological process which is colored according to the -log10(p.adjust). |
| Page: 1 2 3 4 5 6 7 8 9 |
| GO ID | Tissue | Disease Stage | Description | Gene Ratio | Bg Ratio | pvalue | p.adjust | Count |
| GO:004578527 | Esophagus | ESCC | positive regulation of cell adhesion | 255/8552 | 437/18723 | 5.07e-08 | 9.11e-07 | 255 |
| GO:005067318 | Esophagus | ESCC | epithelial cell proliferation | 238/8552 | 437/18723 | 1.19e-04 | 8.20e-04 | 238 |
| GO:1903706110 | Esophagus | ESCC | regulation of hemopoiesis | 201/8552 | 367/18723 | 2.60e-04 | 1.58e-03 | 201 |
| GO:19021076 | Esophagus | ESCC | positive regulation of leukocyte differentiation | 93/8552 | 157/18723 | 4.20e-04 | 2.39e-03 | 93 |
| GO:19037086 | Esophagus | ESCC | positive regulation of hemopoiesis | 93/8552 | 157/18723 | 4.20e-04 | 2.39e-03 | 93 |
| GO:005067817 | Esophagus | ESCC | regulation of epithelial cell proliferation | 206/8552 | 381/18723 | 5.51e-04 | 3.02e-03 | 206 |
| GO:002240720 | Esophagus | ESCC | regulation of cell-cell adhesion | 239/8552 | 448/18723 | 5.88e-04 | 3.19e-03 | 239 |
| GO:004851118 | Esophagus | ESCC | rhythmic process | 164/8552 | 298/18723 | 6.80e-04 | 3.57e-03 | 164 |
| GO:000762319 | Esophagus | ESCC | circadian rhythm | 119/8552 | 210/18723 | 8.47e-04 | 4.36e-03 | 119 |
| GO:004211018 | Esophagus | ESCC | T cell activation | 256/8552 | 487/18723 | 1.18e-03 | 5.87e-03 | 256 |
| GO:19031317 | Esophagus | ESCC | mononuclear cell differentiation | 226/8552 | 426/18723 | 1.20e-03 | 5.88e-03 | 226 |
| GO:000166720 | Esophagus | ESCC | ameboidal-type cell migration | 250/8552 | 475/18723 | 1.22e-03 | 5.97e-03 | 250 |
| GO:002240919 | Esophagus | ESCC | positive regulation of cell-cell adhesion | 155/8552 | 284/18723 | 1.50e-03 | 7.06e-03 | 155 |
| GO:190210510 | Esophagus | ESCC | regulation of leukocyte differentiation | 152/8552 | 279/18723 | 1.82e-03 | 8.35e-03 | 152 |
| GO:00456213 | Esophagus | ESCC | positive regulation of lymphocyte differentiation | 61/8552 | 104/18723 | 5.22e-03 | 1.97e-02 | 61 |
| GO:001063120 | Esophagus | ESCC | epithelial cell migration | 187/8552 | 357/18723 | 6.05e-03 | 2.23e-02 | 187 |
| GO:009013220 | Esophagus | ESCC | epithelium migration | 188/8552 | 360/18723 | 6.96e-03 | 2.54e-02 | 188 |
| GO:005087015 | Esophagus | ESCC | positive regulation of T cell activation | 117/8552 | 216/18723 | 7.23e-03 | 2.62e-02 | 117 |
| GO:009013020 | Esophagus | ESCC | tissue migration | 190/8552 | 365/18723 | 7.91e-03 | 2.82e-02 | 190 |
| GO:00302176 | Esophagus | ESCC | T cell differentiation | 137/8552 | 257/18723 | 8.09e-03 | 2.87e-02 | 137 |
| Page: 1 2 3 |
| Pathway ID | Tissue | Disease Stage | Description | Gene Ratio | Bg Ratio | pvalue | p.adjust | qvalue | Count |
| hsa0520325 | Esophagus | ESCC | Viral carcinogenesis | 137/4205 | 204/8465 | 2.47e-07 | 1.88e-06 | 9.62e-07 | 137 |
| hsa051619 | Esophagus | ESCC | Hepatitis B | 108/4205 | 162/8465 | 7.68e-06 | 4.15e-05 | 2.12e-05 | 108 |
| hsa046259 | Esophagus | ESCC | C-type lectin receptor signaling pathway | 73/4205 | 104/8465 | 1.57e-05 | 7.98e-05 | 4.09e-05 | 73 |
| hsa0520335 | Esophagus | ESCC | Viral carcinogenesis | 137/4205 | 204/8465 | 2.47e-07 | 1.88e-06 | 9.62e-07 | 137 |
| hsa0516114 | Esophagus | ESCC | Hepatitis B | 108/4205 | 162/8465 | 7.68e-06 | 4.15e-05 | 2.12e-05 | 108 |
| hsa0462513 | Esophagus | ESCC | C-type lectin receptor signaling pathway | 73/4205 | 104/8465 | 1.57e-05 | 7.98e-05 | 4.09e-05 | 73 |
| Page: 1 |
Top |
Cell-cell communication analysis |
| Identification of potential cell-cell interactions between two cell types and their ligand-receptor pairs for different disease states |
| Ligand | Receptor | LRpair | Pathway | Tissue | Disease Stage |
| Page: 1 |
Top |
Single-cell gene regulatory network inference analysis |
| Find out the significant the regulons (TFs) and the target genes of each regulon across cell types for different disease states |
| TF | Cell Type | Tissue | Disease Stage | Target Gene | RSS | Regulon Activity |
| EGR3 | DC | Breast | Precancer | EGR2,NFKBID,TNF, etc. | 6.41e-02 |  |
| EGR3 | CD8TRM | Breast | Precancer | EGR2,NFKBID,TNF, etc. | 6.73e-02 | |
| EGR3 | MON | Breast | Precancer | EGR2,NFKBID,TNF, etc. | 4.04e-02 | |
| EGR3 | KUP | Liver | HCC | EGR2,ASCL2,CCL4L2, etc. | 4.50e-01 |  |
| EGR3 | BN | Liver | HCC | EGR2,ASCL2,CCL4L2, etc. | 3.91e-02 | |
| EGR3 | MAST | Lung | AIS | EGR1,MIR155HG,MYC, etc. | 1.95e-01 |  |
| EGR3 | STM | Oral cavity | ADJ | CHL1,IGF2,IRS2, etc. | 7.23e-01 |  |
| EGR3 | MAIT | Oral cavity | NEOLP | NR4A1,FCER1A,EGR2, etc. | 1.97e-01 |  |
| EGR3 | NEUT | Pancreas | ADJ | NFKBID,CXCL8,EGR2, etc. | 2.69e-01 |  |
| EGR3 | CD8TCM | Pancreas | PDAC | NFKBID,CXCL8,EGR2, etc. | 2.16e-01 |  |
| ∗The dot plots of a searched regulon are shown for all cell subpopulations in each disease state of each tissue based on the regulon specific score inferred using pySCENIC and by calculating the average expression. |
| Page: 1 2 |
Top |
Somatic mutation of malignant transformation related genes |
| Annotation of somatic variants for genes involved in malignant transformation |
| Hugo Symbol | Variant Class | Variant Classification | dbSNP RS | HGVSc | HGVSp | HGVSp Short | SWISSPROT | BIOTYPE | SIFT | PolyPhen | Tumor Sample Barcode | Tissue | Histology | Sex | Age | Stage | Therapy Types | Drugs | Outcome |
| EGR3 | SNV | Missense_Mutation | novel | c.1109N>G | p.Ser370Cys | p.S370C | Q06889 | protein_coding | deleterious(0.05) | benign(0.334) | TCGA-AC-A23H-01 | Breast | breast invasive carcinoma | Female | >=65 | I/II | Unknown | Unknown | PD |
| EGR3 | SNV | Missense_Mutation | c.1043N>A | p.Arg348His | p.R348H | Q06889 | protein_coding | deleterious(0) | probably_damaging(0.981) | TCGA-E2-A159-01 | Breast | breast invasive carcinoma | Female | <65 | I/II | Chemotherapy | cyclophosphamide | SD | |
| EGR3 | deletion | Frame_Shift_Del | c.457_464delNNNNNNNN | p.Leu153ArgfsTer38 | p.L153Rfs*38 | Q06889 | protein_coding | TCGA-BH-A0DO-01 | Breast | breast invasive carcinoma | Female | >=65 | I/II | Unknown | Unknown | SD | |||
| EGR3 | SNV | Missense_Mutation | c.365N>T | p.Thr122Met | p.T122M | Q06889 | protein_coding | deleterious(0.03) | probably_damaging(0.973) | TCGA-MU-A51Y-01 | Cervix | cervical & endocervical cancer | Female | <65 | I/II | Unknown | Unknown | SD | |
| EGR3 | SNV | Missense_Mutation | novel | c.466N>C | p.Glu156Gln | p.E156Q | Q06889 | protein_coding | tolerated(0.09) | possibly_damaging(0.89) | TCGA-VS-A9V1-01 | Cervix | cervical & endocervical cancer | Female | <65 | I/II | Chemotherapy | cisplatin | PD |
| EGR3 | SNV | Missense_Mutation | c.1019G>A | p.Arg340His | p.R340H | Q06889 | protein_coding | deleterious(0) | probably_damaging(0.999) | TCGA-A6-2686-01 | Colorectum | colon adenocarcinoma | Female | >=65 | I/II | Unknown | Unknown | SD | |
| EGR3 | SNV | Missense_Mutation | novel | c.457C>A | p.Leu153Ile | p.L153I | Q06889 | protein_coding | tolerated(0.8) | benign(0.163) | TCGA-AA-3877-01 | Colorectum | colon adenocarcinoma | Female | >=65 | I/II | Unknown | Unknown | SD |
| EGR3 | SNV | Missense_Mutation | novel | c.689N>T | p.Thr230Ile | p.T230I | Q06889 | protein_coding | deleterious(0) | probably_damaging(0.978) | TCGA-AA-3947-01 | Colorectum | colon adenocarcinoma | Female | <65 | I/II | Unknown | Unknown | SD |
| EGR3 | SNV | Missense_Mutation | c.1127C>A | p.Pro376His | p.P376H | Q06889 | protein_coding | tolerated_low_confidence(0.06) | benign(0) | TCGA-AA-3976-01 | Colorectum | colon adenocarcinoma | Male | >=65 | III/IV | Chemotherapy | folinic | CR | |
| EGR3 | SNV | Missense_Mutation | novel | c.122A>G | p.Asp41Gly | p.D41G | Q06889 | protein_coding | tolerated(0.23) | benign(0.006) | TCGA-AA-A010-01 | Colorectum | colon adenocarcinoma | Female | <65 | I/II | Chemotherapy | folinic | CR |
| Page: 1 2 3 4 5 6 |
Top |
Related drugs of malignant transformation related genes |
| Identification of chemicals and drugs interact with genes involved in malignant transfromation |
| (DGIdb 4.0) |
| Entrez ID | Symbol | Category | Interaction Types | Drug Claim Name | Drug Name | PMIDs |
| Page: 1 |

Copyright 2023-Present -The University of Texas Health Science Center at Houston |