
|
|||||
|
 | |
| |
| |
| |
| |
| |
|
Gene: EGFL7 |
Gene summary for EGFL7 |
| Gene information | Species | Human | Gene symbol | EGFL7 | Gene ID | 51162 |
| Gene name | EGF like domain multiple 7 | |
| Gene Alias | NEU1 | |
| Cytomap | 9q34.3 | |
| Gene Type | protein-coding | GO ID | GO:0001525 | UniProtAcc | A0A024R8F5 |
Top |
Malignant transformation analysis |
| Identification of the aberrant gene expression in precancerous and cancerous lesions by comparing the gene expression of stem-like cells in diseased tissues with normal stem cells |
| Entrez ID | Symbol | Replicates | Species | Organ | Tissue | Adj P-value | Log2FC | Malignancy |
| 51162 | EGFL7 | P31T-E | Human | Esophagus | ESCC | 8.72e-12 | 2.84e-01 | 0.1251 |
| 51162 | EGFL7 | P32T-E | Human | Esophagus | ESCC | 3.43e-23 | 5.72e-01 | 0.1666 |
| 51162 | EGFL7 | P36T-E | Human | Esophagus | ESCC | 3.64e-04 | 3.97e-01 | 0.1187 |
| 51162 | EGFL7 | P37T-E | Human | Esophagus | ESCC | 4.60e-24 | 6.23e-01 | 0.1371 |
| 51162 | EGFL7 | P39T-E | Human | Esophagus | ESCC | 1.30e-07 | 2.41e-01 | 0.0894 |
| 51162 | EGFL7 | P40T-E | Human | Esophagus | ESCC | 7.79e-15 | 4.64e-01 | 0.109 |
| 51162 | EGFL7 | P42T-E | Human | Esophagus | ESCC | 1.47e-16 | 4.91e-01 | 0.1175 |
| 51162 | EGFL7 | P47T-E | Human | Esophagus | ESCC | 7.64e-12 | 3.86e-01 | 0.1067 |
| 51162 | EGFL7 | P48T-E | Human | Esophagus | ESCC | 3.18e-09 | 3.08e-01 | 0.0959 |
| 51162 | EGFL7 | P49T-E | Human | Esophagus | ESCC | 2.24e-15 | 1.12e+00 | 0.1768 |
| 51162 | EGFL7 | P52T-E | Human | Esophagus | ESCC | 1.88e-14 | 4.67e-01 | 0.1555 |
| 51162 | EGFL7 | P56T-E | Human | Esophagus | ESCC | 5.99e-07 | 1.00e+00 | 0.1613 |
| 51162 | EGFL7 | P57T-E | Human | Esophagus | ESCC | 8.46e-05 | 1.81e-01 | 0.0926 |
| 51162 | EGFL7 | P61T-E | Human | Esophagus | ESCC | 2.20e-05 | 2.23e-01 | 0.099 |
| 51162 | EGFL7 | P62T-E | Human | Esophagus | ESCC | 6.24e-03 | 1.51e-01 | 0.1302 |
| 51162 | EGFL7 | P65T-E | Human | Esophagus | ESCC | 2.61e-03 | 1.19e-01 | 0.0978 |
| 51162 | EGFL7 | P74T-E | Human | Esophagus | ESCC | 3.12e-45 | 1.14e+00 | 0.1479 |
| 51162 | EGFL7 | P76T-E | Human | Esophagus | ESCC | 4.14e-26 | 6.50e-01 | 0.1207 |
| 51162 | EGFL7 | P79T-E | Human | Esophagus | ESCC | 1.63e-20 | 4.67e-01 | 0.1154 |
| 51162 | EGFL7 | P80T-E | Human | Esophagus | ESCC | 3.61e-19 | 8.57e-01 | 0.155 |
| Page: 1 2 3 4 |
| Tissue | Expression Dynamics | Abbreviation |
| Esophagus | 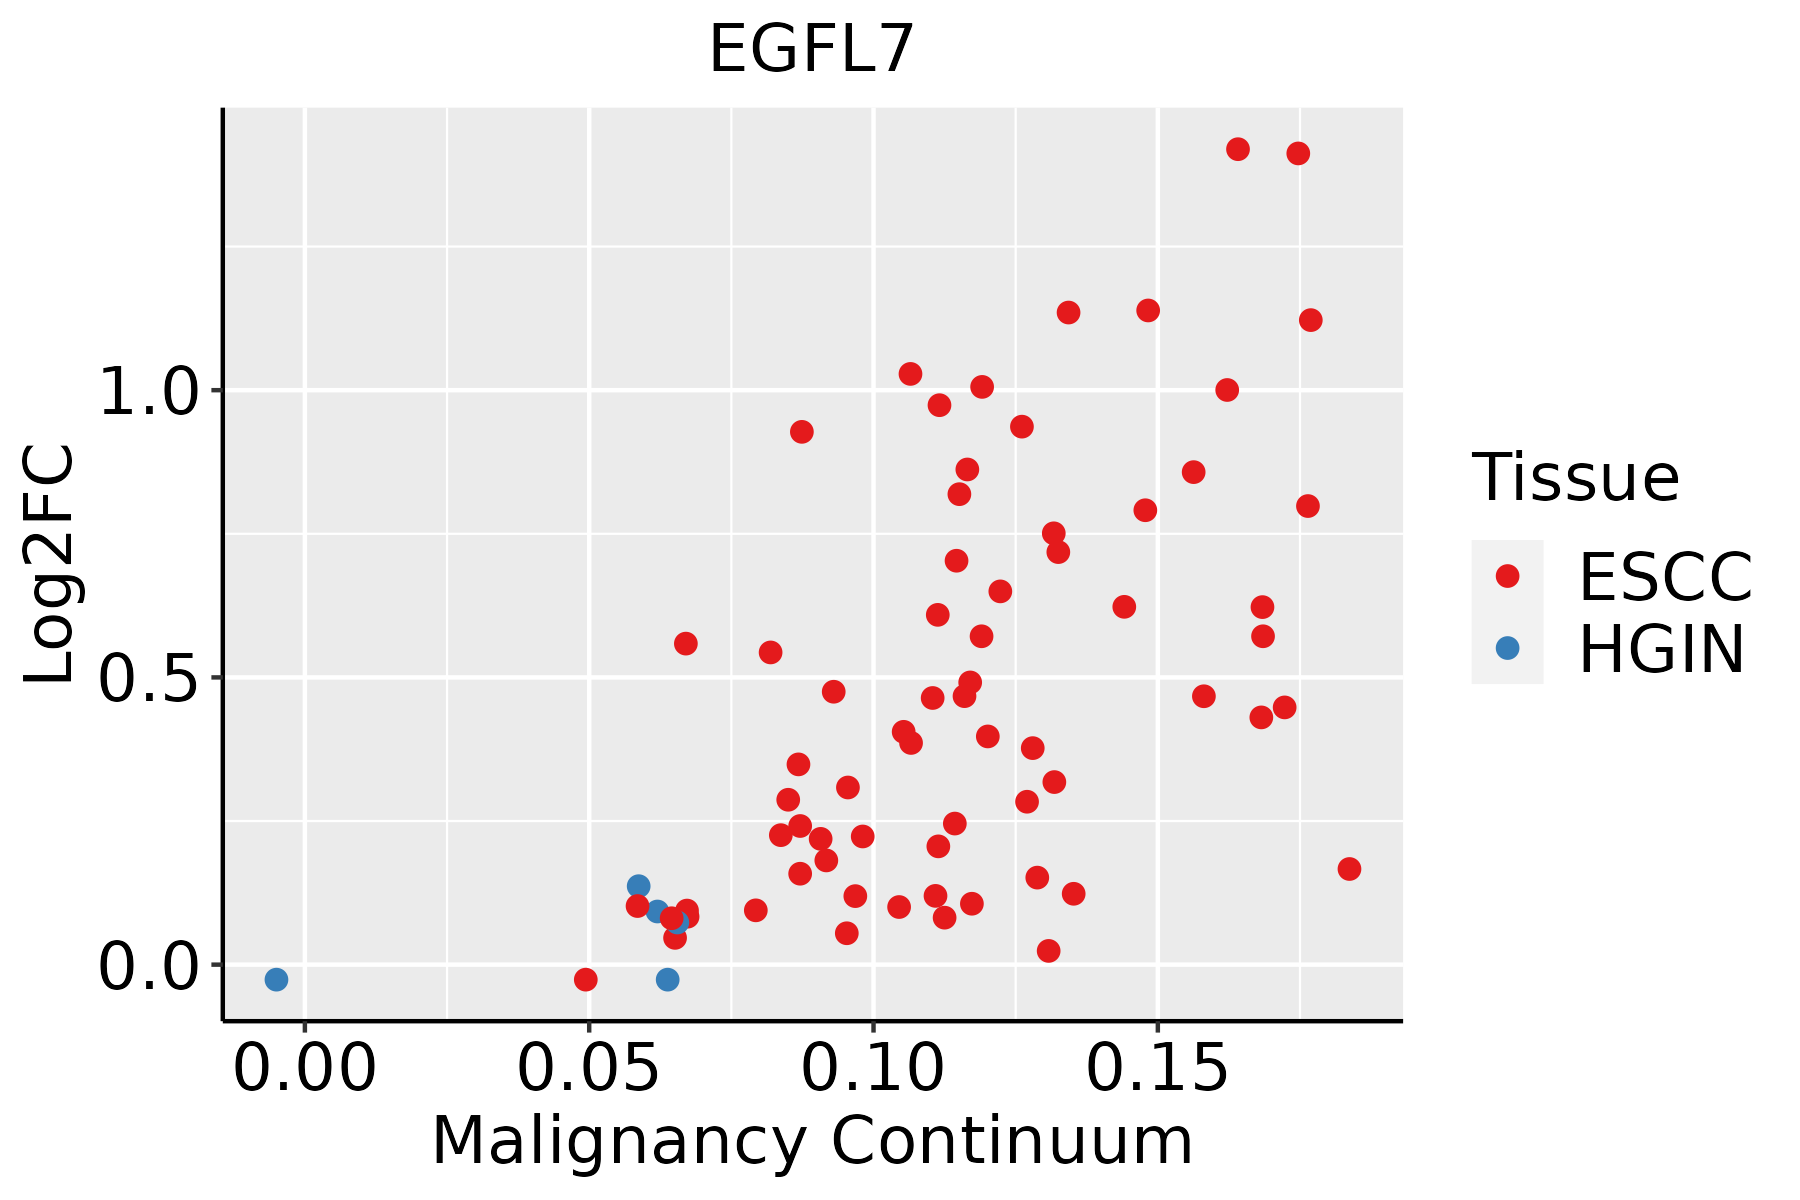 | ESCC: Esophageal squamous cell carcinoma |
| HGIN: High-grade intraepithelial neoplasias | ||
| LGIN: Low-grade intraepithelial neoplasias | ||
| Thyroid | 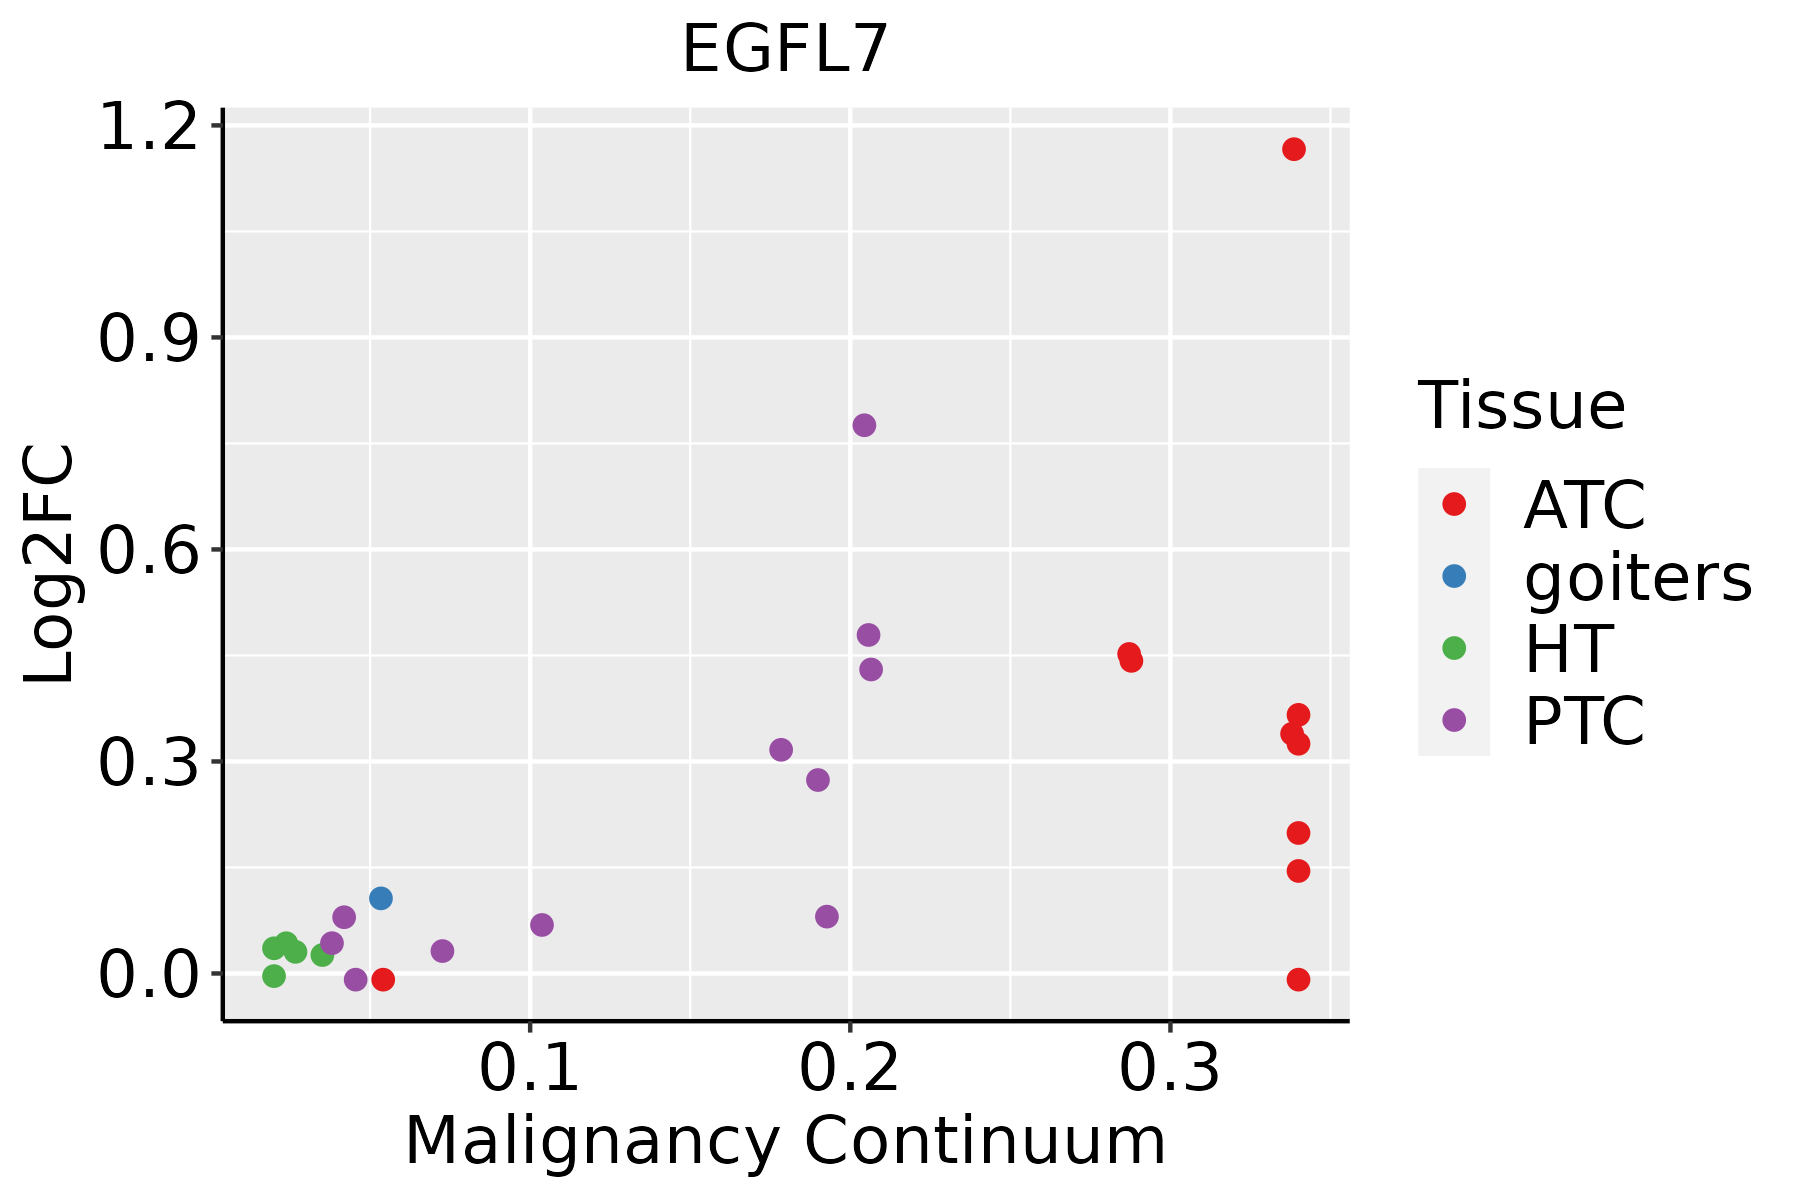 | ATC: Anaplastic thyroid cancer |
| HT: Hashimoto's thyroiditis | ||
| PTC: Papillary thyroid cancer |
| ∗log2FC in expression of this searched gene in stem-like cells from each diseased tissue sample relative to stem-like cells in normal samples in each tissue plotted against the malignancy continuum. Samples are colored based on if they are from different disease stage. |
Top |
Malignant transformation related pathway analysis |
| Find out the enriched GO biological processes and KEGG pathways involved in transition from healthy to precancer to cancer |
| Tissue | Disease Stage | Enriched GO biological Processes |
| Colorectum | AD |  |
| Colorectum | SER |  |
| Colorectum | MSS |  |
| Colorectum | MSI-H |  |
| Colorectum | FAP |  |
| ∗Top 15 enriched GO BP terms are showed in the bar plot of each disease state in each tissue. Each row represents a significant GO biological process which is colored according to the -log10(p.adjust). |
| Page: 1 2 3 4 5 6 7 8 9 |
| GO ID | Tissue | Disease Stage | Description | Gene Ratio | Bg Ratio | pvalue | p.adjust | Count |
| GO:00072197 | Esophagus | ESCC | Notch signaling pathway | 106/8552 | 172/18723 | 1.74e-05 | 1.55e-04 | 106 |
| GO:0045746 | Esophagus | ESCC | negative regulation of Notch signaling pathway | 28/8552 | 36/18723 | 8.62e-05 | 6.22e-04 | 28 |
| GO:005067318 | Esophagus | ESCC | epithelial cell proliferation | 238/8552 | 437/18723 | 1.19e-04 | 8.20e-04 | 238 |
| GO:005067817 | Esophagus | ESCC | regulation of epithelial cell proliferation | 206/8552 | 381/18723 | 5.51e-04 | 3.02e-03 | 206 |
| GO:00085935 | Esophagus | ESCC | regulation of Notch signaling pathway | 59/8552 | 95/18723 | 9.12e-04 | 4.65e-03 | 59 |
| GO:00072199 | Thyroid | PTC | Notch signaling pathway | 70/5968 | 172/18723 | 8.82e-03 | 3.67e-02 | 70 |
| GO:000157011 | Thyroid | PTC | vasculogenesis | 36/5968 | 80/18723 | 9.35e-03 | 3.85e-02 | 36 |
| GO:000721915 | Thyroid | ATC | Notch signaling pathway | 79/6293 | 172/18723 | 5.08e-04 | 2.96e-03 | 79 |
| GO:0050673111 | Thyroid | ATC | epithelial cell proliferation | 174/6293 | 437/18723 | 3.49e-03 | 1.55e-02 | 174 |
| GO:0050678110 | Thyroid | ATC | regulation of epithelial cell proliferation | 151/6293 | 381/18723 | 7.47e-03 | 2.92e-02 | 151 |
| GO:00085937 | Thyroid | ATC | regulation of Notch signaling pathway | 43/6293 | 95/18723 | 1.19e-02 | 4.22e-02 | 43 |
| GO:000157021 | Thyroid | ATC | vasculogenesis | 37/6293 | 80/18723 | 1.26e-02 | 4.42e-02 | 37 |
| Page: 1 |
| Pathway ID | Tissue | Disease Stage | Description | Gene Ratio | Bg Ratio | pvalue | p.adjust | qvalue | Count |
| Page: 1 |
Top |
Cell-cell communication analysis |
| Identification of potential cell-cell interactions between two cell types and their ligand-receptor pairs for different disease states |
| Ligand | Receptor | LRpair | Pathway | Tissue | Disease Stage |
| Page: 1 |
Top |
Single-cell gene regulatory network inference analysis |
| Find out the significant the regulons (TFs) and the target genes of each regulon across cell types for different disease states |
| TF | Cell Type | Tissue | Disease Stage | Target Gene | RSS | Regulon Activity |
| ∗The dot plots of a searched regulon are shown for all cell subpopulations in each disease state of each tissue based on the regulon specific score inferred using pySCENIC and by calculating the average expression. |
| Page: 1 |
Top |
Somatic mutation of malignant transformation related genes |
| Annotation of somatic variants for genes involved in malignant transformation |
| Hugo Symbol | Variant Class | Variant Classification | dbSNP RS | HGVSc | HGVSp | HGVSp Short | SWISSPROT | BIOTYPE | SIFT | PolyPhen | Tumor Sample Barcode | Tissue | Histology | Sex | Age | Stage | Therapy Types | Drugs | Outcome |
| EGFL7 | SNV | Missense_Mutation | c.781N>C | p.Glu261Gln | p.E261Q | Q9UHF1 | protein_coding | deleterious(0) | probably_damaging(0.996) | TCGA-AR-A24L-01 | Breast | breast invasive carcinoma | Female | <65 | I/II | Hormone Therapy | tamoxiphen | PD | |
| EGFL7 | SNV | Missense_Mutation | c.784N>A | p.Glu262Lys | p.E262K | Q9UHF1 | protein_coding | deleterious(0) | probably_damaging(0.994) | TCGA-BH-A0WA-01 | Breast | breast invasive carcinoma | Female | >=65 | I/II | Unknown | Unknown | SD | |
| EGFL7 | insertion | Frame_Shift_Ins | novel | c.138_139insCGTGTGTACCAGC | p.Phe52CysfsTer23 | p.F52Cfs*23 | Q9UHF1 | protein_coding | TCGA-AC-A2QJ-01 | Breast | breast invasive carcinoma | Female | <65 | III/IV | Chemotherapy | cytoxan | PD | ||
| EGFL7 | insertion | Frame_Shift_Ins | rs878890965 | c.549dupC | p.Arg184GlnfsTer100 | p.R184Qfs*100 | Q9UHF1 | protein_coding | TCGA-AO-A128-01 | Breast | breast invasive carcinoma | Female | <65 | I/II | Chemotherapy | doxorubicin | SD | ||
| EGFL7 | SNV | Missense_Mutation | c.253N>T | p.Arg85Cys | p.R85C | Q9UHF1 | protein_coding | tolerated(0.18) | possibly_damaging(0.761) | TCGA-EK-A3GN-01 | Cervix | cervical & endocervical cancer | Female | <65 | III/IV | Unknown | Unknown | SD | |
| EGFL7 | insertion | Frame_Shift_Ins | novel | c.503_504insGACCCTT | p.Ser168ArgfsTer118 | p.S168Rfs*118 | Q9UHF1 | protein_coding | TCGA-DS-A1OB-01 | Cervix | cervical & endocervical cancer | Female | <65 | I/II | Chemotherapy | carboplatin | PD | ||
| EGFL7 | SNV | Missense_Mutation | novel | c.470G>A | p.Gly157Asp | p.G157D | Q9UHF1 | protein_coding | deleterious(0.02) | probably_damaging(1) | TCGA-AA-3984-01 | Colorectum | colon adenocarcinoma | Female | <65 | I/II | Unknown | Unknown | SD |
| EGFL7 | deletion | Frame_Shift_Del | c.541delN | p.Arg184GlyfsTer13 | p.R184Gfs*13 | Q9UHF1 | protein_coding | TCGA-A6-3809-01 | Colorectum | colon adenocarcinoma | Female | >=65 | I/II | Unknown | Unknown | SD | |||
| EGFL7 | SNV | Missense_Mutation | novel | c.15N>T | p.Gln5His | p.Q5H | Q9UHF1 | protein_coding | tolerated_low_confidence(0.21) | benign(0.096) | TCGA-B5-A1MX-01 | Endometrium | uterine corpus endometrioid carcinoma | Female | <65 | I/II | Hormone Therapy | megace | SD |
| EGFL7 | SNV | Missense_Mutation | novel | c.282N>T | p.Arg94Ser | p.R94S | Q9UHF1 | protein_coding | deleterious(0) | possibly_damaging(0.812) | TCGA-D1-A3DG-01 | Endometrium | uterine corpus endometrioid carcinoma | Female | >=65 | III/IV | Unknown | Unknown | SD |
| Page: 1 2 |
Top |
Related drugs of malignant transformation related genes |
| Identification of chemicals and drugs interact with genes involved in malignant transfromation |
| (DGIdb 4.0) |
| Entrez ID | Symbol | Category | Interaction Types | Drug Claim Name | Drug Name | PMIDs |
| 51162 | EGFL7 | DRUGGABLE GENOME, CLINICALLY ACTIONABLE, CELL SURFACE | MEGF0444A | PARSATUZUMAB | ||
| 51162 | EGFL7 | DRUGGABLE GENOME, CLINICALLY ACTIONABLE, CELL SURFACE | ANTI-EGFL7 | |||
| 51162 | EGFL7 | DRUGGABLE GENOME, CLINICALLY ACTIONABLE, CELL SURFACE | inhibitor | CHEMBL2109387 | PARSATUZUMAB | |
| 51162 | EGFL7 | DRUGGABLE GENOME, CLINICALLY ACTIONABLE, CELL SURFACE | Anti-EGFL7 | |||
| 51162 | EGFL7 | DRUGGABLE GENOME, CLINICALLY ACTIONABLE, CELL SURFACE | antibody | MEGF0444A | PARSATUZUMAB |
| Page: 1 |

Copyright 2023-Present -The University of Texas Health Science Center at Houston |