
|
|||||
|
 | |
| |
| |
| |
| |
| |
|
Gene: EEF2KMT |
Gene summary for EEF2KMT |
| Gene information | Species | Human | Gene symbol | EEF2KMT | Gene ID | 196483 |
| Gene name | eukaryotic elongation factor 2 lysine methyltransferase | |
| Gene Alias | EFM3 | |
| Cytomap | 16p13.3 | |
| Gene Type | protein-coding | GO ID | GO:0006464 | UniProtAcc | K7ES84 |
Top |
Malignant transformation analysis |
| Identification of the aberrant gene expression in precancerous and cancerous lesions by comparing the gene expression of stem-like cells in diseased tissues with normal stem cells |
| Entrez ID | Symbol | Replicates | Species | Organ | Tissue | Adj P-value | Log2FC | Malignancy |
| 196483 | EEF2KMT | P27T-E | Human | Esophagus | ESCC | 8.47e-14 | 1.99e-01 | 0.1055 |
| 196483 | EEF2KMT | P28T-E | Human | Esophagus | ESCC | 4.01e-19 | 3.34e-01 | 0.1149 |
| 196483 | EEF2KMT | P30T-E | Human | Esophagus | ESCC | 1.48e-15 | 5.62e-01 | 0.137 |
| 196483 | EEF2KMT | P31T-E | Human | Esophagus | ESCC | 4.36e-16 | 2.89e-01 | 0.1251 |
| 196483 | EEF2KMT | P32T-E | Human | Esophagus | ESCC | 1.48e-35 | 6.54e-01 | 0.1666 |
| 196483 | EEF2KMT | P36T-E | Human | Esophagus | ESCC | 2.82e-07 | 2.58e-01 | 0.1187 |
| 196483 | EEF2KMT | P37T-E | Human | Esophagus | ESCC | 1.91e-08 | 2.59e-01 | 0.1371 |
| 196483 | EEF2KMT | P39T-E | Human | Esophagus | ESCC | 6.29e-04 | 1.15e-01 | 0.0894 |
| 196483 | EEF2KMT | P40T-E | Human | Esophagus | ESCC | 2.31e-04 | 1.75e-01 | 0.109 |
| 196483 | EEF2KMT | P42T-E | Human | Esophagus | ESCC | 1.88e-04 | 1.95e-01 | 0.1175 |
| 196483 | EEF2KMT | P47T-E | Human | Esophagus | ESCC | 2.40e-05 | 1.35e-01 | 0.1067 |
| 196483 | EEF2KMT | P48T-E | Human | Esophagus | ESCC | 8.83e-05 | 1.00e-01 | 0.0959 |
| 196483 | EEF2KMT | P49T-E | Human | Esophagus | ESCC | 1.51e-09 | 8.92e-01 | 0.1768 |
| 196483 | EEF2KMT | P52T-E | Human | Esophagus | ESCC | 1.61e-27 | 5.29e-01 | 0.1555 |
| 196483 | EEF2KMT | P54T-E | Human | Esophagus | ESCC | 1.37e-09 | 2.98e-01 | 0.0975 |
| 196483 | EEF2KMT | P56T-E | Human | Esophagus | ESCC | 9.45e-06 | 7.30e-01 | 0.1613 |
| 196483 | EEF2KMT | P57T-E | Human | Esophagus | ESCC | 1.42e-05 | 1.60e-01 | 0.0926 |
| 196483 | EEF2KMT | P61T-E | Human | Esophagus | ESCC | 2.88e-10 | 3.10e-01 | 0.099 |
| 196483 | EEF2KMT | P62T-E | Human | Esophagus | ESCC | 2.93e-32 | 6.17e-01 | 0.1302 |
| 196483 | EEF2KMT | P65T-E | Human | Esophagus | ESCC | 7.27e-07 | 2.11e-01 | 0.0978 |
| Page: 1 2 3 4 |
| Tissue | Expression Dynamics | Abbreviation |
| Esophagus | 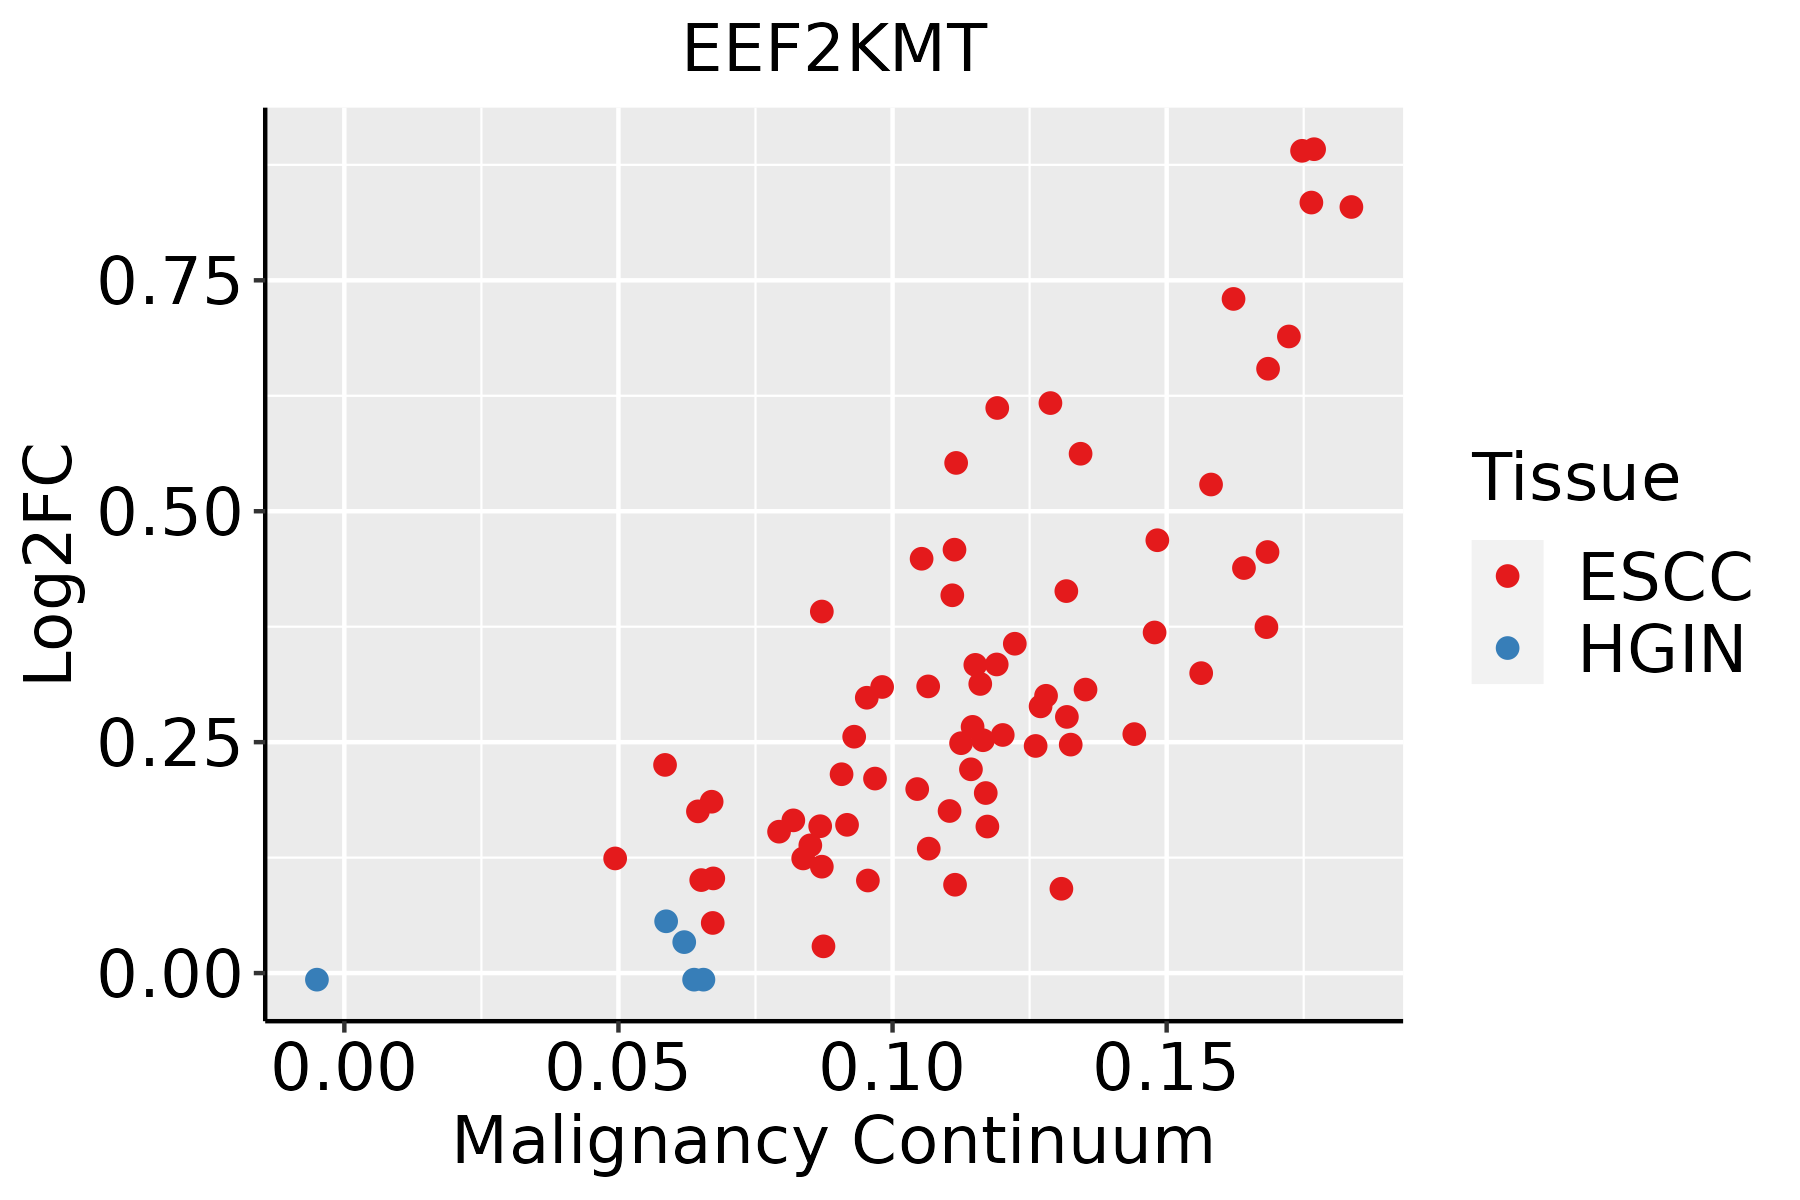 | ESCC: Esophageal squamous cell carcinoma |
| HGIN: High-grade intraepithelial neoplasias | ||
| LGIN: Low-grade intraepithelial neoplasias | ||
| Liver | 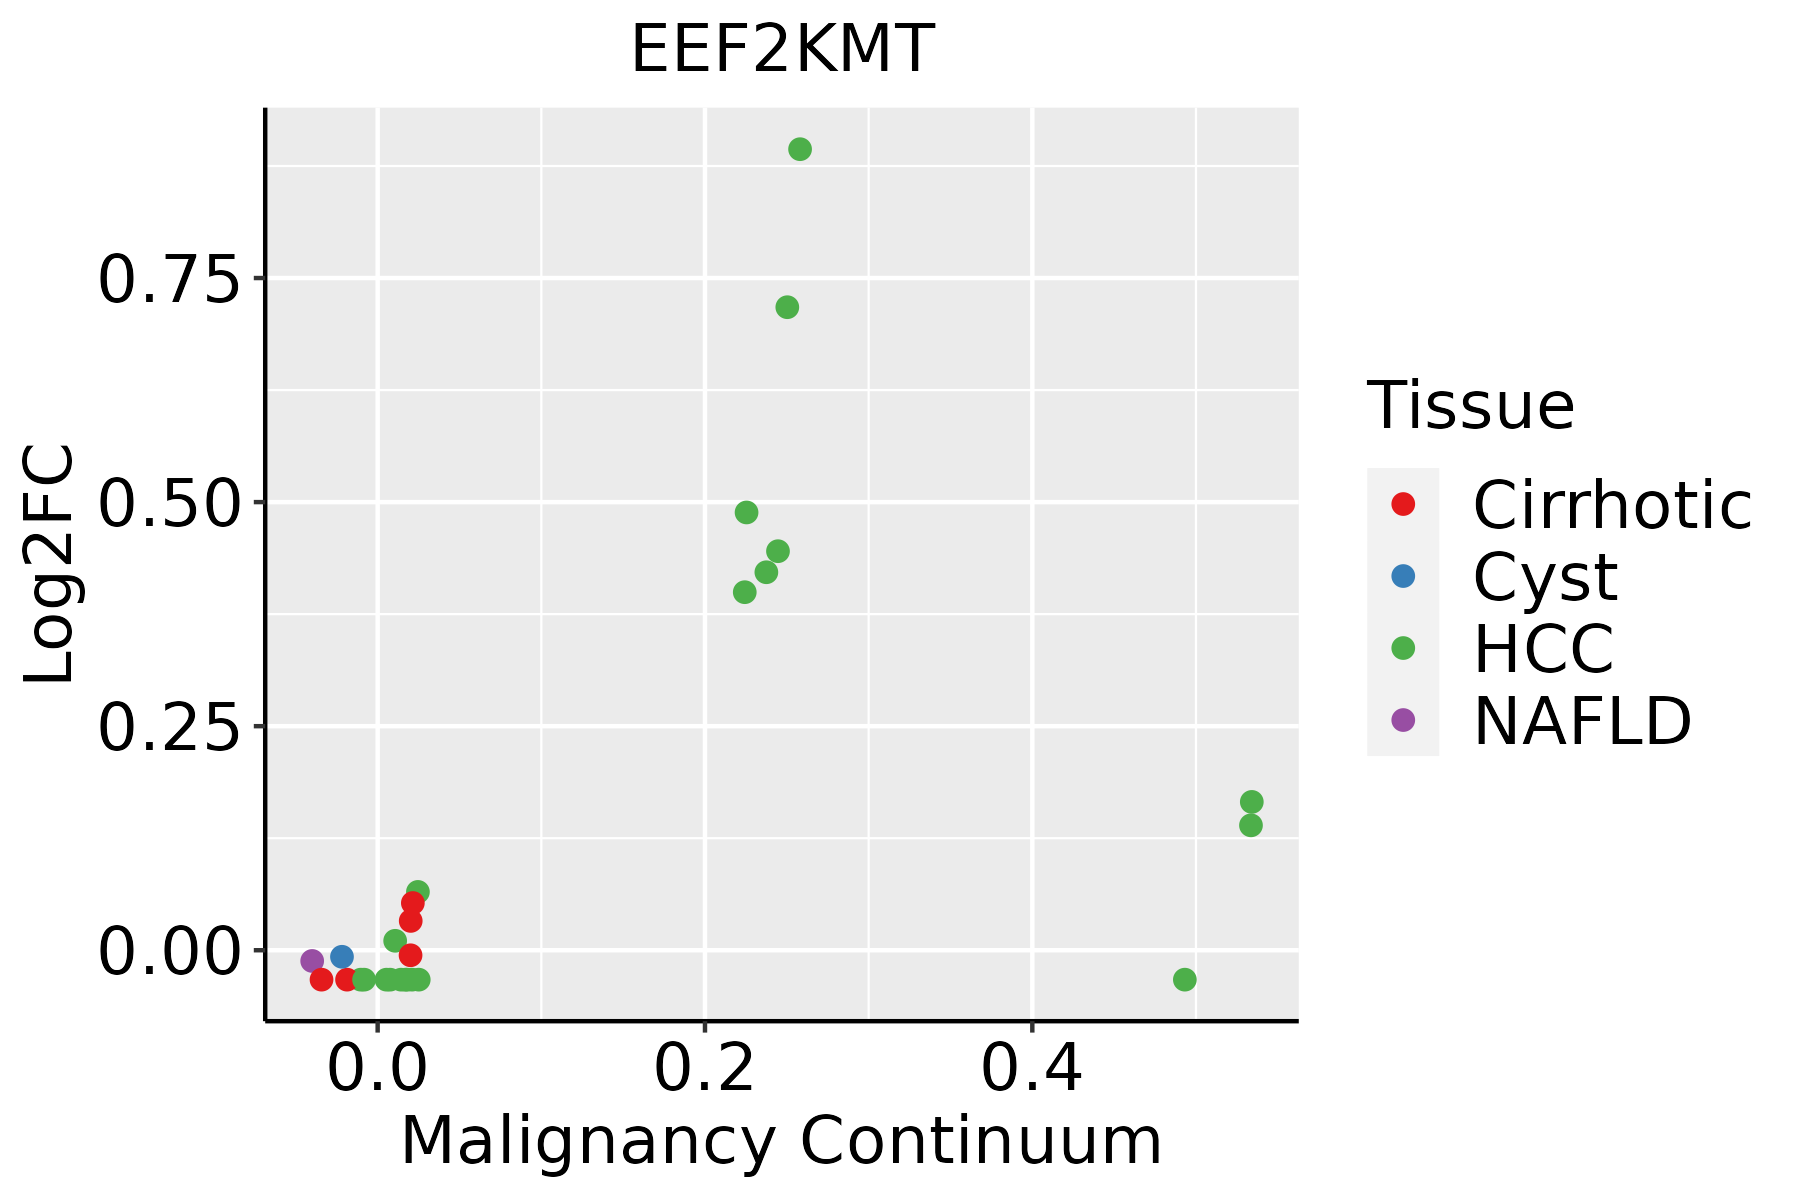 | HCC: Hepatocellular carcinoma |
| NAFLD: Non-alcoholic fatty liver disease | ||
| Oral Cavity | 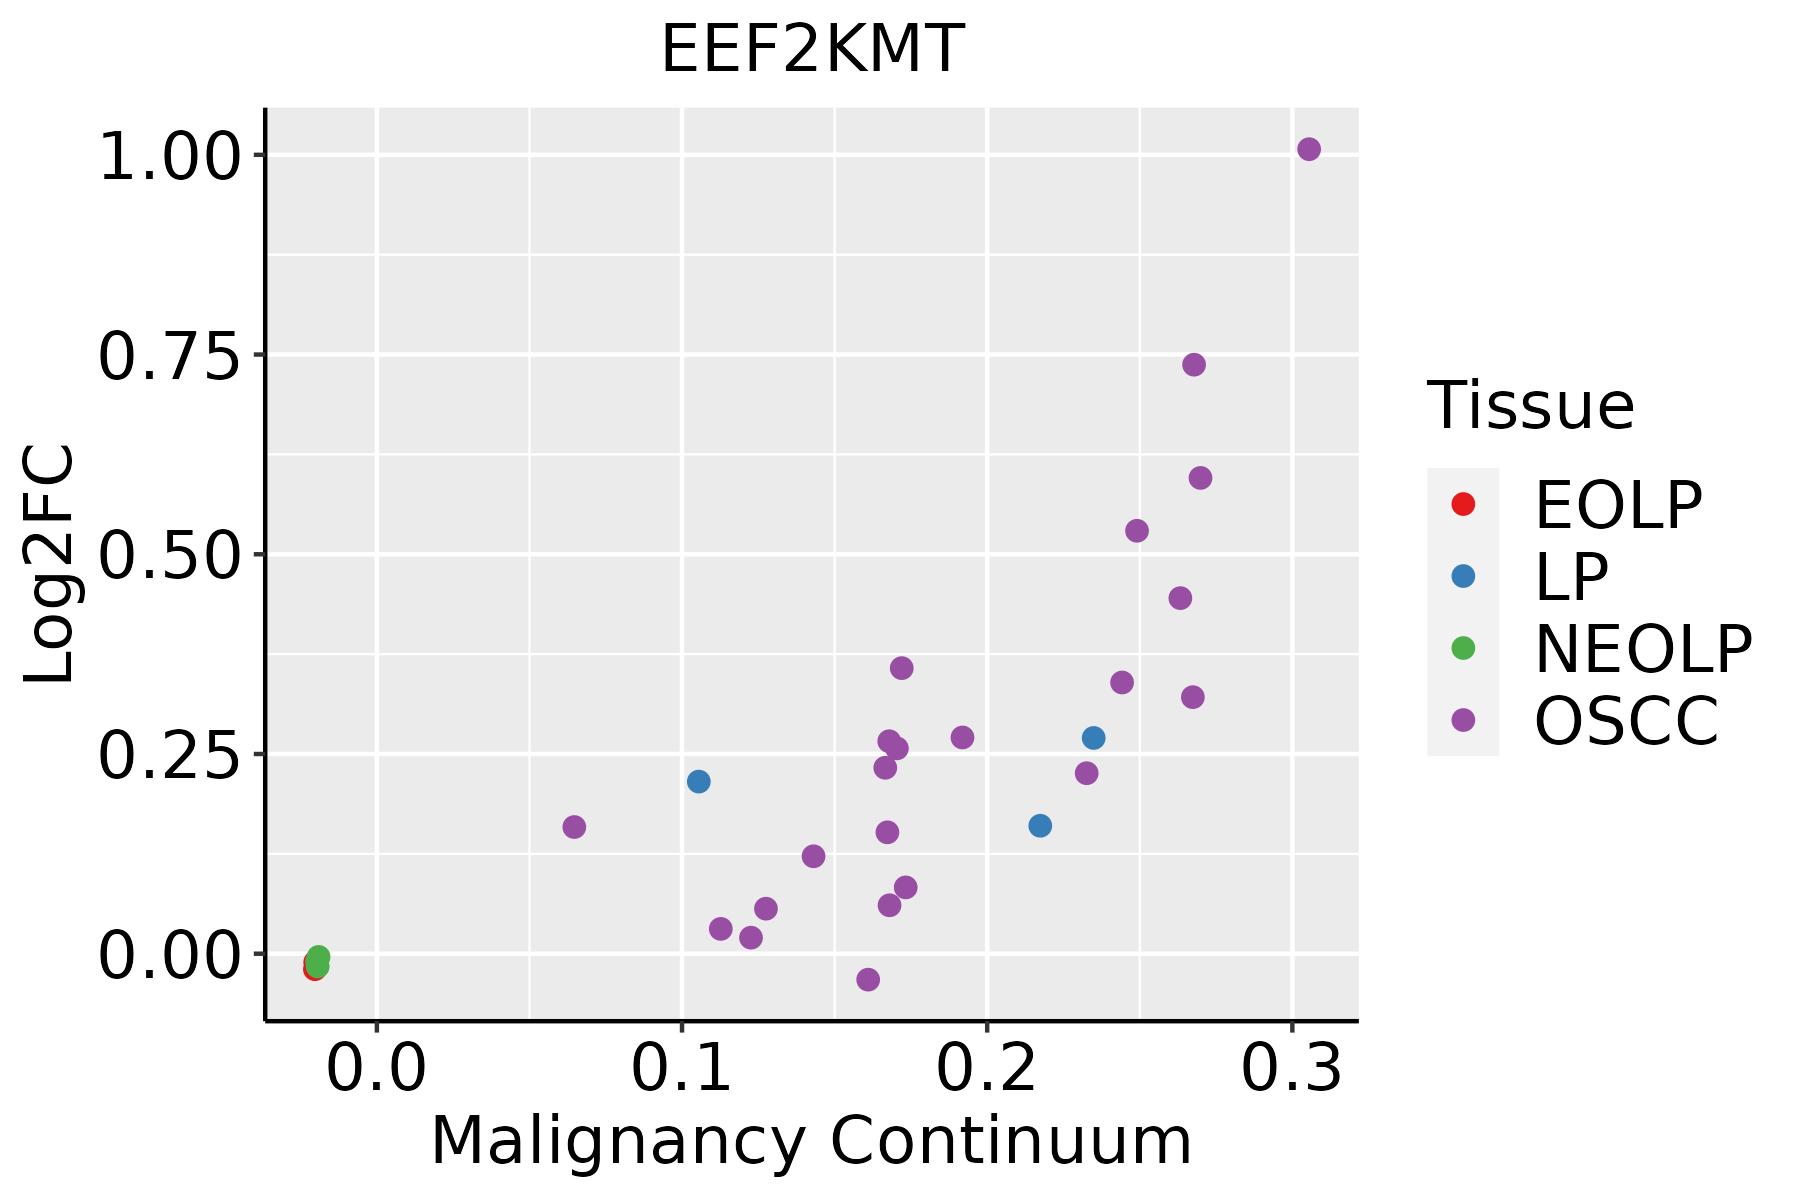 | EOLP: Erosive Oral lichen planus |
| LP: leukoplakia | ||
| NEOLP: Non-erosive oral lichen planus | ||
| OSCC: Oral squamous cell carcinoma |
| ∗log2FC in expression of this searched gene in stem-like cells from each diseased tissue sample relative to stem-like cells in normal samples in each tissue plotted against the malignancy continuum. Samples are colored based on if they are from different disease stage. |
Top |
Malignant transformation related pathway analysis |
| Find out the enriched GO biological processes and KEGG pathways involved in transition from healthy to precancer to cancer |
| Tissue | Disease Stage | Enriched GO biological Processes |
| Colorectum | AD |  |
| Colorectum | SER |  |
| Colorectum | MSS |  |
| Colorectum | MSI-H |  |
| Colorectum | FAP |  |
| ∗Top 15 enriched GO BP terms are showed in the bar plot of each disease state in each tissue. Each row represents a significant GO biological process which is colored according to the -log10(p.adjust). |
| Page: 1 2 3 4 5 6 7 8 9 |
| GO ID | Tissue | Disease Stage | Description | Gene Ratio | Bg Ratio | pvalue | p.adjust | Count |
| GO:001820514 | Esophagus | ESCC | peptidyl-lysine modification | 259/8552 | 376/18723 | 3.90e-20 | 5.26e-18 | 259 |
| GO:00434143 | Esophagus | ESCC | macromolecule methylation | 199/8552 | 316/18723 | 3.44e-10 | 9.57e-09 | 199 |
| GO:00322592 | Esophagus | ESCC | methylation | 222/8552 | 364/18723 | 2.26e-09 | 5.09e-08 | 222 |
| GO:000647914 | Esophagus | ESCC | protein methylation | 115/8552 | 181/18723 | 9.07e-07 | 1.16e-05 | 115 |
| GO:000821314 | Esophagus | ESCC | protein alkylation | 115/8552 | 181/18723 | 9.07e-07 | 1.16e-05 | 115 |
| GO:001802214 | Esophagus | ESCC | peptidyl-lysine methylation | 79/8552 | 131/18723 | 5.17e-04 | 2.86e-03 | 79 |
| GO:00180231 | Esophagus | ESCC | peptidyl-lysine trimethylation | 31/8552 | 50/18723 | 1.48e-02 | 4.79e-02 | 31 |
| GO:00182052 | Liver | HCC | peptidyl-lysine modification | 230/7958 | 376/18723 | 1.51e-13 | 8.32e-12 | 230 |
| GO:00434141 | Liver | HCC | macromolecule methylation | 183/7958 | 316/18723 | 2.00e-08 | 4.72e-07 | 183 |
| GO:0032259 | Liver | HCC | methylation | 206/7958 | 364/18723 | 3.35e-08 | 7.53e-07 | 206 |
| GO:00064792 | Liver | HCC | protein methylation | 111/7958 | 181/18723 | 2.36e-07 | 4.18e-06 | 111 |
| GO:00082132 | Liver | HCC | protein alkylation | 111/7958 | 181/18723 | 2.36e-07 | 4.18e-06 | 111 |
| GO:00180221 | Liver | HCC | peptidyl-lysine methylation | 74/7958 | 131/18723 | 8.46e-04 | 5.06e-03 | 74 |
| GO:00182056 | Oral cavity | OSCC | peptidyl-lysine modification | 216/7305 | 376/18723 | 2.32e-13 | 1.16e-11 | 216 |
| GO:00064797 | Oral cavity | OSCC | protein methylation | 92/7305 | 181/18723 | 7.86e-04 | 4.26e-03 | 92 |
| GO:00082137 | Oral cavity | OSCC | protein alkylation | 92/7305 | 181/18723 | 7.86e-04 | 4.26e-03 | 92 |
| GO:00434142 | Oral cavity | OSCC | macromolecule methylation | 149/7305 | 316/18723 | 1.82e-03 | 8.60e-03 | 149 |
| GO:00322591 | Oral cavity | OSCC | methylation | 168/7305 | 364/18723 | 3.03e-03 | 1.31e-02 | 168 |
| GO:001820513 | Oral cavity | LP | peptidyl-lysine modification | 136/4623 | 376/18723 | 3.64e-07 | 1.06e-05 | 136 |
| Page: 1 |
| Pathway ID | Tissue | Disease Stage | Description | Gene Ratio | Bg Ratio | pvalue | p.adjust | qvalue | Count |
| Page: 1 |
Top |
Cell-cell communication analysis |
| Identification of potential cell-cell interactions between two cell types and their ligand-receptor pairs for different disease states |
| Ligand | Receptor | LRpair | Pathway | Tissue | Disease Stage |
| Page: 1 |
Top |
Single-cell gene regulatory network inference analysis |
| Find out the significant the regulons (TFs) and the target genes of each regulon across cell types for different disease states |
| TF | Cell Type | Tissue | Disease Stage | Target Gene | RSS | Regulon Activity |
| ∗The dot plots of a searched regulon are shown for all cell subpopulations in each disease state of each tissue based on the regulon specific score inferred using pySCENIC and by calculating the average expression. |
| Page: 1 |
Top |
Somatic mutation of malignant transformation related genes |
| Annotation of somatic variants for genes involved in malignant transformation |
| Hugo Symbol | Variant Class | Variant Classification | dbSNP RS | HGVSc | HGVSp | HGVSp Short | SWISSPROT | BIOTYPE | SIFT | PolyPhen | Tumor Sample Barcode | Tissue | Histology | Sex | Age | Stage | Therapy Types | Drugs | Outcome |
| EEF2KMT | SNV | Missense_Mutation | c.116G>C | p.Arg39Thr | p.R39T | Q96G04 | protein_coding | deleterious(0) | benign(0.258) | TCGA-D8-A1JA-01 | Breast | breast invasive carcinoma | Female | <65 | III/IV | Chemotherapy | adriamycin | PD | |
| EEF2KMT | SNV | Missense_Mutation | novel | c.527N>A | p.Cys176Tyr | p.C176Y | Q96G04 | protein_coding | deleterious(0.01) | benign(0.078) | TCGA-EA-A3HS-01 | Cervix | cervical & endocervical cancer | Female | <65 | I/II | Unknown | Unknown | SD |
| EEF2KMT | SNV | Missense_Mutation | rs553273623 | c.593N>A | p.Arg198Gln | p.R198Q | Q96G04 | protein_coding | tolerated(0.34) | benign(0.037) | TCGA-VS-A9V3-01 | Cervix | cervical & endocervical cancer | Female | <65 | I/II | Chemotherapy | cisplatin | PD |
| EEF2KMT | SNV | Missense_Mutation | c.103G>C | p.Glu35Gln | p.E35Q | Q96G04 | protein_coding | tolerated(0.08) | benign(0.125) | TCGA-AA-3697-01 | Colorectum | colon adenocarcinoma | Male | >=65 | I/II | Unknown | Unknown | SD | |
| EEF2KMT | SNV | Missense_Mutation | rs760548419 | c.142N>T | p.Arg48Trp | p.R48W | Q96G04 | protein_coding | tolerated(0.12) | benign(0.003) | TCGA-AA-A010-01 | Colorectum | colon adenocarcinoma | Female | <65 | I/II | Chemotherapy | folinic | CR |
| EEF2KMT | SNV | Missense_Mutation | c.943T>A | p.Phe315Ile | p.F315I | Q96G04 | protein_coding | deleterious(0) | probably_damaging(1) | TCGA-CA-6717-01 | Colorectum | colon adenocarcinoma | Male | <65 | I/II | Chemotherapy | oxaliplatin | CR | |
| EEF2KMT | SNV | Missense_Mutation | c.446N>T | p.Ala149Val | p.A149V | Q96G04 | protein_coding | deleterious(0.02) | benign(0.019) | TCGA-QG-A5Z2-01 | Colorectum | colon adenocarcinoma | Male | <65 | I/II | Unknown | Unknown | SD | |
| EEF2KMT | SNV | Missense_Mutation | rs147889190 | c.290N>T | p.Ala97Val | p.A97V | Q96G04 | protein_coding | deleterious(0.03) | benign(0.024) | TCGA-A5-A0G1-01 | Endometrium | uterine corpus endometrioid carcinoma | Female | >=65 | I/II | Unknown | Unknown | SD |
| EEF2KMT | SNV | Missense_Mutation | novel | c.971N>T | p.Ala324Val | p.A324V | Q96G04 | protein_coding | tolerated(0.28) | benign(0) | TCGA-AJ-A3OK-01 | Endometrium | uterine corpus endometrioid carcinoma | Female | >=65 | I/II | Chemotherapy | carboplatin | CR |
| EEF2KMT | SNV | Missense_Mutation | rs760548419 | c.142N>T | p.Arg48Trp | p.R48W | Q96G04 | protein_coding | tolerated(0.12) | benign(0.003) | TCGA-AP-A0LM-01 | Endometrium | uterine corpus endometrioid carcinoma | Female | <65 | III/IV | Chemotherapy | cisplatin | SD |
| Page: 1 2 3 |
Top |
Related drugs of malignant transformation related genes |
| Identification of chemicals and drugs interact with genes involved in malignant transfromation |
| (DGIdb 4.0) |
| Entrez ID | Symbol | Category | Interaction Types | Drug Claim Name | Drug Name | PMIDs |
| Page: 1 |

Copyright 2023-Present -The University of Texas Health Science Center at Houston |