Schematic overview of the cellular and molecular mechanisms involved in the cancer progression, including the proposed cellular and molecular mechanisms in cancer cells trajectory. AT1: alveolar type 1 cells; AT2: alveolar type 2 cells; AAH: atypical adenomatous hyperplasia; AIS: adenocarcinoma in situ; MIA: minimally invasive adenocarcinoma; IA: invasive adenocarcinoma; EMT: epithelial-mesenchymal transition

Home

Download

Statistics

Help

Contact

Center for Computational Systems Medicine
leaf

Gene summary

leaf

Malignant transformation analysis

leaf

Malignant transformation related pathway analysis

leaf

Cell-cell communication analysis

leaf

Single-cell gene regulatory network inference analysis

leaf

Somatic mutation of malignant transformation related genes

leaf

Related drugs of malignant transformation related genes

Gene: DRG2

Gene summary for DRG2

check button Gene summary.

Gene informationSpeciesHuman
Gene symbol

DRG2

Gene ID

1819

Gene namedevelopmentally regulated GTP binding protein 2
Gene AliasDRG2
Cytomap17p11.2
Gene Typeprotein-coding
GO ID

GO:0002181

UniProtAcc

A8MZF9


Top

Malignant transformation analysis

check button Identification of the aberrant gene expression in precancerous and cancerous lesions by comparing the gene expression of stem-like cells in diseased tissues with normal stem cells
check button Malignant transformation involving gene list.
Entrez IDSymbolReplicatesSpeciesOrganTissueAdj P-valueLog2FCMalignancy
1819DRG2P16T-EHumanEsophagusESCC7.42e-355.12e-010.1153
1819DRG2P17T-EHumanEsophagusESCC1.02e-153.93e-010.1278
1819DRG2P19T-EHumanEsophagusESCC7.18e-148.70e-010.1662
1819DRG2P20T-EHumanEsophagusESCC9.42e-265.02e-010.1124
1819DRG2P21T-EHumanEsophagusESCC4.19e-417.61e-010.1617
1819DRG2P22T-EHumanEsophagusESCC1.89e-356.20e-010.1236
1819DRG2P23T-EHumanEsophagusESCC8.89e-326.39e-010.108
1819DRG2P24T-EHumanEsophagusESCC3.44e-326.18e-010.1287
1819DRG2P26T-EHumanEsophagusESCC7.73e-274.71e-010.1276
1819DRG2P27T-EHumanEsophagusESCC3.62e-324.92e-010.1055
1819DRG2P28T-EHumanEsophagusESCC1.52e-203.05e-010.1149
1819DRG2P30T-EHumanEsophagusESCC3.62e-216.59e-010.137
1819DRG2P31T-EHumanEsophagusESCC2.85e-305.85e-010.1251
1819DRG2P32T-EHumanEsophagusESCC8.89e-661.36e+000.1666
1819DRG2P36T-EHumanEsophagusESCC5.44e-194.55e-010.1187
1819DRG2P37T-EHumanEsophagusESCC5.12e-346.28e-010.1371
1819DRG2P38T-EHumanEsophagusESCC5.79e-124.84e-010.127
1819DRG2P39T-EHumanEsophagusESCC1.34e-193.34e-010.0894
1819DRG2P40T-EHumanEsophagusESCC1.28e-133.04e-010.109
1819DRG2P42T-EHumanEsophagusESCC2.89e-285.57e-010.1175
Page: 1 2 3 4 5 

check button Transcriptomic changes along malignancy continuum.
TissueExpression DynamicsAbbreviation
EsophagusThe image shows the transcriptomic changes along malignancy continuum.log2FC in expression of this searched gene in stem-like cells from each diseased tissue sample relative to stem-like cells in normal samples in each tissue plotted against the malignancy continuum. Samples are colored based on if they are from different disease stage.
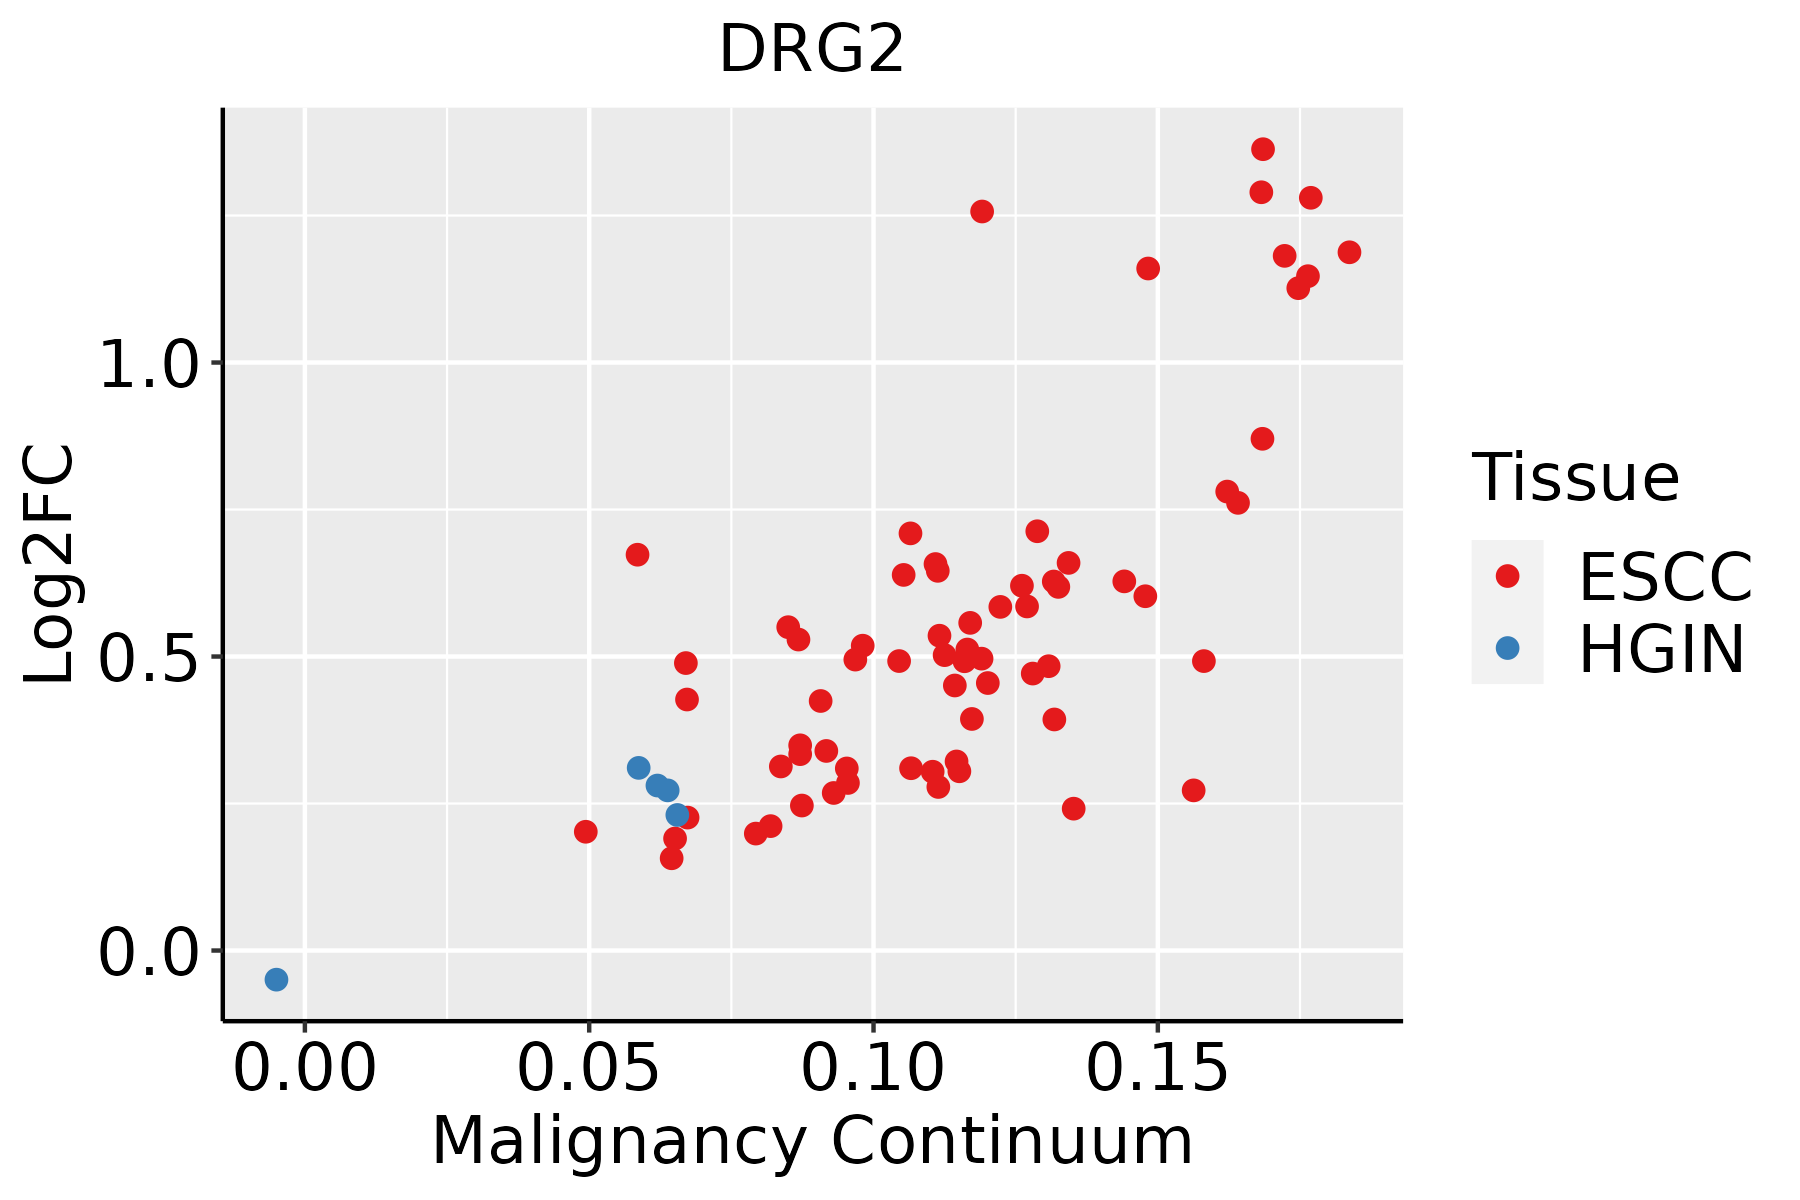
ESCC: Esophageal squamous cell carcinoma
HGIN: High-grade intraepithelial neoplasias
LGIN: Low-grade intraepithelial neoplasias
LiverThe image shows the transcriptomic changes along malignancy continuum.log2FC in expression of this searched gene in stem-like cells from each diseased tissue sample relative to stem-like cells in normal samples in each tissue plotted against the malignancy continuum. Samples are colored based on if they are from different disease stage.
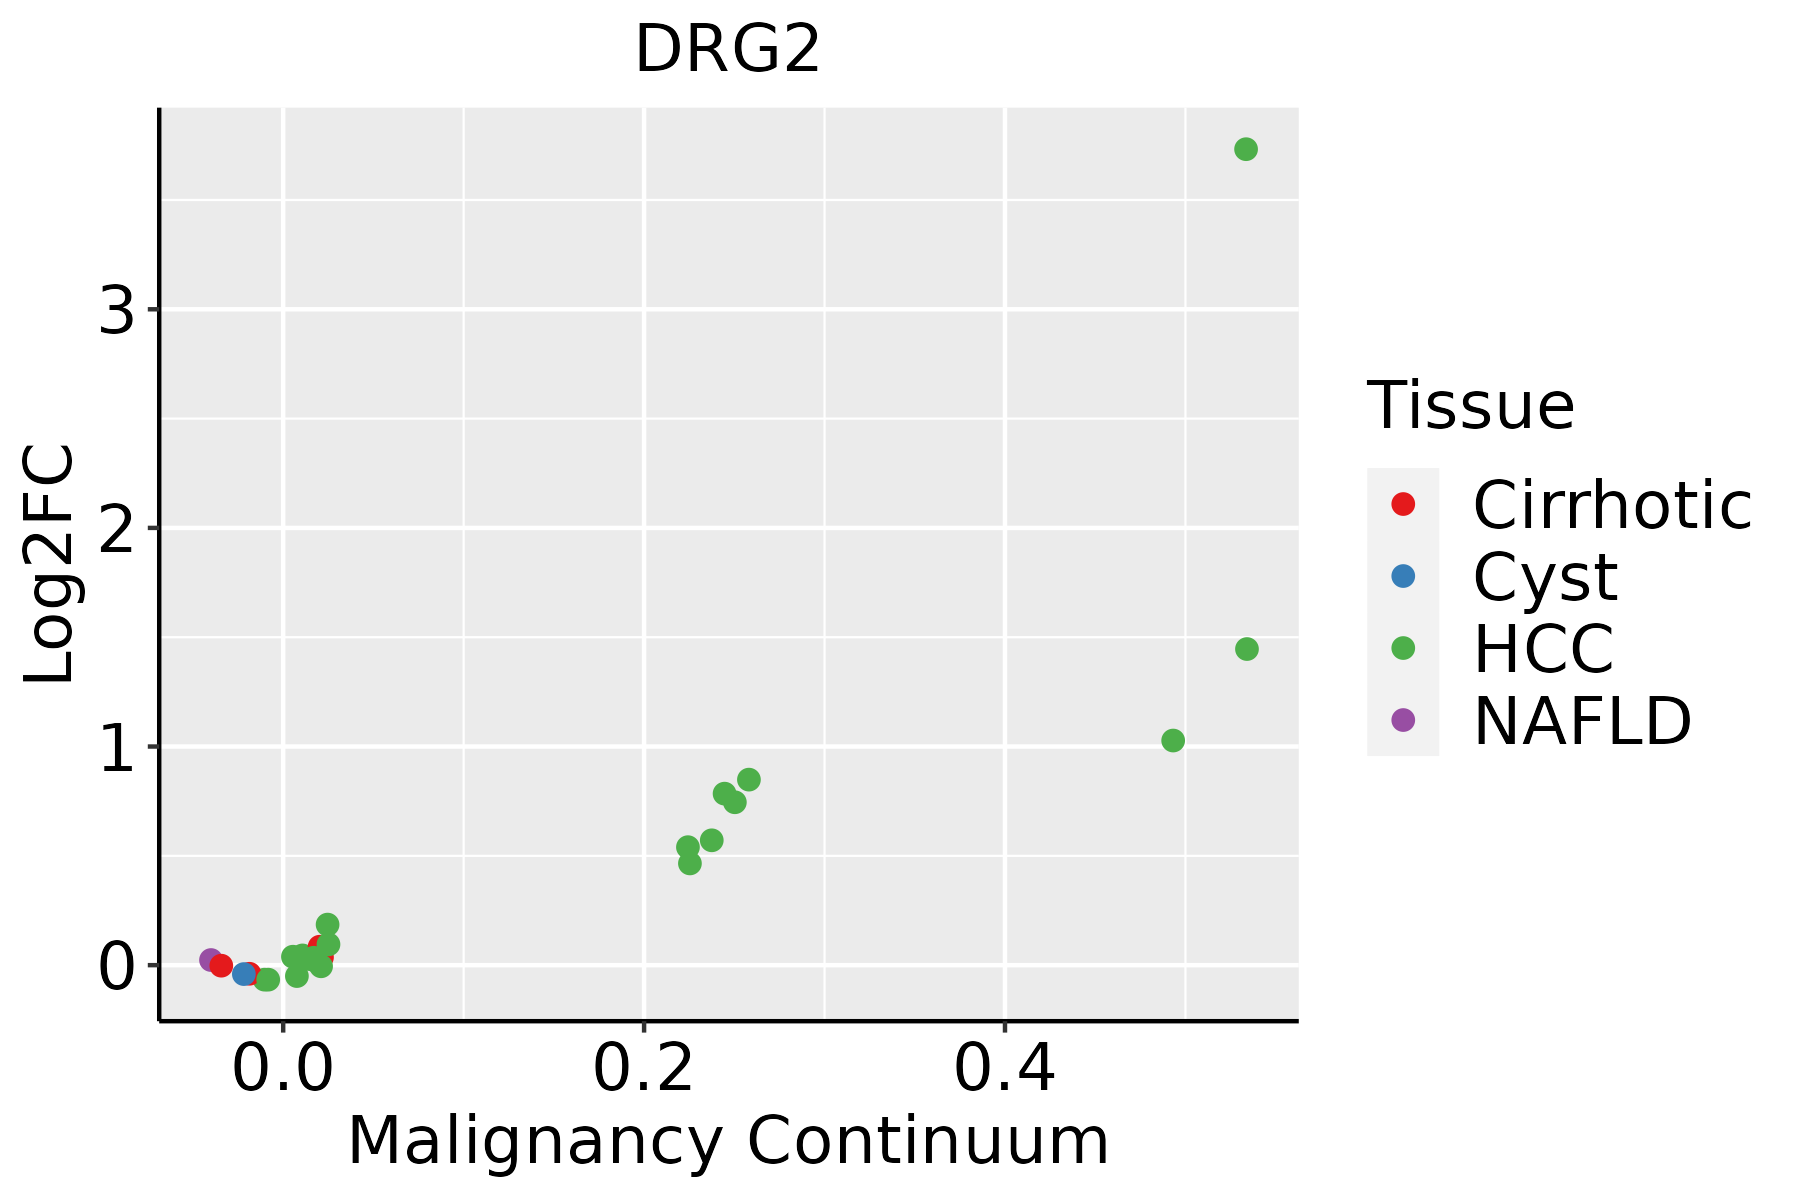
HCC: Hepatocellular carcinoma
NAFLD: Non-alcoholic fatty liver disease
Oral CavityThe image shows the transcriptomic changes along malignancy continuum.log2FC in expression of this searched gene in stem-like cells from each diseased tissue sample relative to stem-like cells in normal samples in each tissue plotted against the malignancy continuum. Samples are colored based on if they are from different disease stage.
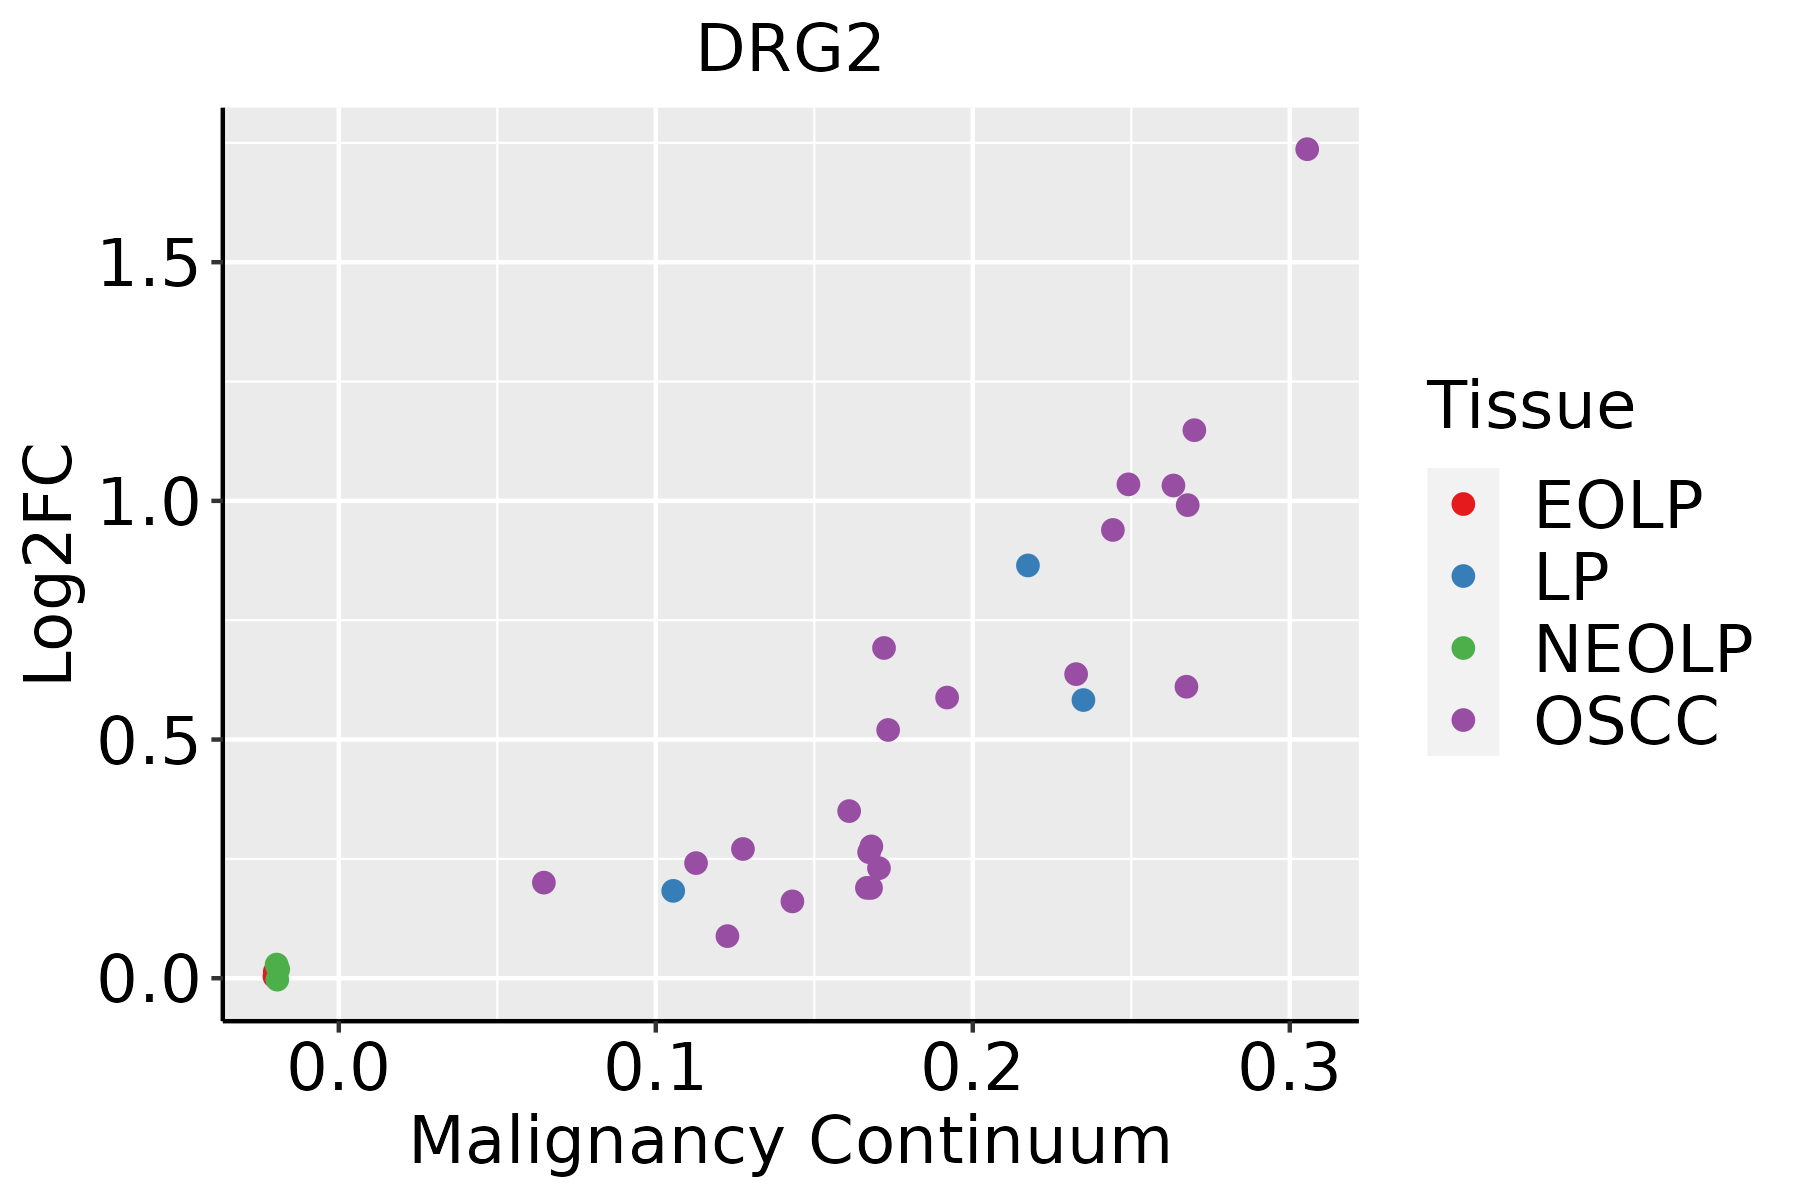
EOLP: Erosive Oral lichen planus
LP: leukoplakia
NEOLP: Non-erosive oral lichen planus
OSCC: Oral squamous cell carcinoma
SkinThe image shows the transcriptomic changes along malignancy continuum.log2FC in expression of this searched gene in stem-like cells from each diseased tissue sample relative to stem-like cells in normal samples in each tissue plotted against the malignancy continuum. Samples are colored based on if they are from different disease stage.AK: Actinic keratosis
cSCC: Cutaneous squamous cell carcinoma
SCCIS:squamous cell carcinoma in situ
∗log2FC in expression of this searched gene in stem-like cells from each diseased tissue sample relative to stem-like cells in normal samples in each tissue plotted against the malignancy continuum. Samples are colored based on if they are from different disease stage.

Top

Malignant transformation related pathway analysis

check buttonFind out the enriched GO biological processes and KEGG pathways involved in transition from healthy to precancer to cancer
check button Figure of enriched GO biological processes.
TissueDisease StageEnriched GO biological Processes
ColorectumADGO analysis - Figure of enriched GO biological processes: Top 15 enriched GO BP terms are showed in the bar plot of each disease state in each tissue. Each row represents a significant GO biological process which is colored according to the -log10(p.adjust).
ColorectumSERGO analysis - Figure of enriched GO biological processes: Top 15 enriched GO BP terms are showed in the bar plot of each disease state in each tissue. Each row represents a significant GO biological process which is colored according to the -log10(p.adjust).
ColorectumMSSGO analysis - Figure of enriched GO biological processes: Top 15 enriched GO BP terms are showed in the bar plot of each disease state in each tissue. Each row represents a significant GO biological process which is colored according to the -log10(p.adjust).
ColorectumMSI-HGO analysis - Figure of enriched GO biological processes: Top 15 enriched GO BP terms are showed in the bar plot of each disease state in each tissue. Each row represents a significant GO biological process which is colored according to the -log10(p.adjust).
ColorectumFAPGO analysis - Figure of enriched GO biological processes: Top 15 enriched GO BP terms are showed in the bar plot of each disease state in each tissue. Each row represents a significant GO biological process which is colored according to the -log10(p.adjust).
∗Top 15 enriched GO BP terms are showed in the bar plot of each disease state in each tissue. Each row represents a significant GO biological process which is colored according to the -log10(p.adjust).
Page: 1 2 3 4 5 6 7 8 9 

check button Enriched GO biological processes.
GO IDTissueDisease StageDescriptionGene RatioBg Ratiopvaluep.adjustCount
GO:00217629BreastPrecancersubstantia nigra development15/108044/187231.12e-087.98e-0715
GO:00309018BreastPrecancermidbrain development20/108090/187231.50e-077.93e-0620
GO:00488578BreastPrecancerneural nucleus development16/108064/187234.76e-072.11e-0516
GO:002176214BreastIDCsubstantia nigra development18/143444/187231.11e-091.07e-0718
GO:004885713BreastIDCneural nucleus development21/143464/187235.35e-094.28e-0721
GO:003090112BreastIDCmidbrain development24/143490/187234.35e-082.87e-0624
GO:00703713BreastIDCERK1 and ERK2 cascade43/1434330/187234.28e-045.84e-0343
GO:00486592BreastIDCsmooth muscle cell proliferation26/1434184/187231.77e-031.72e-0226
GO:00703733BreastIDCnegative regulation of ERK1 and ERK2 cascade14/143478/187232.21e-032.06e-0214
GO:00486602BreastIDCregulation of smooth muscle cell proliferation25/1434180/187232.71e-032.41e-0225
GO:00703722BreastIDCregulation of ERK1 and ERK2 cascade37/1434309/187234.53e-033.49e-0237
GO:002176223BreastDCISsubstantia nigra development17/139044/187235.72e-094.76e-0717
GO:004885723BreastDCISneural nucleus development20/139064/187231.87e-081.29e-0620
GO:003090122BreastDCISmidbrain development23/139090/187231.10e-075.93e-0623
GO:007037111BreastDCISERK1 and ERK2 cascade41/1390330/187238.11e-049.32e-0341
GO:007037311BreastDCISnegative regulation of ERK1 and ERK2 cascade14/139078/187231.65e-031.64e-0214
GO:004865911BreastDCISsmooth muscle cell proliferation25/1390184/187232.42e-032.18e-0225
GO:004866011BreastDCISregulation of smooth muscle cell proliferation24/1390180/187233.74e-033.01e-0224
GO:0016055ColorectumADWnt signaling pathway130/3918444/187231.60e-053.37e-04130
GO:0198738ColorectumADcell-cell signaling by wnt130/3918446/187232.02e-054.10e-04130
Page: 1 2 3 4 

check button Enriched KEGG pathways.
Pathway IDTissueDisease StageDescriptionGene RatioBg Ratiopvaluep.adjustqvalueCount
Page: 1 

Top

Cell-cell communication analysis

check buttonIdentification of potential cell-cell interactions between two cell types and their ligand-receptor pairs for different disease states
LigandReceptorLRpairPathwayTissueDisease Stage
Page: 1 

Top

Single-cell gene regulatory network inference analysis

check buttonFind out the significant the regulons (TFs) and the target genes of each regulon across cell types for different disease states
TFCell TypeTissueDisease StageTarget GeneRSSRegulon Activity
∗The dot plots of a searched regulon are shown for all cell subpopulations in each disease state of each tissue based on the regulon specific score inferred using pySCENIC and by calculating the average expression.
Page: 1 

Top

Somatic mutation of malignant transformation related genes

check buttonAnnotation of somatic variants for genes involved in malignant transformation
Hugo SymbolVariant ClassVariant ClassificationdbSNP RSHGVScHGVSpHGVSp ShortSWISSPROTBIOTYPESIFTPolyPhenTumor Sample BarcodeTissueHistologySexAgeStageTherapy TypesDrugsOutcome
DRG2SNVMissense_Mutationc.215N>Gp.Ser72Cysp.S72CP55039protein_codingdeleterious(0)probably_damaging(1)TCGA-D8-A1J9-01Breastbreast invasive carcinomaFemale<65I/IIUnknownUnknownSD
DRG2SNVMissense_Mutationc.853N>Ap.Glu285Lysp.E285KP55039protein_codingtolerated(0.16)benign(0.075)TCGA-EW-A1OZ-01Breastbreast invasive carcinomaFemale<65I/IITargeted Molecular therapytrastuzumabSD
DRG2insertionNonsense_Mutationnovelc.146_147insTGAGGCGGGATTTTTTTTTTTTTTTTGAGATGGAGTTTCACTGTTp.Ser49_Ser50insGluAlaGlyPhePhePhePhePheTerAspGlyValSerLeuLeup.S49_S50insEAGFFFFF*DGVSLLP55039protein_codingTCGA-AN-A03Y-01Breastbreast invasive carcinomaFemale>=65I/IIUnknownUnknownSD
DRG2SNVMissense_Mutationc.494N>Tp.Ser165Phep.S165FP55039protein_codingdeleterious(0)probably_damaging(0.938)TCGA-AD-5900-01Colorectumcolon adenocarcinomaMale>=65I/IIUnknownUnknownSD
DRG2SNVMissense_Mutationrs552445784c.962G>Ap.Arg321Hisp.R321HP55039protein_codingtolerated(0.41)benign(0.429)TCGA-F4-6570-01Colorectumcolon adenocarcinomaFemale>=65I/IIUnknownUnknownSD
DRG2SNVMissense_Mutationnovelc.713A>Cp.Tyr238Serp.Y238SP55039protein_codingdeleterious(0)probably_damaging(0.999)TCGA-AJ-A23O-01Endometriumuterine corpus endometrioid carcinomaFemale>=65I/IIUnknownUnknownSD
DRG2SNVMissense_Mutationc.747N>Ap.Asp249Glup.D249EP55039protein_codingdeleterious(0)probably_damaging(0.996)TCGA-AP-A059-01Endometriumuterine corpus endometrioid carcinomaFemale>=65I/IIUnknownUnknownSD
DRG2SNVMissense_Mutationnovelc.416N>Tp.Thr139Metp.T139MP55039protein_codingdeleterious(0)probably_damaging(1)TCGA-AX-A0IZ-01Endometriumuterine corpus endometrioid carcinomaFemale<65I/IIUnknownUnknownSD
DRG2SNVMissense_Mutationc.611N>Gp.Gln204Argp.Q204RP55039protein_codingtolerated(0.69)benign(0.006)TCGA-D1-A16N-01Endometriumuterine corpus endometrioid carcinomaFemale<65III/IVChemotherapycarboplatinSD
DRG2SNVMissense_Mutationnovelc.946N>Ap.Glu316Lysp.E316KP55039protein_codingtolerated(0.12)benign(0.059)TCGA-D1-A16V-01Endometriumuterine corpus endometrioid carcinomaFemale>=65III/IVUnknownUnknownSD
Page: 1 2 3 

Top

Related drugs of malignant transformation related genes

check buttonIdentification of chemicals and drugs interact with genes involved in malignant transfromation
(DGIdb 4.0)
Entrez IDSymbolCategoryInteraction TypesDrug Claim NameDrug NamePMIDs
Page: 1