
|
|||||
|
 | |
| |
| |
| |
| |
| |
|
Gene: DNAJC12 |
Gene summary for DNAJC12 |
| Gene information | Species | Human | Gene symbol | DNAJC12 | Gene ID | 56521 |
| Gene name | DnaJ heat shock protein family (Hsp40) member C12 | |
| Gene Alias | HPANBH4 | |
| Cytomap | 10q21.3 | |
| Gene Type | protein-coding | GO ID | GO:0005575 | UniProtAcc | Q6IAH1 |
Top |
Malignant transformation analysis |
| Identification of the aberrant gene expression in precancerous and cancerous lesions by comparing the gene expression of stem-like cells in diseased tissues with normal stem cells |
| Entrez ID | Symbol | Replicates | Species | Organ | Tissue | Adj P-value | Log2FC | Malignancy |
| 56521 | DNAJC12 | DCIS2 | Human | Breast | DCIS | 3.82e-36 | 3.63e-02 | 0.0085 |
| 56521 | DNAJC12 | P8T-E | Human | Esophagus | ESCC | 1.19e-26 | 6.06e-01 | 0.0889 |
| 56521 | DNAJC12 | P10T-E | Human | Esophagus | ESCC | 5.65e-04 | 1.16e-01 | 0.116 |
| 56521 | DNAJC12 | P11T-E | Human | Esophagus | ESCC | 4.73e-06 | 2.83e-01 | 0.1426 |
| 56521 | DNAJC12 | P20T-E | Human | Esophagus | ESCC | 4.07e-02 | 2.74e-01 | 0.1124 |
| 56521 | DNAJC12 | P22T-E | Human | Esophagus | ESCC | 9.31e-03 | 1.33e-01 | 0.1236 |
| 56521 | DNAJC12 | P49T-E | Human | Esophagus | ESCC | 3.29e-15 | 1.30e+00 | 0.1768 |
| 56521 | DNAJC12 | P54T-E | Human | Esophagus | ESCC | 1.59e-11 | 3.06e-01 | 0.0975 |
| 56521 | DNAJC12 | P57T-E | Human | Esophagus | ESCC | 1.05e-02 | 5.74e-02 | 0.0926 |
| 56521 | DNAJC12 | P61T-E | Human | Esophagus | ESCC | 8.02e-05 | 1.61e-01 | 0.099 |
| 56521 | DNAJC12 | P75T-E | Human | Esophagus | ESCC | 9.47e-04 | 9.03e-02 | 0.1125 |
| 56521 | DNAJC12 | P76T-E | Human | Esophagus | ESCC | 1.60e-07 | 2.07e-01 | 0.1207 |
| 56521 | DNAJC12 | P79T-E | Human | Esophagus | ESCC | 5.95e-09 | 3.88e-01 | 0.1154 |
| 56521 | DNAJC12 | P89T-E | Human | Esophagus | ESCC | 2.13e-12 | 5.33e-01 | 0.1752 |
| 56521 | DNAJC12 | P128T-E | Human | Esophagus | ESCC | 2.83e-45 | 1.53e+00 | 0.1241 |
| 56521 | DNAJC12 | P130T-E | Human | Esophagus | ESCC | 1.53e-12 | 5.23e-01 | 0.1676 |
| 56521 | DNAJC12 | HCC1_Meng | Human | Liver | HCC | 2.45e-27 | 4.69e-02 | 0.0246 |
| 56521 | DNAJC12 | HCC2_Meng | Human | Liver | HCC | 1.27e-42 | 4.39e-01 | 0.0107 |
| 56521 | DNAJC12 | S014 | Human | Liver | HCC | 2.44e-22 | 8.83e-01 | 0.2254 |
| 56521 | DNAJC12 | S015 | Human | Liver | HCC | 4.06e-12 | 8.23e-01 | 0.2375 |
| Page: 1 2 3 |
| Tissue | Expression Dynamics | Abbreviation |
| Breast | 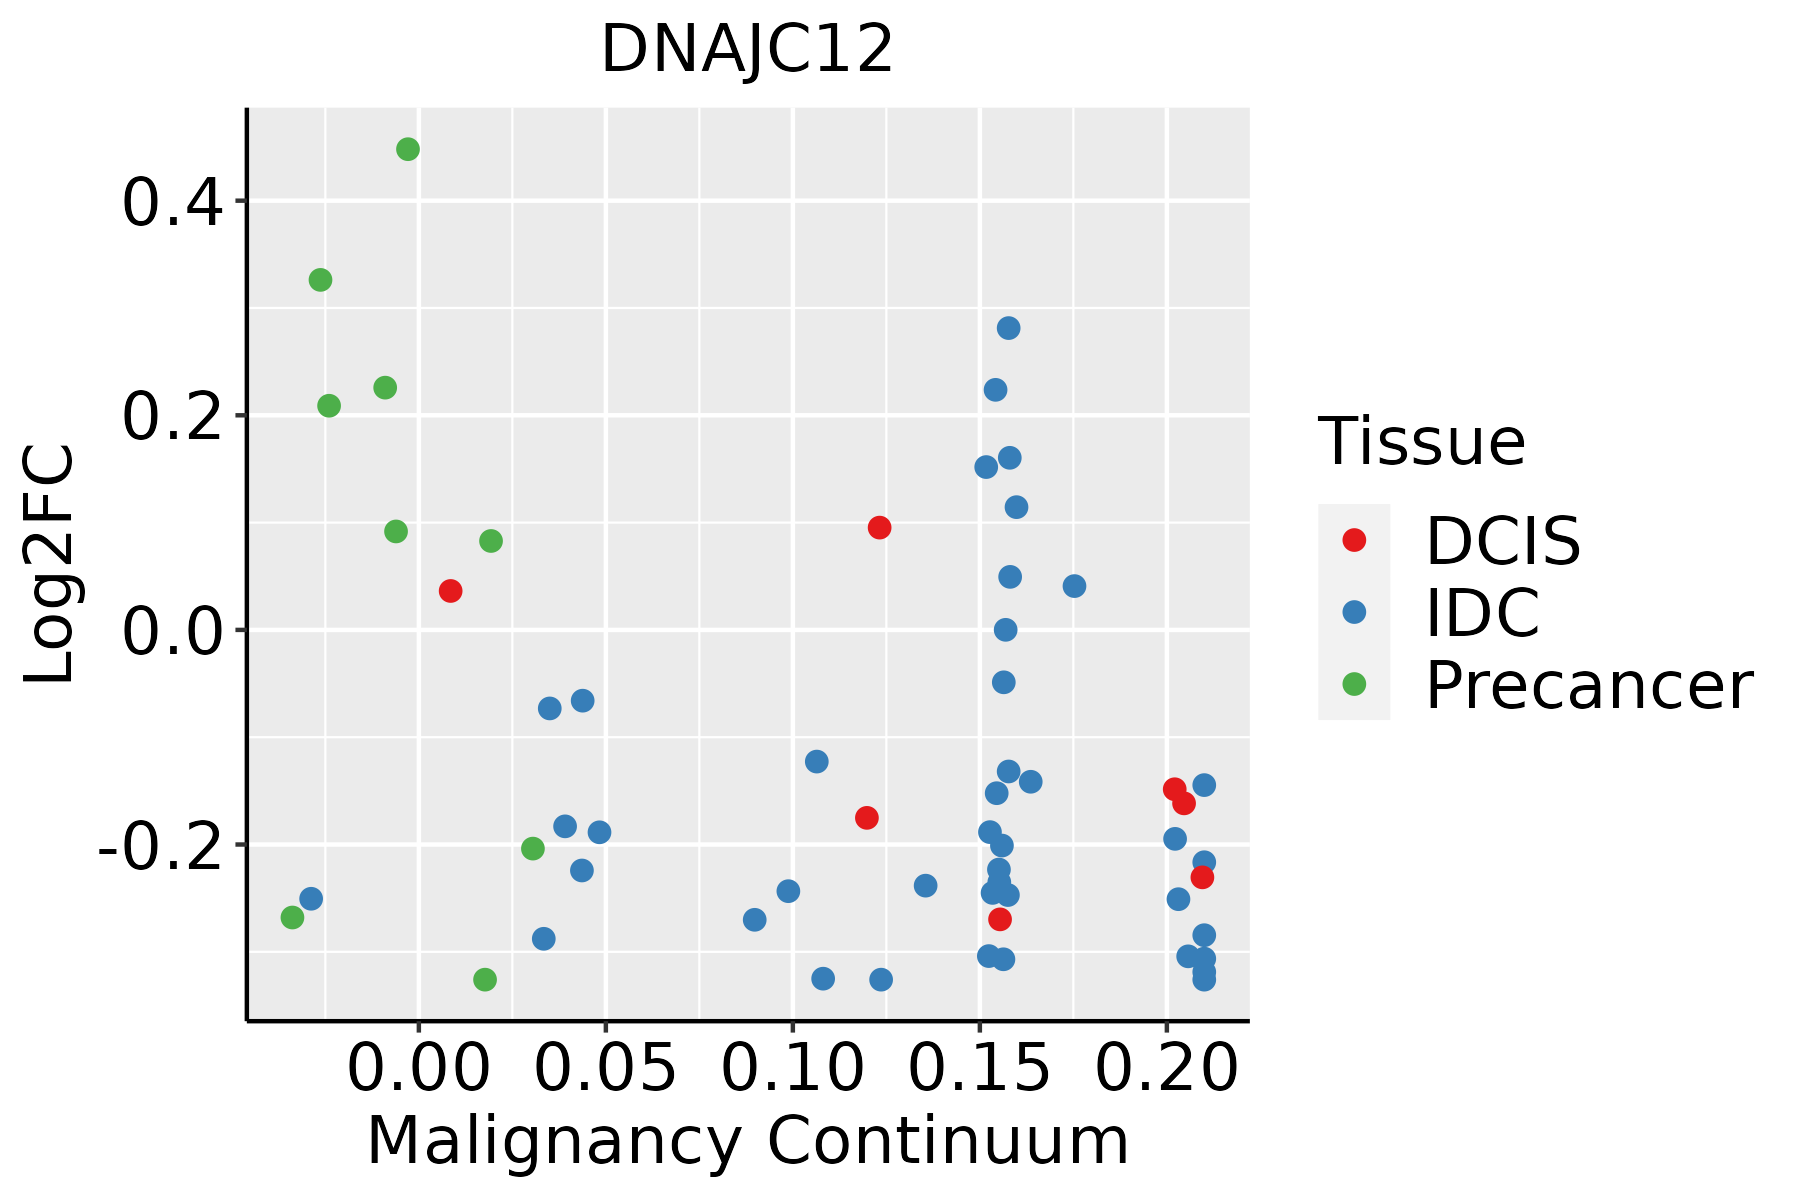 | IDC: Invasive ductal carcinoma |
| DCIS: Ductal carcinoma in situ | ||
| Precancer(BRCA1-mut): Precancerous lesion from BRCA1 mutation carriers | ||
| Esophagus | 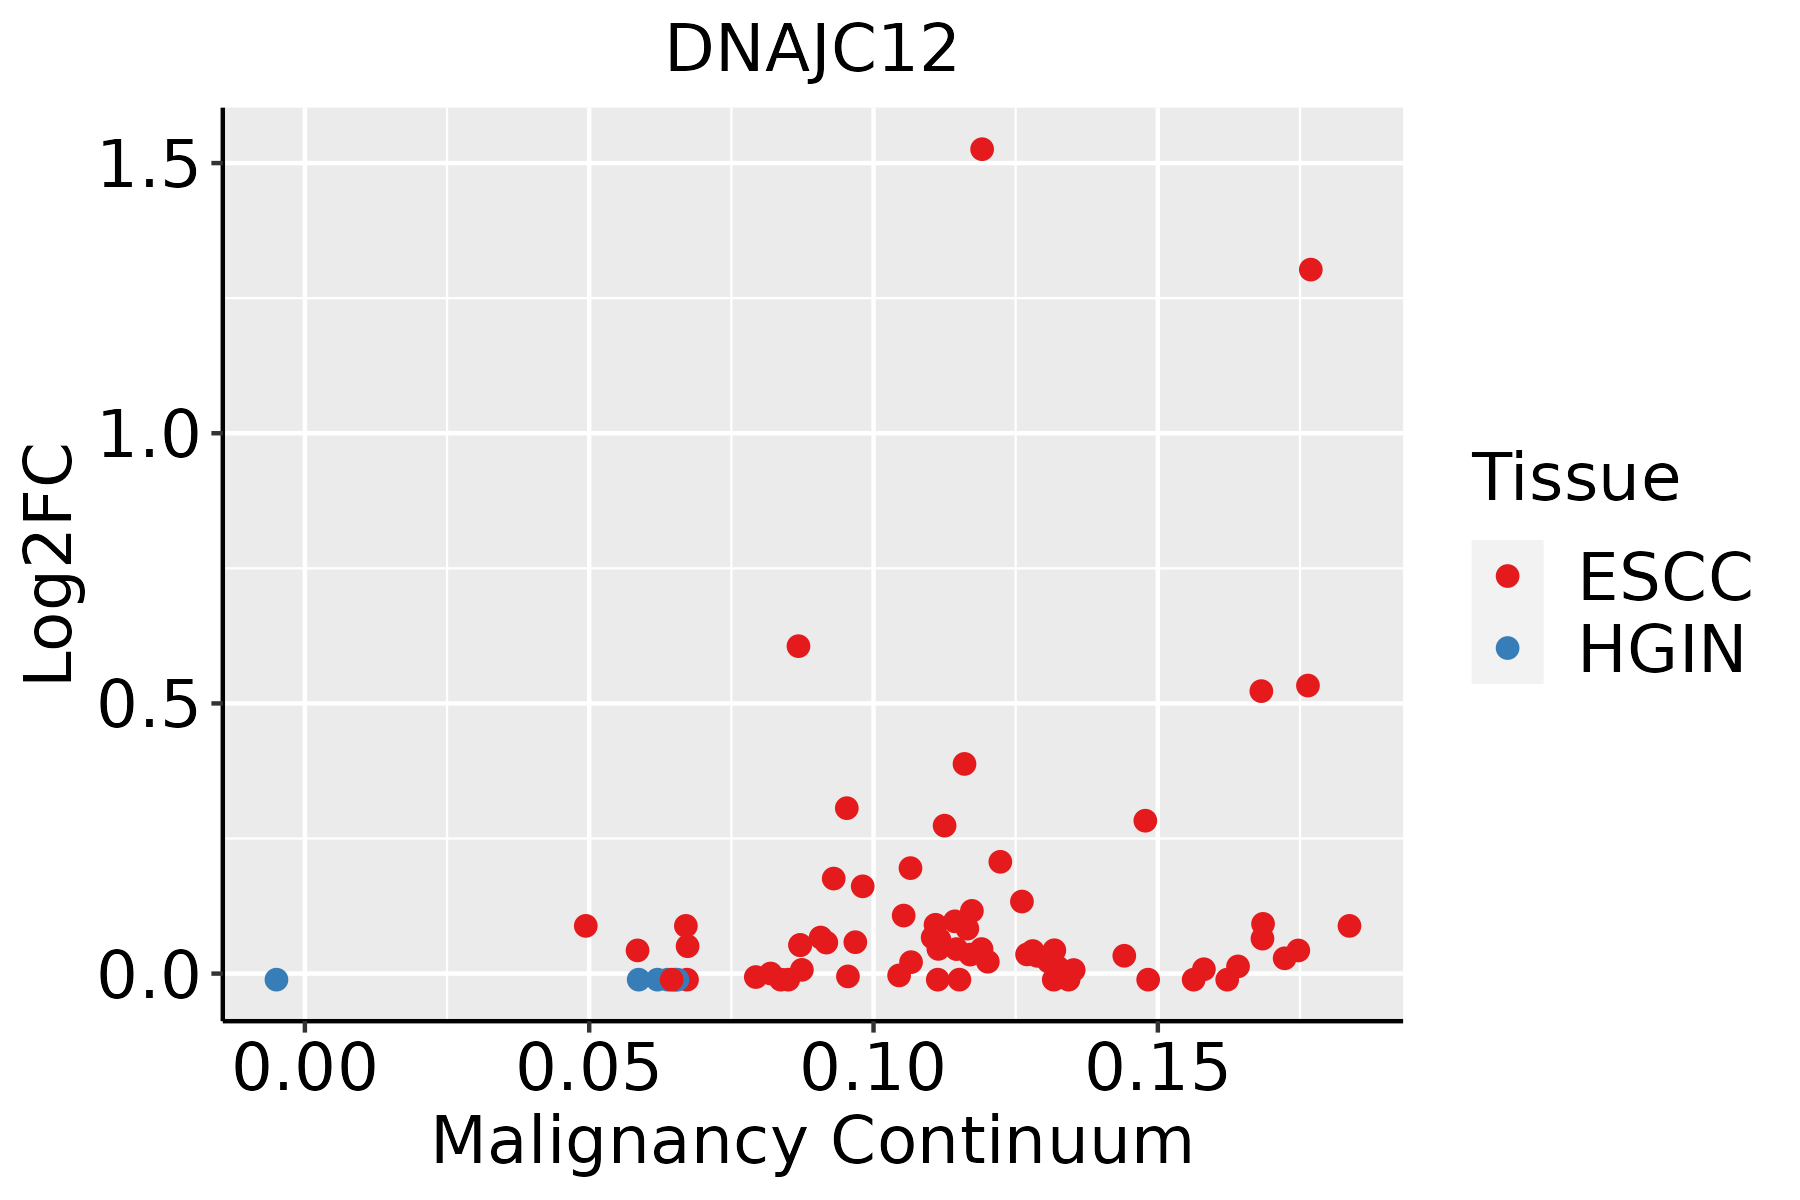 | ESCC: Esophageal squamous cell carcinoma |
| HGIN: High-grade intraepithelial neoplasias | ||
| LGIN: Low-grade intraepithelial neoplasias | ||
| Liver | 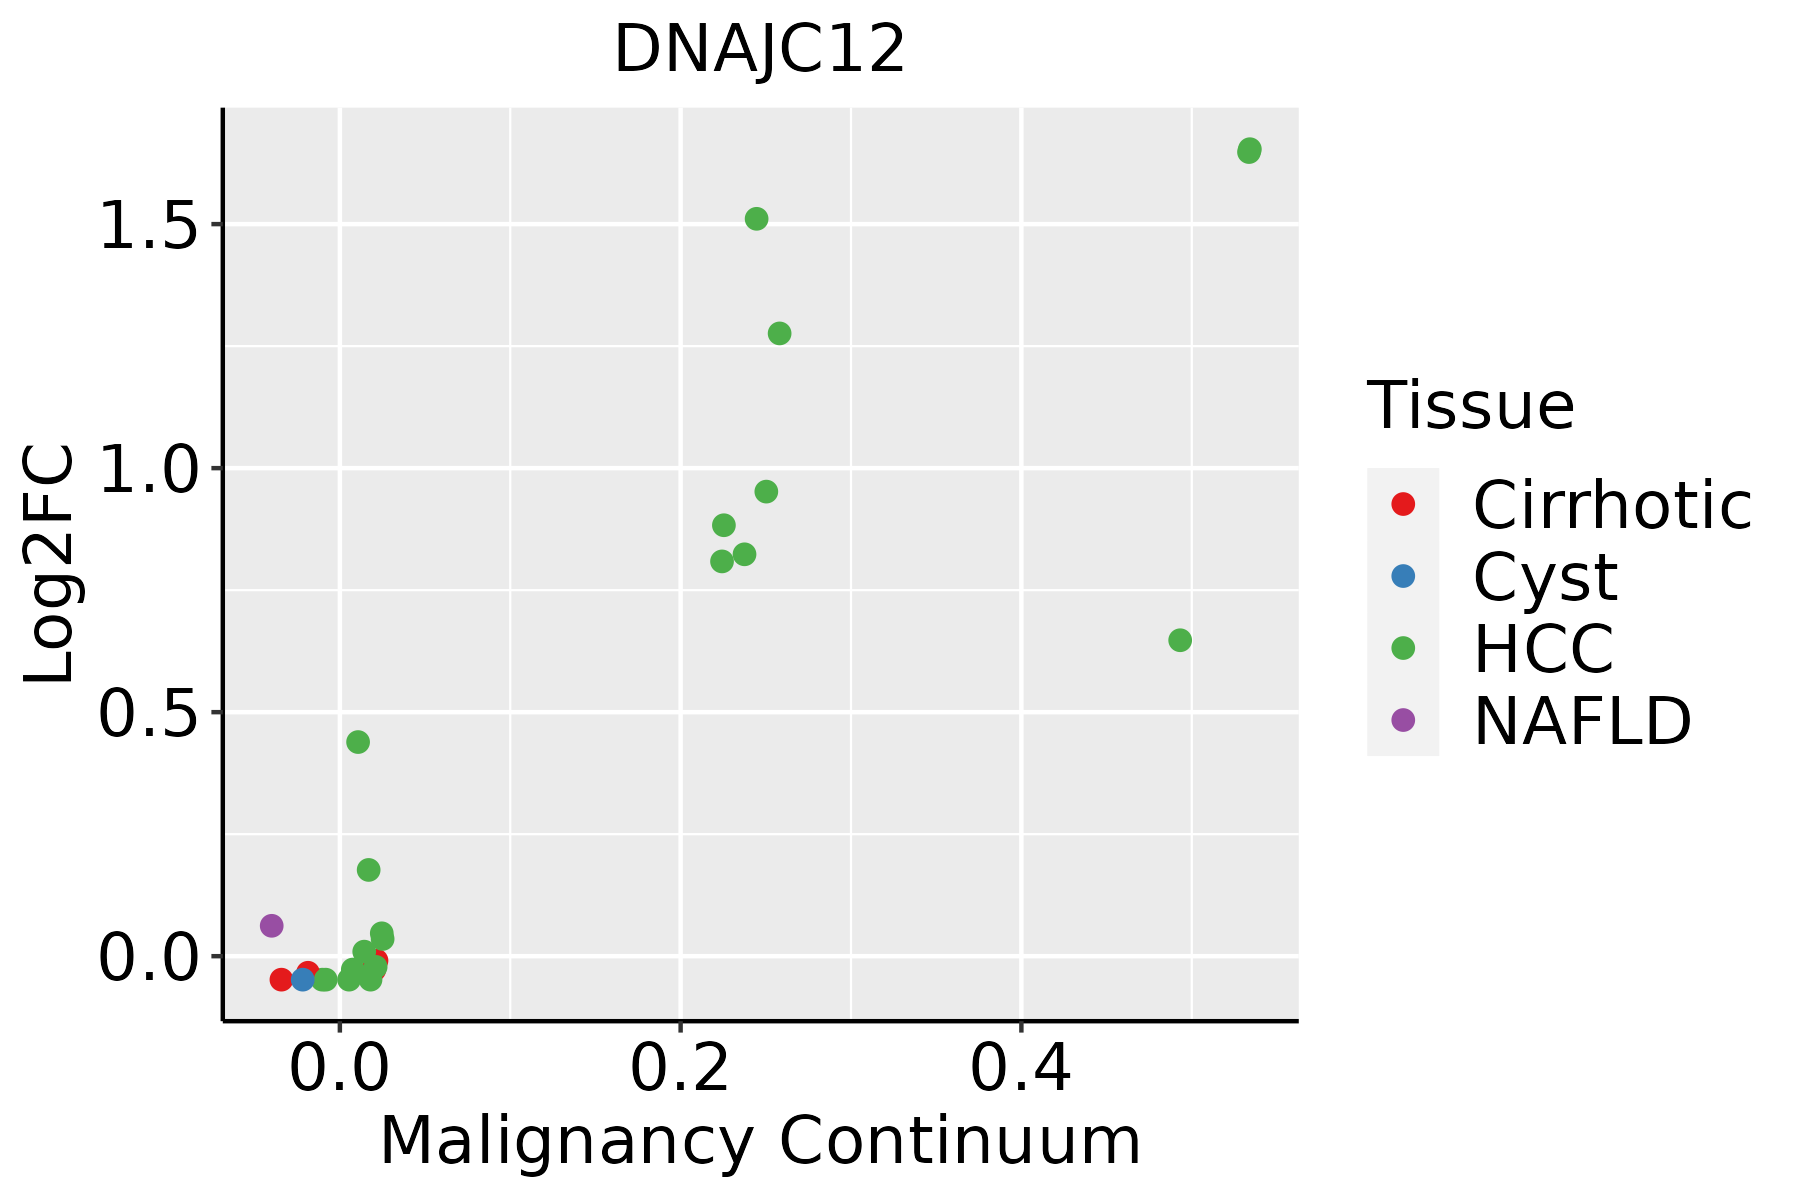 | HCC: Hepatocellular carcinoma |
| NAFLD: Non-alcoholic fatty liver disease | ||
| Oral Cavity | 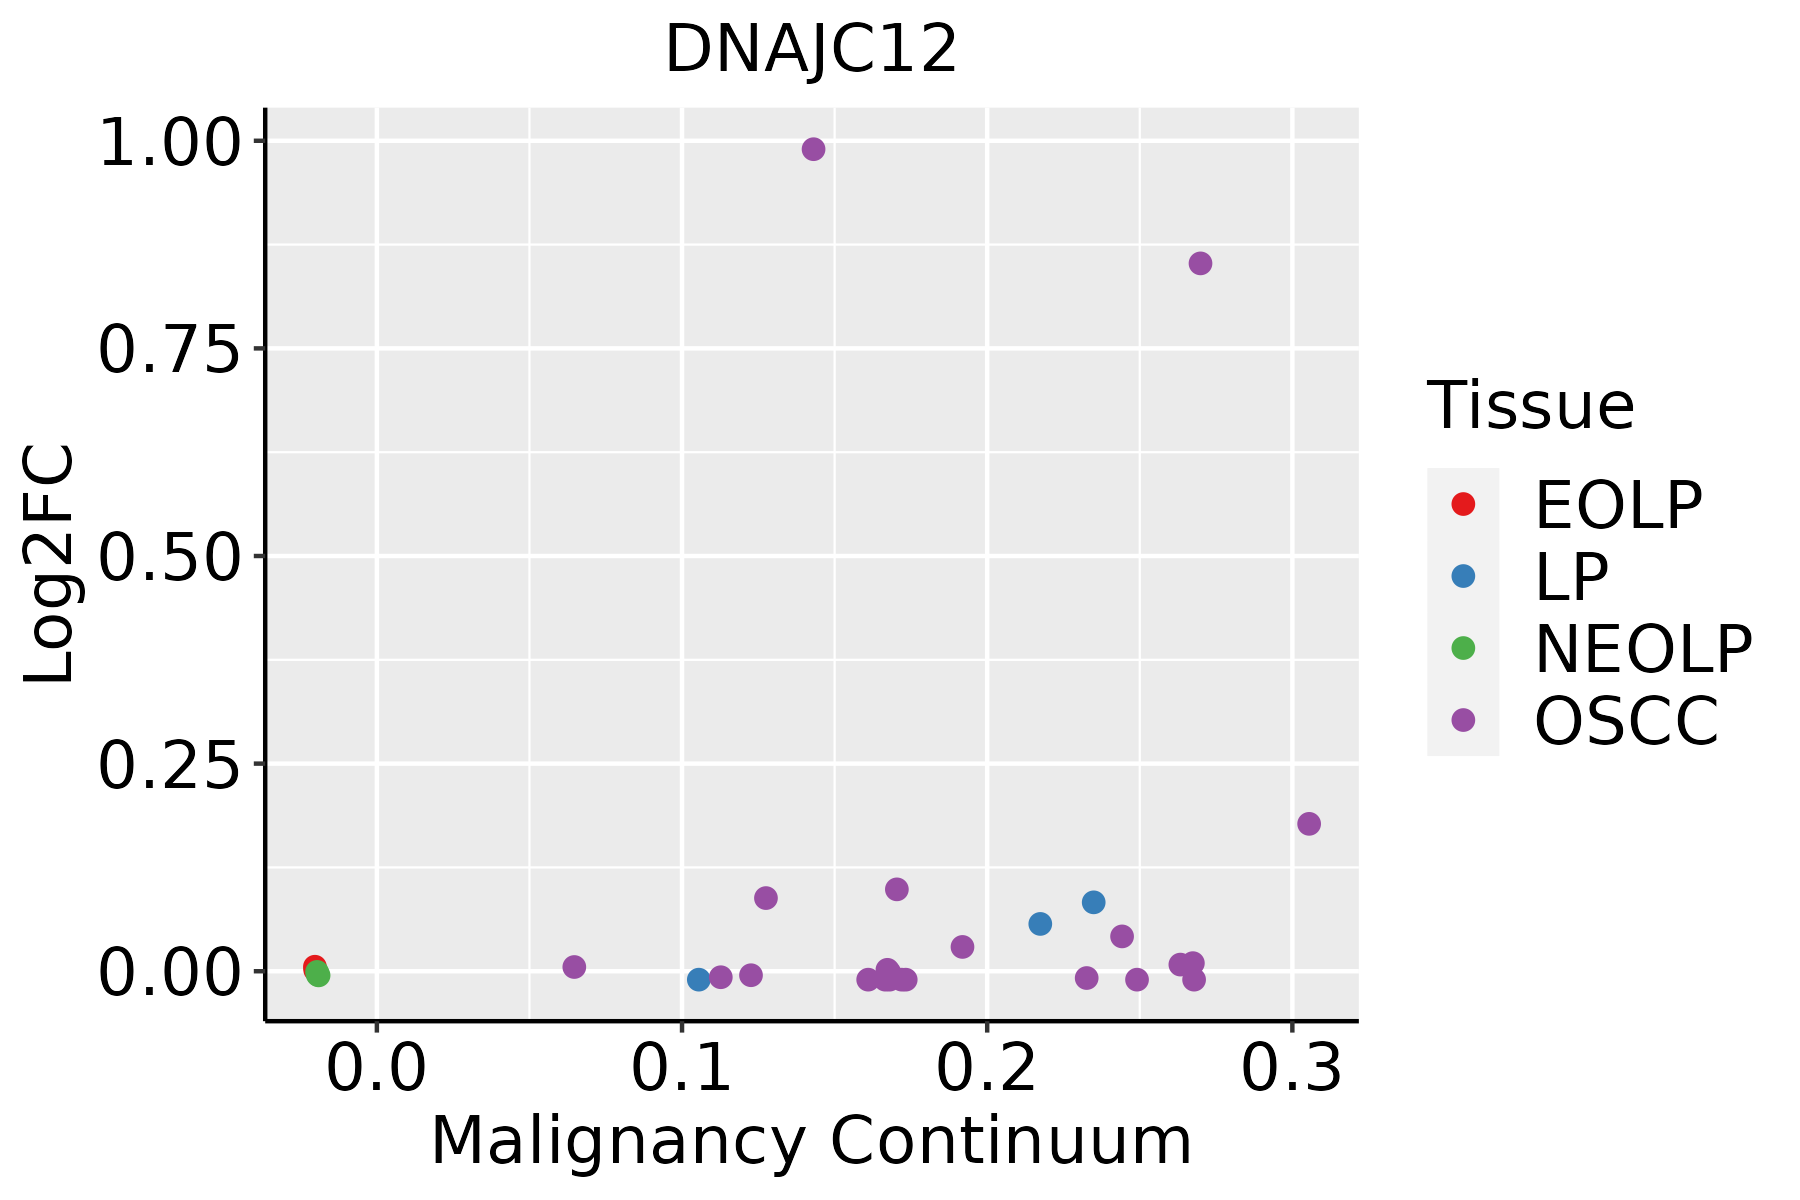 | EOLP: Erosive Oral lichen planus |
| LP: leukoplakia | ||
| NEOLP: Non-erosive oral lichen planus | ||
| OSCC: Oral squamous cell carcinoma | ||
| Prostate |  | BPH: Benign Prostatic Hyperplasia |
| ∗log2FC in expression of this searched gene in stem-like cells from each diseased tissue sample relative to stem-like cells in normal samples in each tissue plotted against the malignancy continuum. Samples are colored based on if they are from different disease stage. |
Top |
Malignant transformation related pathway analysis |
| Find out the enriched GO biological processes and KEGG pathways involved in transition from healthy to precancer to cancer |
| Tissue | Disease Stage | Enriched GO biological Processes |
| Colorectum | AD |  |
| Colorectum | SER |  |
| Colorectum | MSS |  |
| Colorectum | MSI-H |  |
| Colorectum | FAP |  |
| ∗Top 15 enriched GO BP terms are showed in the bar plot of each disease state in each tissue. Each row represents a significant GO biological process which is colored according to the -log10(p.adjust). |
| Page: 1 2 3 4 5 6 7 8 9 |
| GO ID | Tissue | Disease Stage | Description | Gene Ratio | Bg Ratio | pvalue | p.adjust | Count |
| Page: 1 |
| Pathway ID | Tissue | Disease Stage | Description | Gene Ratio | Bg Ratio | pvalue | p.adjust | qvalue | Count |
| Page: 1 |
Top |
Cell-cell communication analysis |
| Identification of potential cell-cell interactions between two cell types and their ligand-receptor pairs for different disease states |
| Ligand | Receptor | LRpair | Pathway | Tissue | Disease Stage |
| Page: 1 |
Top |
Single-cell gene regulatory network inference analysis |
| Find out the significant the regulons (TFs) and the target genes of each regulon across cell types for different disease states |
| TF | Cell Type | Tissue | Disease Stage | Target Gene | RSS | Regulon Activity |
| ∗The dot plots of a searched regulon are shown for all cell subpopulations in each disease state of each tissue based on the regulon specific score inferred using pySCENIC and by calculating the average expression. |
| Page: 1 |
Top |
Somatic mutation of malignant transformation related genes |
| Annotation of somatic variants for genes involved in malignant transformation |
| Hugo Symbol | Variant Class | Variant Classification | dbSNP RS | HGVSc | HGVSp | HGVSp Short | SWISSPROT | BIOTYPE | SIFT | PolyPhen | Tumor Sample Barcode | Tissue | Histology | Sex | Age | Stage | Therapy Types | Drugs | Outcome |
| DNAJC12 | SNV | Missense_Mutation | c.358C>T | p.His120Tyr | p.H120Y | Q9UKB3 | protein_coding | tolerated(1) | benign(0) | TCGA-UC-A7PF-01 | Cervix | cervical & endocervical cancer | Female | <65 | I/II | Unknown | Unknown | SD | |
| DNAJC12 | SNV | Missense_Mutation | c.298N>C | p.Ser100Pro | p.S100P | Q9UKB3 | protein_coding | deleterious(0) | possibly_damaging(0.566) | TCGA-AA-3715-01 | Colorectum | colon adenocarcinoma | Male | >=65 | I/II | Unknown | Unknown | PD | |
| DNAJC12 | SNV | Missense_Mutation | c.497N>A | p.Ser166Tyr | p.S166Y | Q9UKB3 | protein_coding | tolerated(0.08) | possibly_damaging(0.832) | TCGA-AA-A00N-01 | Colorectum | colon adenocarcinoma | Male | >=65 | I/II | Unknown | Unknown | PD | |
| DNAJC12 | SNV | Missense_Mutation | novel | c.137N>G | p.His46Arg | p.H46R | Q9UKB3 | protein_coding | deleterious(0.01) | possibly_damaging(0.604) | TCGA-AA-A01K-01 | Colorectum | colon adenocarcinoma | Female | >=65 | III/IV | Chemotherapy | folinic | CR |
| DNAJC12 | SNV | Missense_Mutation | novel | c.512A>G | p.Asp171Gly | p.D171G | Q9UKB3 | protein_coding | tolerated(0.09) | benign(0.024) | TCGA-AZ-4315-01 | Colorectum | colon adenocarcinoma | Male | <65 | I/II | Unknown | Unknown | SD |
| DNAJC12 | SNV | Missense_Mutation | rs200719110 | c.440C>T | p.Thr147Met | p.T147M | Q9UKB3 | protein_coding | tolerated(0.2) | benign(0) | TCGA-CM-5341-01 | Colorectum | colon adenocarcinoma | Female | >=65 | III/IV | Chemotherapy | fluorouracil | SD |
| DNAJC12 | insertion | Nonsense_Mutation | novel | c.13_14insCTTAAATAAAAACT | p.Leu5ProfsTer2 | p.L5Pfs*2 | Q9UKB3 | protein_coding | TCGA-AM-5820-01 | Colorectum | colon adenocarcinoma | Female | <65 | I/II | Unknown | Unknown | SD | ||
| DNAJC12 | SNV | Missense_Mutation | novel | c.376N>T | p.Asn126Tyr | p.N126Y | Q9UKB3 | protein_coding | deleterious(0.03) | benign(0) | TCGA-A5-A0G1-01 | Endometrium | uterine corpus endometrioid carcinoma | Female | >=65 | I/II | Unknown | Unknown | SD |
| DNAJC12 | SNV | Missense_Mutation | novel | c.12N>G | p.Ile4Met | p.I4M | Q9UKB3 | protein_coding | deleterious(0.05) | probably_damaging(0.954) | TCGA-A5-A0G2-01 | Endometrium | uterine corpus endometrioid carcinoma | Female | <65 | III/IV | Unknown | Unknown | SD |
| DNAJC12 | SNV | Missense_Mutation | rs769789184 | c.221N>A | p.Arg74His | p.R74H | Q9UKB3 | protein_coding | tolerated(0.12) | benign(0.003) | TCGA-A5-A1OF-01 | Endometrium | uterine corpus endometrioid carcinoma | Female | <65 | I/II | Unknown | Unknown | SD |
| Page: 1 2 3 |
Top |
Related drugs of malignant transformation related genes |
| Identification of chemicals and drugs interact with genes involved in malignant transfromation |
| (DGIdb 4.0) |
| Entrez ID | Symbol | Category | Interaction Types | Drug Claim Name | Drug Name | PMIDs |
| Page: 1 |

Copyright 2023-Present -The University of Texas Health Science Center at Houston |