
|
|||||
|
 | |
| |
| |
| |
| |
| |
|
Gene: DNAAF5 |
Gene summary for DNAAF5 |
| Gene information | Species | Human | Gene symbol | DNAAF5 | Gene ID | 54919 |
| Gene name | dynein axonemal assembly factor 5 | |
| Gene Alias | CILD18 | |
| Cytomap | 7p22.3 | |
| Gene Type | protein-coding | GO ID | GO:0000226 | UniProtAcc | B3KPE2 |
Top |
Malignant transformation analysis |
| Identification of the aberrant gene expression in precancerous and cancerous lesions by comparing the gene expression of stem-like cells in diseased tissues with normal stem cells |
| Entrez ID | Symbol | Replicates | Species | Organ | Tissue | Adj P-value | Log2FC | Malignancy |
| 54919 | DNAAF5 | P27T-E | Human | Esophagus | ESCC | 1.55e-06 | 1.98e-01 | 0.1055 |
| 54919 | DNAAF5 | P28T-E | Human | Esophagus | ESCC | 1.33e-22 | 4.27e-01 | 0.1149 |
| 54919 | DNAAF5 | P30T-E | Human | Esophagus | ESCC | 1.43e-20 | 6.65e-01 | 0.137 |
| 54919 | DNAAF5 | P31T-E | Human | Esophagus | ESCC | 7.45e-06 | 1.80e-01 | 0.1251 |
| 54919 | DNAAF5 | P32T-E | Human | Esophagus | ESCC | 1.80e-15 | 3.37e-01 | 0.1666 |
| 54919 | DNAAF5 | P37T-E | Human | Esophagus | ESCC | 1.38e-18 | 4.53e-01 | 0.1371 |
| 54919 | DNAAF5 | P39T-E | Human | Esophagus | ESCC | 5.78e-03 | 5.86e-02 | 0.0894 |
| 54919 | DNAAF5 | P40T-E | Human | Esophagus | ESCC | 6.22e-03 | 1.47e-01 | 0.109 |
| 54919 | DNAAF5 | P42T-E | Human | Esophagus | ESCC | 1.01e-12 | 3.69e-01 | 0.1175 |
| 54919 | DNAAF5 | P47T-E | Human | Esophagus | ESCC | 1.95e-02 | 1.20e-01 | 0.1067 |
| 54919 | DNAAF5 | P48T-E | Human | Esophagus | ESCC | 2.13e-04 | 1.29e-01 | 0.0959 |
| 54919 | DNAAF5 | P52T-E | Human | Esophagus | ESCC | 6.40e-11 | 2.12e-01 | 0.1555 |
| 54919 | DNAAF5 | P54T-E | Human | Esophagus | ESCC | 1.29e-04 | 1.66e-01 | 0.0975 |
| 54919 | DNAAF5 | P56T-E | Human | Esophagus | ESCC | 4.53e-03 | 4.68e-01 | 0.1613 |
| 54919 | DNAAF5 | P57T-E | Human | Esophagus | ESCC | 3.53e-03 | 7.09e-02 | 0.0926 |
| 54919 | DNAAF5 | P62T-E | Human | Esophagus | ESCC | 6.87e-26 | 5.63e-01 | 0.1302 |
| 54919 | DNAAF5 | P74T-E | Human | Esophagus | ESCC | 9.59e-06 | 2.51e-01 | 0.1479 |
| 54919 | DNAAF5 | P75T-E | Human | Esophagus | ESCC | 6.65e-10 | 1.21e-01 | 0.1125 |
| 54919 | DNAAF5 | P76T-E | Human | Esophagus | ESCC | 1.52e-04 | 1.46e-01 | 0.1207 |
| 54919 | DNAAF5 | P79T-E | Human | Esophagus | ESCC | 5.11e-10 | 1.70e-01 | 0.1154 |
| Page: 1 2 3 4 |
| Tissue | Expression Dynamics | Abbreviation |
| Esophagus | 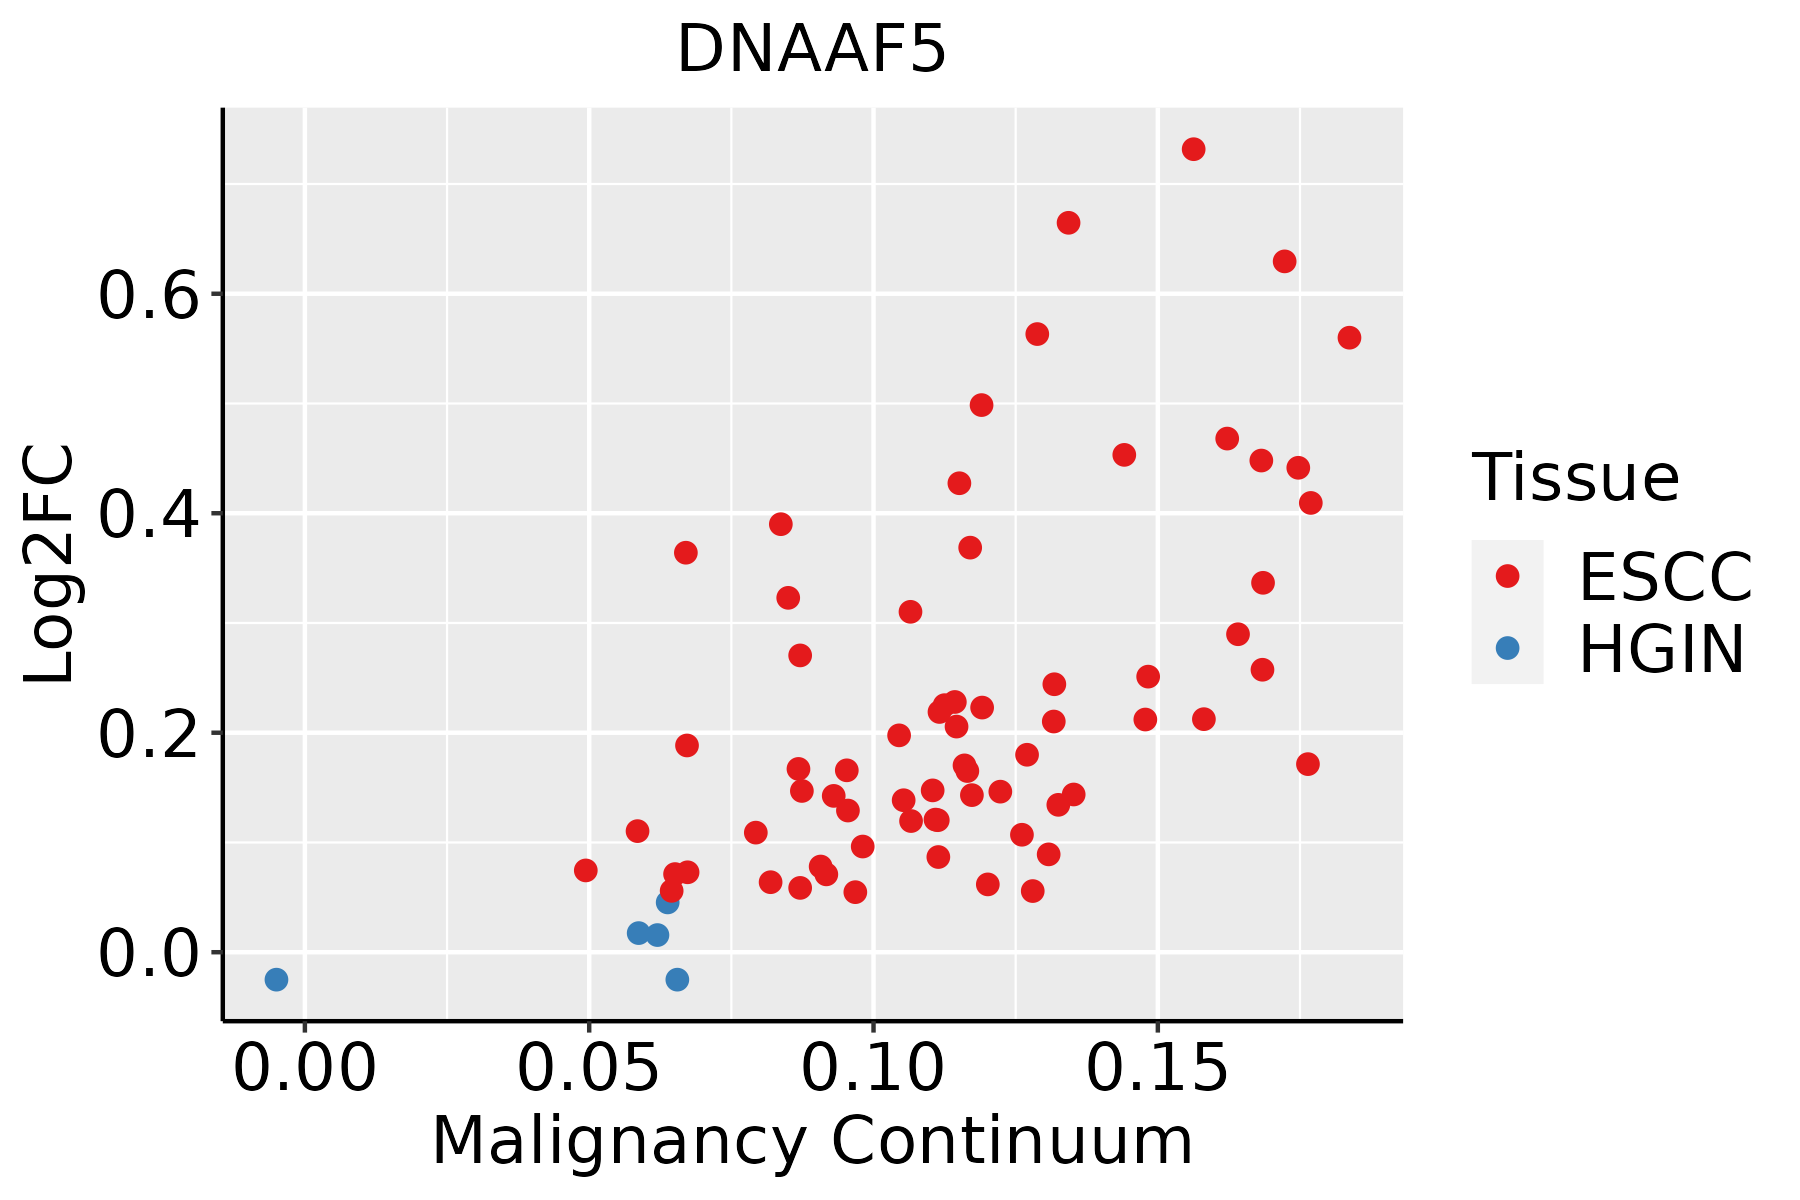 | ESCC: Esophageal squamous cell carcinoma |
| HGIN: High-grade intraepithelial neoplasias | ||
| LGIN: Low-grade intraepithelial neoplasias | ||
| Liver | 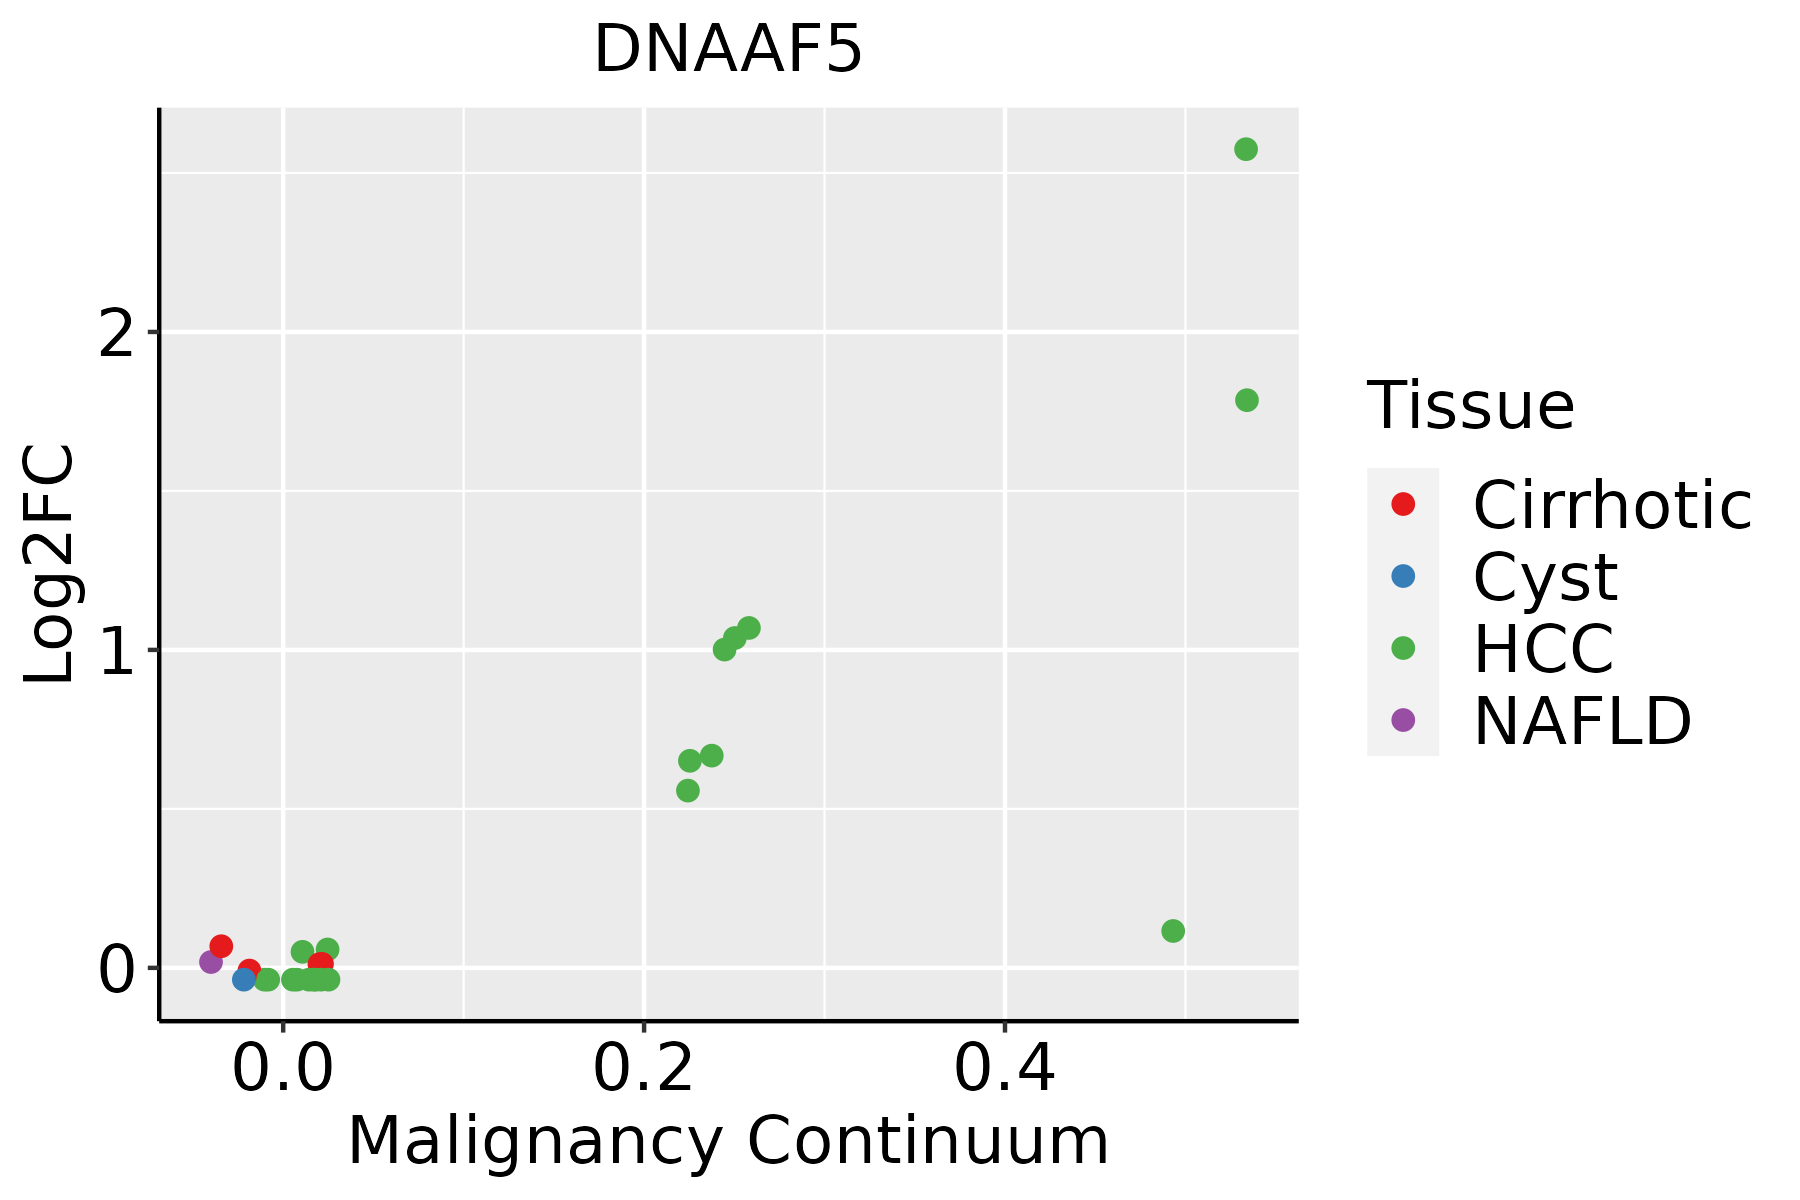 | HCC: Hepatocellular carcinoma |
| NAFLD: Non-alcoholic fatty liver disease | ||
| Oral Cavity | 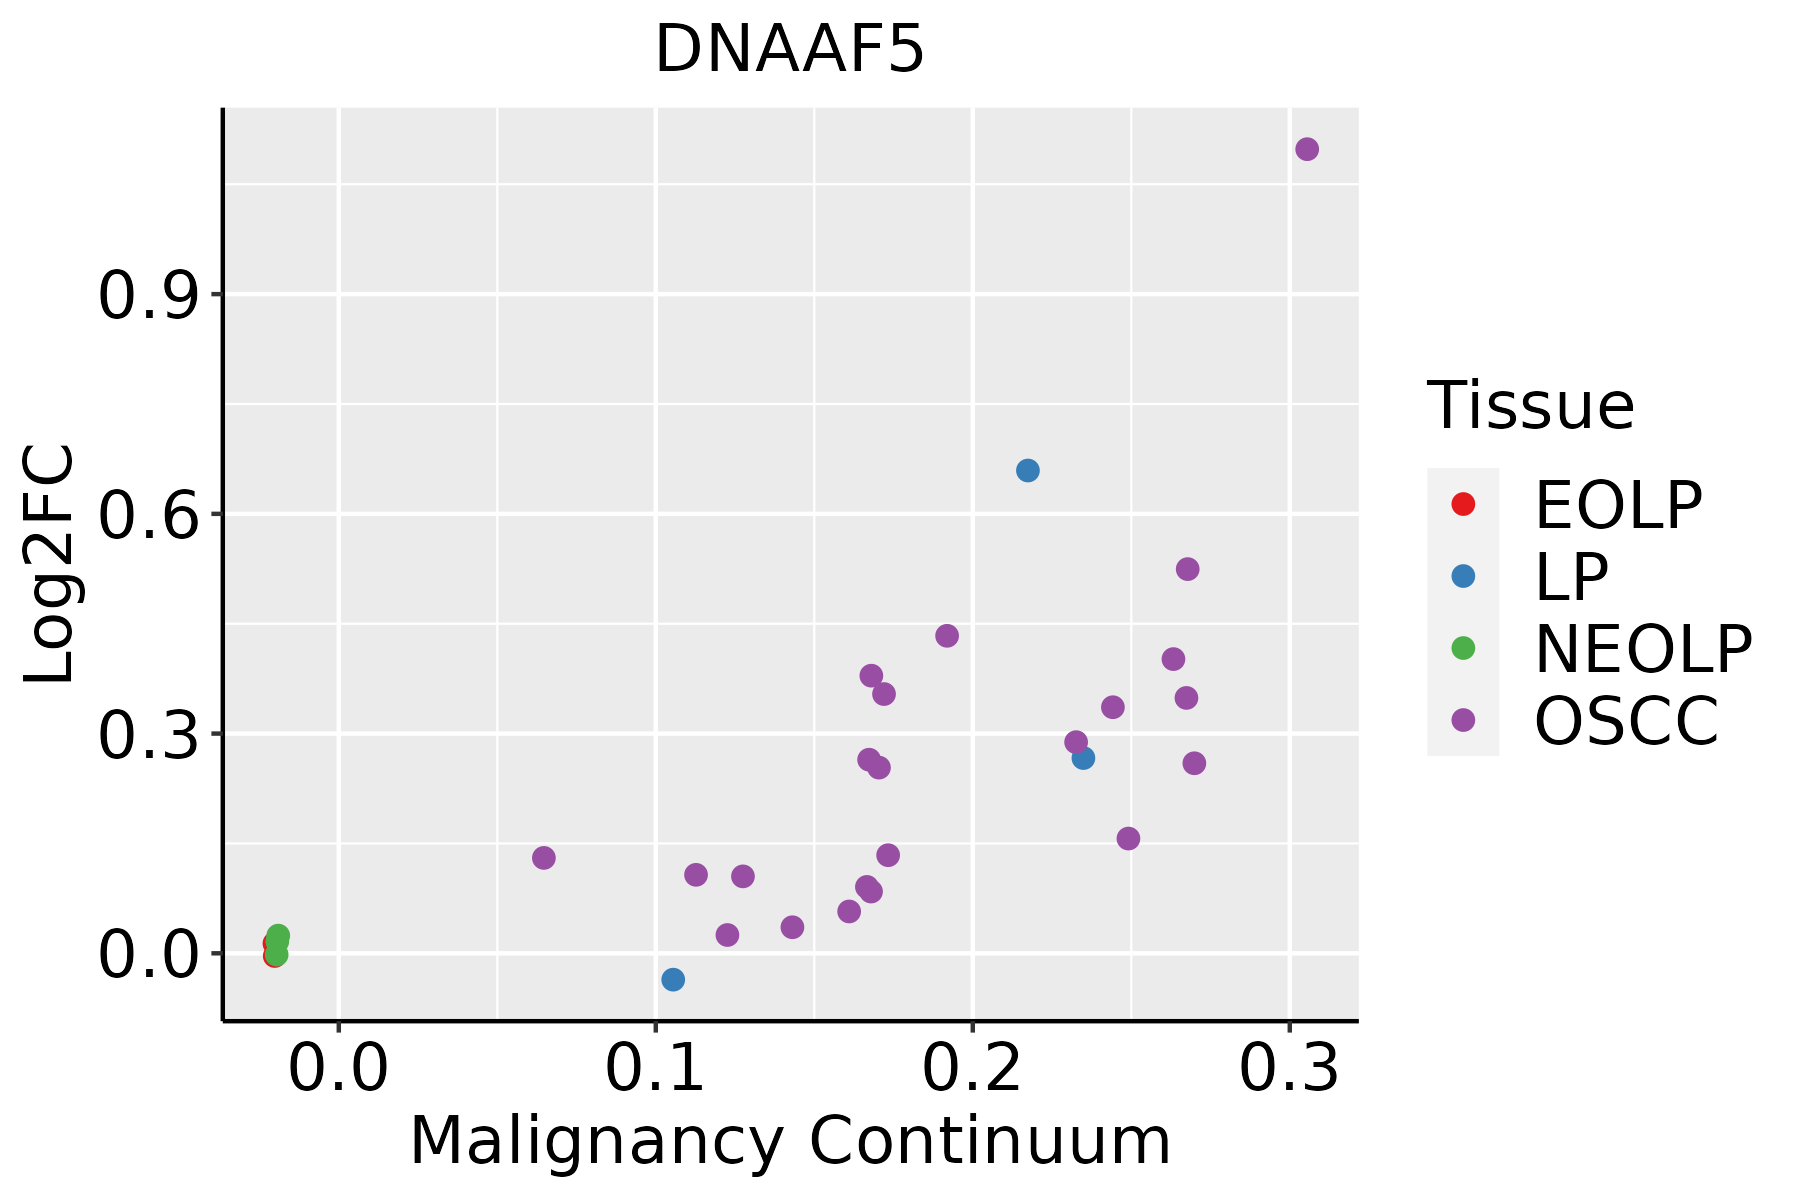 | EOLP: Erosive Oral lichen planus |
| LP: leukoplakia | ||
| NEOLP: Non-erosive oral lichen planus | ||
| OSCC: Oral squamous cell carcinoma |
| ∗log2FC in expression of this searched gene in stem-like cells from each diseased tissue sample relative to stem-like cells in normal samples in each tissue plotted against the malignancy continuum. Samples are colored based on if they are from different disease stage. |
Top |
Malignant transformation related pathway analysis |
| Find out the enriched GO biological processes and KEGG pathways involved in transition from healthy to precancer to cancer |
| Tissue | Disease Stage | Enriched GO biological Processes |
| Colorectum | AD |  |
| Colorectum | SER |  |
| Colorectum | MSS |  |
| Colorectum | MSI-H |  |
| Colorectum | FAP |  |
| ∗Top 15 enriched GO BP terms are showed in the bar plot of each disease state in each tissue. Each row represents a significant GO biological process which is colored according to the -log10(p.adjust). |
| Page: 1 2 3 4 5 6 7 8 9 |
| GO ID | Tissue | Disease Stage | Description | Gene Ratio | Bg Ratio | pvalue | p.adjust | Count |
| Page: 1 |
| Pathway ID | Tissue | Disease Stage | Description | Gene Ratio | Bg Ratio | pvalue | p.adjust | qvalue | Count |
| Page: 1 |
Top |
Cell-cell communication analysis |
| Identification of potential cell-cell interactions between two cell types and their ligand-receptor pairs for different disease states |
| Ligand | Receptor | LRpair | Pathway | Tissue | Disease Stage |
| Page: 1 |
Top |
Single-cell gene regulatory network inference analysis |
| Find out the significant the regulons (TFs) and the target genes of each regulon across cell types for different disease states |
| TF | Cell Type | Tissue | Disease Stage | Target Gene | RSS | Regulon Activity |
| ∗The dot plots of a searched regulon are shown for all cell subpopulations in each disease state of each tissue based on the regulon specific score inferred using pySCENIC and by calculating the average expression. |
| Page: 1 |
Top |
Somatic mutation of malignant transformation related genes |
| Annotation of somatic variants for genes involved in malignant transformation |
| Hugo Symbol | Variant Class | Variant Classification | dbSNP RS | HGVSc | HGVSp | HGVSp Short | SWISSPROT | BIOTYPE | SIFT | PolyPhen | Tumor Sample Barcode | Tissue | Histology | Sex | Age | Stage | Therapy Types | Drugs | Outcome |
| DNAAF5 | SNV | Missense_Mutation | novel | c.2419N>A | p.Asp807Asn | p.D807N | Q86Y56 | protein_coding | tolerated(0.24) | benign(0.038) | TCGA-5L-AAT0-01 | Breast | breast invasive carcinoma | Female | <65 | I/II | Hormone Therapy | tamoxiphen | SD |
| DNAAF5 | SNV | Missense_Mutation | novel | c.898N>C | p.Glu300Gln | p.E300Q | Q86Y56 | protein_coding | deleterious(0) | probably_damaging(0.976) | TCGA-A2-A0YH-01 | Breast | breast invasive carcinoma | Female | <65 | III/IV | Chemotherapy | adriamycin | SD |
| DNAAF5 | SNV | Missense_Mutation | novel | c.949C>A | p.Gln317Lys | p.Q317K | Q86Y56 | protein_coding | deleterious(0.01) | benign(0.214) | TCGA-BH-A0C0-01 | Breast | breast invasive carcinoma | Female | <65 | I/II | Chemotherapy | carboplatin | SD |
| DNAAF5 | SNV | Missense_Mutation | rs773744343 | c.1507N>T | p.Ala503Ser | p.A503S | Q86Y56 | protein_coding | tolerated(0.21) | benign(0.009) | TCGA-C8-A26X-01 | Breast | breast invasive carcinoma | Female | <65 | I/II | Chemotherapy | 5-fluorouracil | CR |
| DNAAF5 | SNV | Missense_Mutation | c.2311C>G | p.Leu771Val | p.L771V | Q86Y56 | protein_coding | deleterious(0.01) | possibly_damaging(0.902) | TCGA-EW-A1IZ-01 | Breast | breast invasive carcinoma | Female | <65 | III/IV | Chemotherapy | taxotere | SD | |
| DNAAF5 | SNV | Missense_Mutation | c.2417N>C | p.Gln806Pro | p.Q806P | Q86Y56 | protein_coding | deleterious(0) | probably_damaging(0.98) | TCGA-CK-4951-01 | Colorectum | colon adenocarcinoma | Female | >=65 | I/II | Unknown | Unknown | PD | |
| DNAAF5 | SNV | Missense_Mutation | c.2366A>G | p.Tyr789Cys | p.Y789C | Q86Y56 | protein_coding | tolerated(0.11) | possibly_damaging(0.49) | TCGA-G4-6588-01 | Colorectum | colon adenocarcinoma | Female | <65 | I/II | Unknown | Unknown | SD | |
| DNAAF5 | SNV | Missense_Mutation | novel | c.2081N>G | p.Gln694Arg | p.Q694R | Q86Y56 | protein_coding | tolerated(0.11) | benign(0.218) | TCGA-AG-3584-01 | Colorectum | rectum adenocarcinoma | Male | <65 | III/IV | Chemotherapy | folinic | PD |
| DNAAF5 | SNV | Missense_Mutation | rs534027051 | c.1714G>A | p.Ala572Thr | p.A572T | Q86Y56 | protein_coding | tolerated(0.32) | benign(0.127) | TCGA-A5-A0G2-01 | Endometrium | uterine corpus endometrioid carcinoma | Female | <65 | III/IV | Unknown | Unknown | SD |
| DNAAF5 | SNV | Missense_Mutation | rs749838774 | c.829N>T | p.Arg277Cys | p.R277C | Q86Y56 | protein_coding | deleterious(0) | possibly_damaging(0.891) | TCGA-AP-A1DV-01 | Endometrium | uterine corpus endometrioid carcinoma | Female | <65 | I/II | Unknown | Unknown | SD |
| Page: 1 2 3 4 5 |
Top |
Related drugs of malignant transformation related genes |
| Identification of chemicals and drugs interact with genes involved in malignant transfromation |
| (DGIdb 4.0) |
| Entrez ID | Symbol | Category | Interaction Types | Drug Claim Name | Drug Name | PMIDs |
| Page: 1 |

Copyright 2023-Present -The University of Texas Health Science Center at Houston |