
|
|||||
|
 | |
| |
| |
| |
| |
| |
|
Gene: DIS3 |
Gene summary for DIS3 |
| Gene information | Species | Human | Gene symbol | DIS3 | Gene ID | 22894 |
| Gene name | DIS3 homolog, exosome endoribonuclease and 3'-5' exoribonuclease | |
| Gene Alias | 2810028N01Rik | |
| Cytomap | 13q21.33 | |
| Gene Type | protein-coding | GO ID | GO:0000288 | UniProtAcc | Q9Y2L1 |
Top |
Malignant transformation analysis |
| Identification of the aberrant gene expression in precancerous and cancerous lesions by comparing the gene expression of stem-like cells in diseased tissues with normal stem cells |
| Entrez ID | Symbol | Replicates | Species | Organ | Tissue | Adj P-value | Log2FC | Malignancy |
| 22894 | DIS3 | P16T-E | Human | Esophagus | ESCC | 2.56e-13 | 2.35e-01 | 0.1153 |
| 22894 | DIS3 | P17T-E | Human | Esophagus | ESCC | 1.31e-05 | 1.28e-01 | 0.1278 |
| 22894 | DIS3 | P19T-E | Human | Esophagus | ESCC | 9.43e-06 | 6.61e-02 | 0.1662 |
| 22894 | DIS3 | P20T-E | Human | Esophagus | ESCC | 6.54e-12 | 3.16e-01 | 0.1124 |
| 22894 | DIS3 | P21T-E | Human | Esophagus | ESCC | 2.20e-20 | 2.19e-01 | 0.1617 |
| 22894 | DIS3 | P22T-E | Human | Esophagus | ESCC | 7.98e-07 | -1.04e-02 | 0.1236 |
| 22894 | DIS3 | P23T-E | Human | Esophagus | ESCC | 3.87e-15 | 2.21e-01 | 0.108 |
| 22894 | DIS3 | P24T-E | Human | Esophagus | ESCC | 5.26e-15 | 2.28e-02 | 0.1287 |
| 22894 | DIS3 | P26T-E | Human | Esophagus | ESCC | 1.47e-17 | 3.48e-01 | 0.1276 |
| 22894 | DIS3 | P27T-E | Human | Esophagus | ESCC | 6.56e-10 | 8.76e-02 | 0.1055 |
| 22894 | DIS3 | P28T-E | Human | Esophagus | ESCC | 6.97e-03 | -3.77e-02 | 0.1149 |
| 22894 | DIS3 | P30T-E | Human | Esophagus | ESCC | 3.73e-14 | 5.57e-01 | 0.137 |
| 22894 | DIS3 | P31T-E | Human | Esophagus | ESCC | 4.68e-27 | 4.81e-01 | 0.1251 |
| 22894 | DIS3 | P32T-E | Human | Esophagus | ESCC | 2.19e-11 | 2.29e-01 | 0.1666 |
| 22894 | DIS3 | P36T-E | Human | Esophagus | ESCC | 1.28e-15 | 3.27e-01 | 0.1187 |
| 22894 | DIS3 | P37T-E | Human | Esophagus | ESCC | 1.68e-19 | 4.02e-02 | 0.1371 |
| 22894 | DIS3 | P39T-E | Human | Esophagus | ESCC | 3.38e-09 | 1.04e-01 | 0.0894 |
| 22894 | DIS3 | P40T-E | Human | Esophagus | ESCC | 5.14e-03 | 1.01e-01 | 0.109 |
| 22894 | DIS3 | P42T-E | Human | Esophagus | ESCC | 2.42e-08 | 1.56e-01 | 0.1175 |
| 22894 | DIS3 | P44T-E | Human | Esophagus | ESCC | 2.81e-18 | 1.50e-01 | 0.1096 |
| Page: 1 2 3 4 5 6 |
| Tissue | Expression Dynamics | Abbreviation |
| Esophagus | 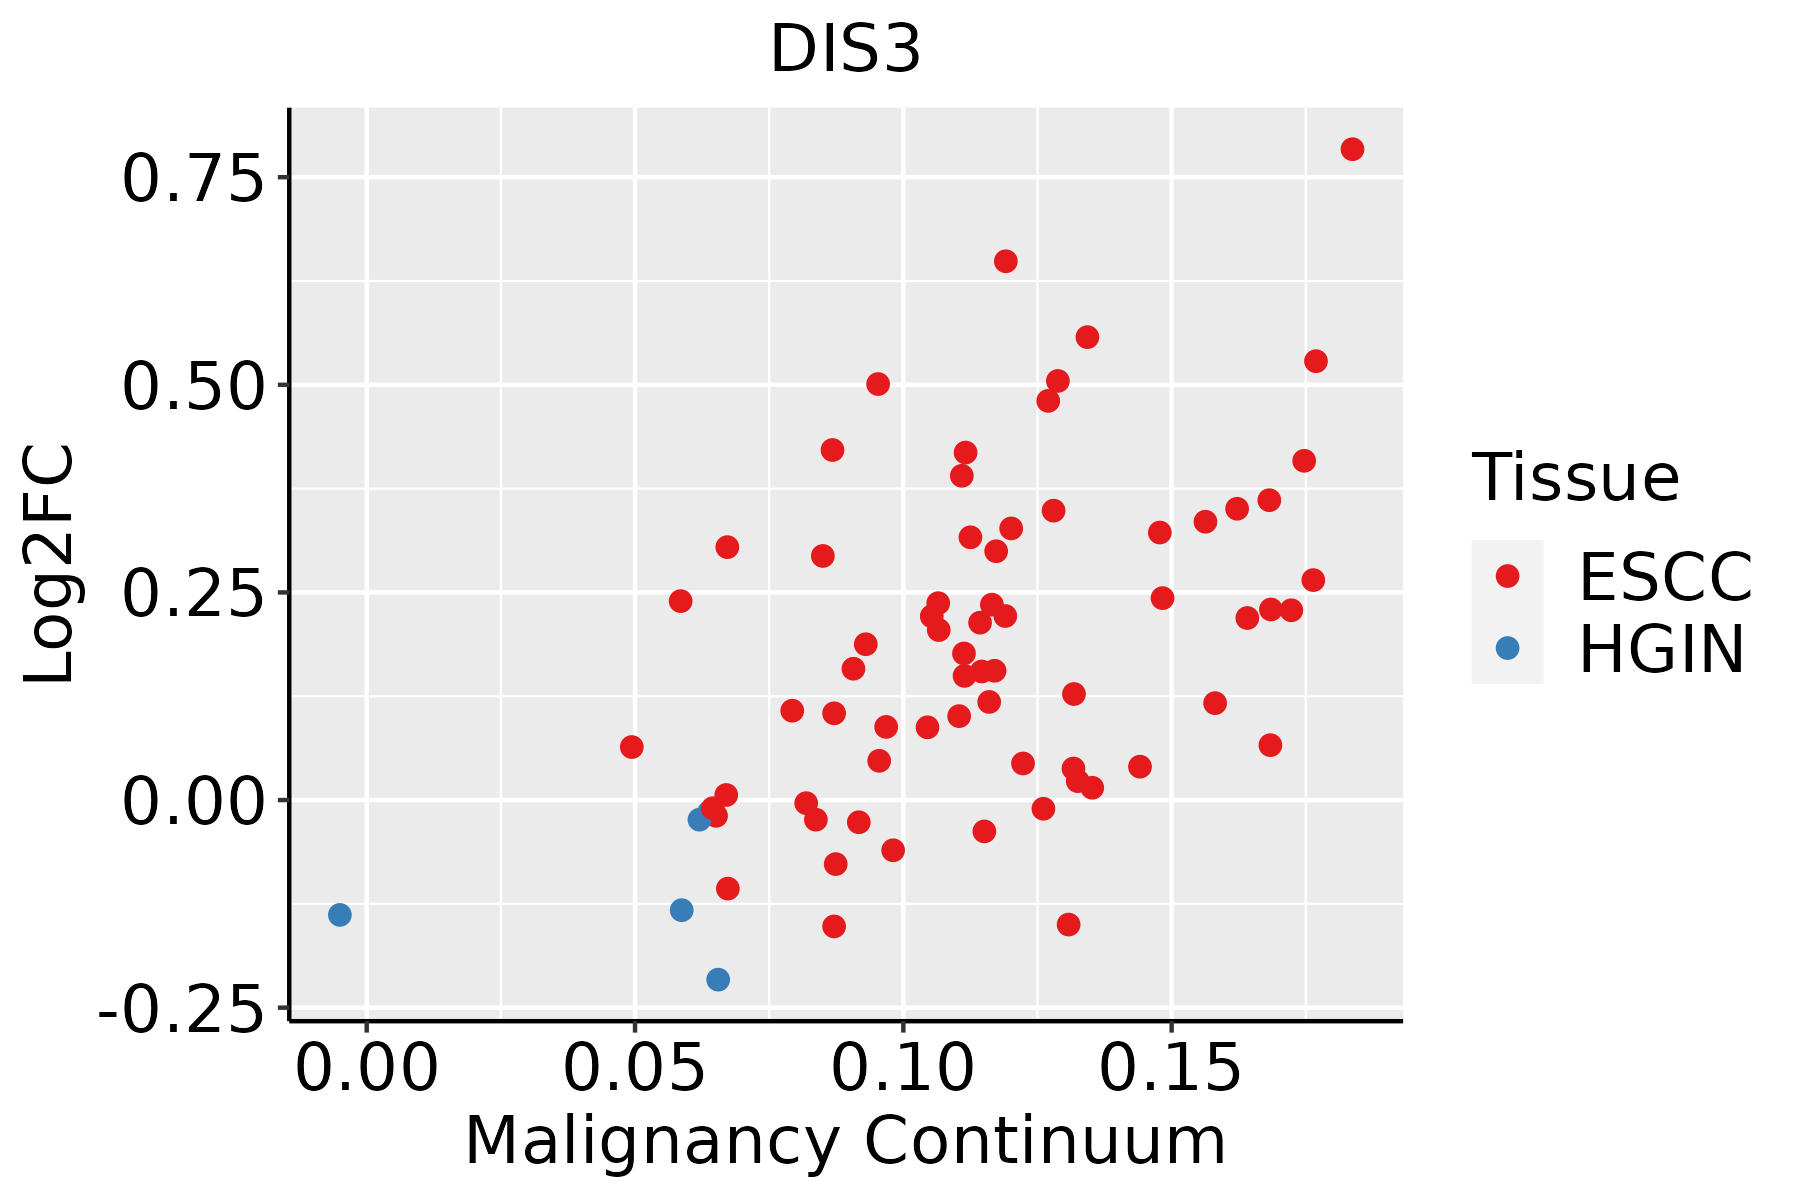 | ESCC: Esophageal squamous cell carcinoma |
| HGIN: High-grade intraepithelial neoplasias | ||
| LGIN: Low-grade intraepithelial neoplasias | ||
| Liver | 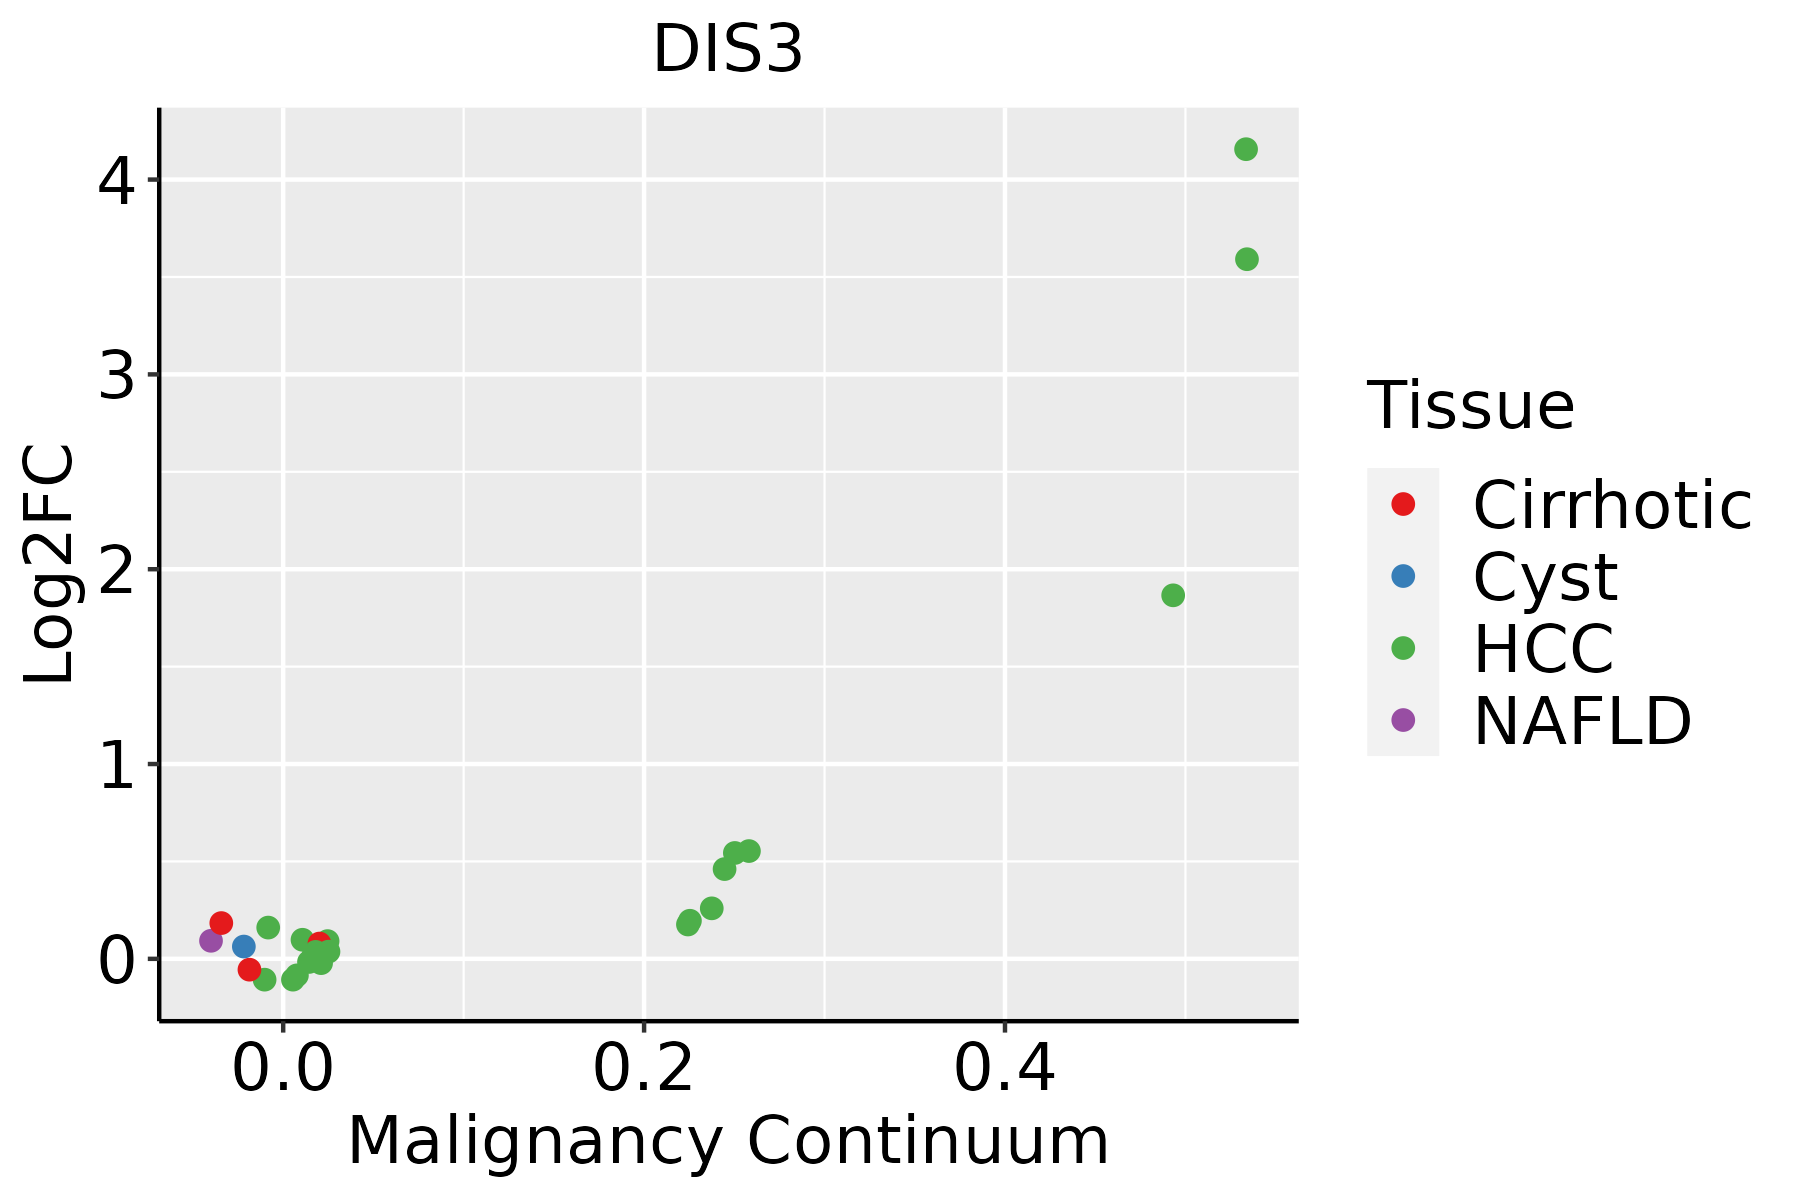 | HCC: Hepatocellular carcinoma |
| NAFLD: Non-alcoholic fatty liver disease | ||
| Oral Cavity |  | EOLP: Erosive Oral lichen planus |
| LP: leukoplakia | ||
| NEOLP: Non-erosive oral lichen planus | ||
| OSCC: Oral squamous cell carcinoma | ||
| Skin |  | AK: Actinic keratosis |
| cSCC: Cutaneous squamous cell carcinoma | ||
| SCCIS:squamous cell carcinoma in situ | ||
| Thyroid | 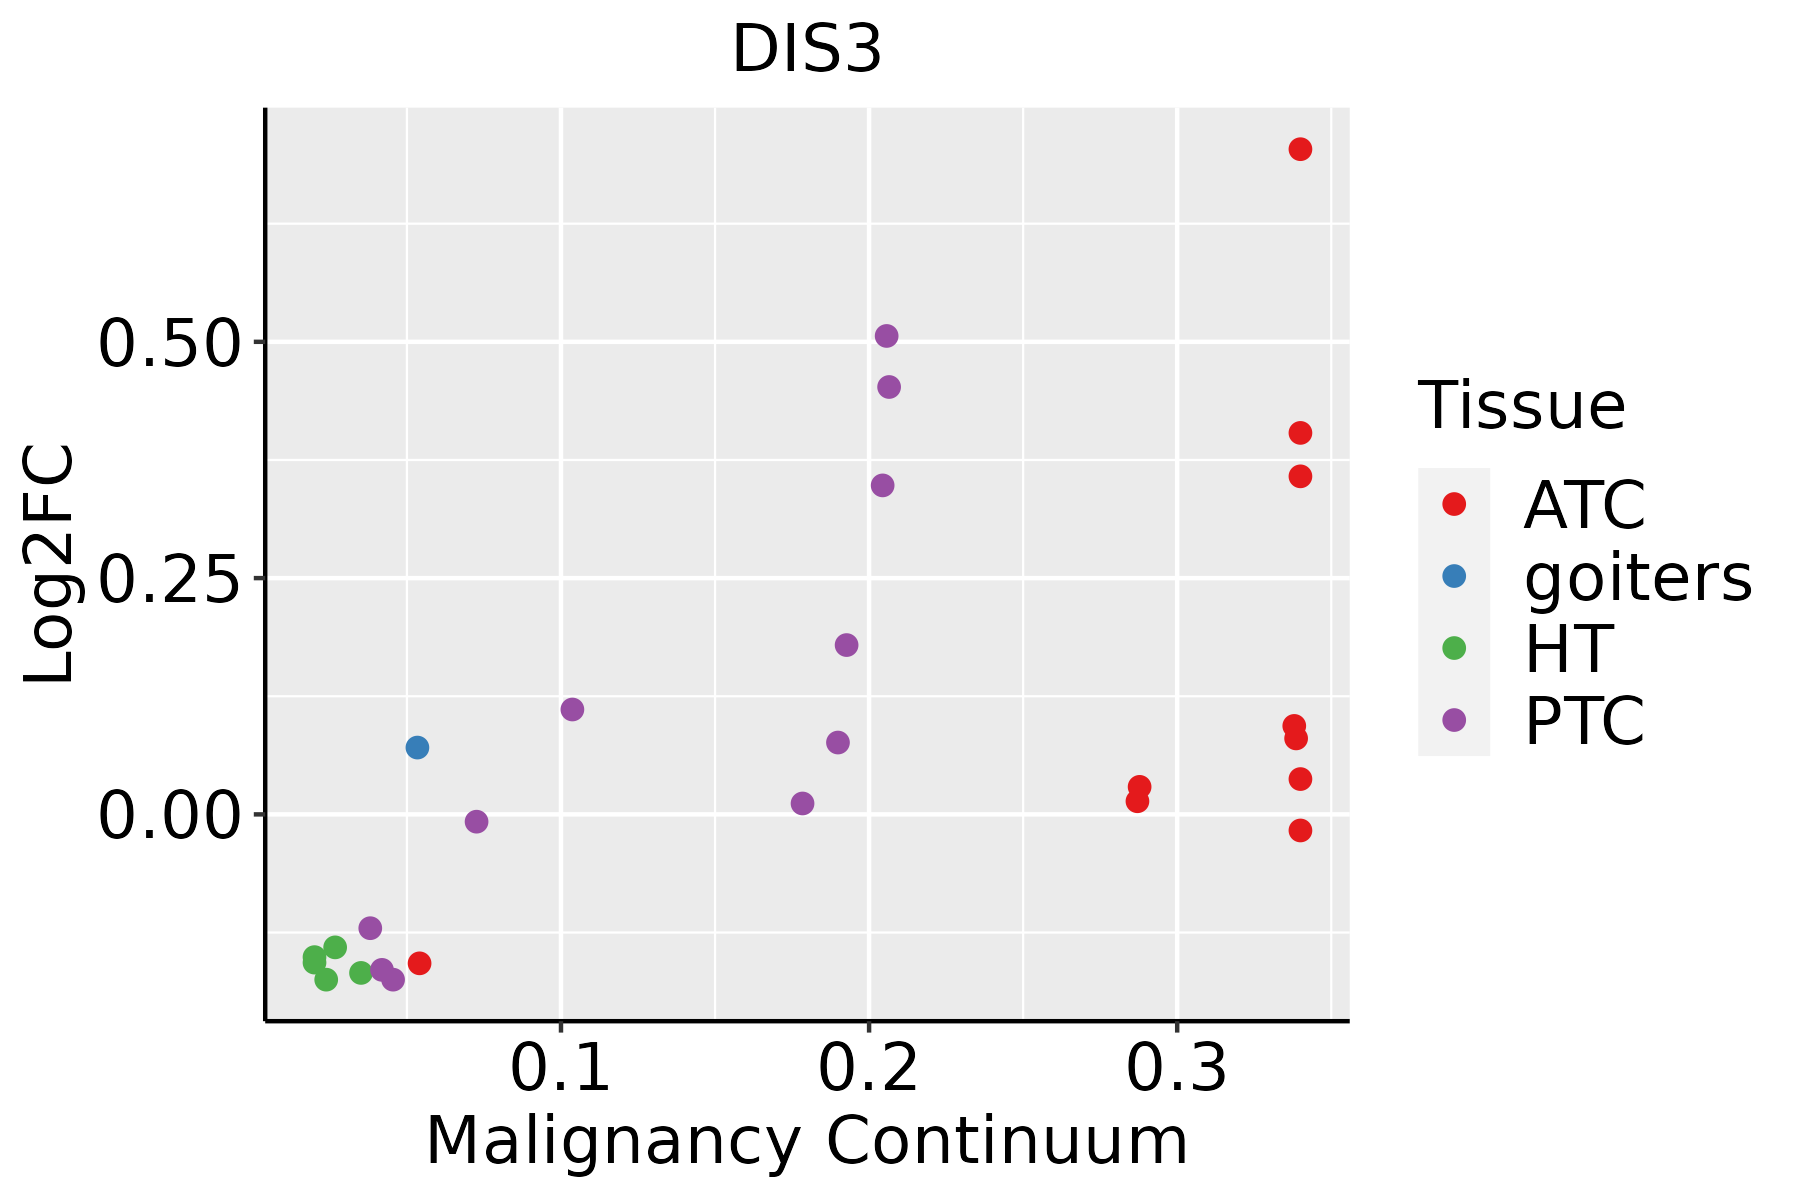 | ATC: Anaplastic thyroid cancer |
| HT: Hashimoto's thyroiditis | ||
| PTC: Papillary thyroid cancer |
| ∗log2FC in expression of this searched gene in stem-like cells from each diseased tissue sample relative to stem-like cells in normal samples in each tissue plotted against the malignancy continuum. Samples are colored based on if they are from different disease stage. |
Top |
Malignant transformation related pathway analysis |
| Find out the enriched GO biological processes and KEGG pathways involved in transition from healthy to precancer to cancer |
| Tissue | Disease Stage | Enriched GO biological Processes |
| Colorectum | AD |  |
| Colorectum | SER |  |
| Colorectum | MSS |  |
| Colorectum | MSI-H |  |
| Colorectum | FAP |  |
| ∗Top 15 enriched GO BP terms are showed in the bar plot of each disease state in each tissue. Each row represents a significant GO biological process which is colored according to the -log10(p.adjust). |
| Page: 1 2 3 4 5 6 7 8 9 |
| GO ID | Tissue | Disease Stage | Description | Gene Ratio | Bg Ratio | pvalue | p.adjust | Count |
| GO:0009896 | Colorectum | AD | positive regulation of catabolic process | 180/3918 | 492/18723 | 4.33e-16 | 1.94e-13 | 180 |
| GO:1903311 | Colorectum | AD | regulation of mRNA metabolic process | 117/3918 | 288/18723 | 1.69e-14 | 4.23e-12 | 117 |
| GO:0031331 | Colorectum | AD | positive regulation of cellular catabolic process | 156/3918 | 427/18723 | 4.68e-14 | 1.05e-11 | 156 |
| GO:0006401 | Colorectum | AD | RNA catabolic process | 102/3918 | 278/18723 | 8.64e-10 | 6.76e-08 | 102 |
| GO:0044270 | Colorectum | AD | cellular nitrogen compound catabolic process | 147/3918 | 451/18723 | 3.35e-09 | 2.23e-07 | 147 |
| GO:0046700 | Colorectum | AD | heterocycle catabolic process | 145/3918 | 445/18723 | 4.37e-09 | 2.84e-07 | 145 |
| GO:0006402 | Colorectum | AD | mRNA catabolic process | 87/3918 | 232/18723 | 4.40e-09 | 2.84e-07 | 87 |
| GO:0034655 | Colorectum | AD | nucleobase-containing compound catabolic process | 133/3918 | 407/18723 | 1.56e-08 | 9.12e-07 | 133 |
| GO:0019439 | Colorectum | AD | aromatic compound catabolic process | 146/3918 | 467/18723 | 7.48e-08 | 3.84e-06 | 146 |
| GO:1901361 | Colorectum | AD | organic cyclic compound catabolic process | 153/3918 | 495/18723 | 8.23e-08 | 4.18e-06 | 153 |
| GO:0061013 | Colorectum | AD | regulation of mRNA catabolic process | 64/3918 | 166/18723 | 1.44e-07 | 6.59e-06 | 64 |
| GO:0043487 | Colorectum | AD | regulation of RNA stability | 63/3918 | 170/18723 | 9.17e-07 | 3.12e-05 | 63 |
| GO:0006417 | Colorectum | AD | regulation of translation | 141/3918 | 468/18723 | 1.32e-06 | 4.22e-05 | 141 |
| GO:0043488 | Colorectum | AD | regulation of mRNA stability | 59/3918 | 158/18723 | 1.50e-06 | 4.66e-05 | 59 |
| GO:1903313 | Colorectum | AD | positive regulation of mRNA metabolic process | 44/3918 | 118/18723 | 3.20e-05 | 5.87e-04 | 44 |
| GO:0000956 | Colorectum | AD | nuclear-transcribed mRNA catabolic process | 40/3918 | 112/18723 | 2.11e-04 | 2.79e-03 | 40 |
| GO:0061014 | Colorectum | AD | positive regulation of mRNA catabolic process | 32/3918 | 87/18723 | 4.81e-04 | 5.27e-03 | 32 |
| GO:0061157 | Colorectum | AD | mRNA destabilization | 30/3918 | 84/18723 | 1.24e-03 | 1.09e-02 | 30 |
| GO:0050779 | Colorectum | AD | RNA destabilization | 30/3918 | 88/18723 | 2.83e-03 | 2.12e-02 | 30 |
| GO:0140014 | Colorectum | AD | mitotic nuclear division | 78/3918 | 287/18723 | 6.48e-03 | 4.05e-02 | 78 |
| Page: 1 2 3 4 5 6 7 8 9 10 11 12 13 14 15 16 17 18 19 20 21 22 23 24 |
| Pathway ID | Tissue | Disease Stage | Description | Gene Ratio | Bg Ratio | pvalue | p.adjust | qvalue | Count |
| hsa0301810 | Esophagus | HGIN | RNA degradation | 27/1383 | 79/8465 | 7.73e-05 | 9.00e-04 | 7.15e-04 | 27 |
| hsa0301815 | Esophagus | HGIN | RNA degradation | 27/1383 | 79/8465 | 7.73e-05 | 9.00e-04 | 7.15e-04 | 27 |
| hsa0301824 | Esophagus | ESCC | RNA degradation | 62/4205 | 79/8465 | 1.18e-07 | 9.39e-07 | 4.81e-07 | 62 |
| hsa0301834 | Esophagus | ESCC | RNA degradation | 62/4205 | 79/8465 | 1.18e-07 | 9.39e-07 | 4.81e-07 | 62 |
| hsa030182 | Liver | HCC | RNA degradation | 58/4020 | 79/8465 | 2.29e-06 | 2.19e-05 | 1.22e-05 | 58 |
| hsa030183 | Liver | HCC | RNA degradation | 58/4020 | 79/8465 | 2.29e-06 | 2.19e-05 | 1.22e-05 | 58 |
| hsa030189 | Oral cavity | OSCC | RNA degradation | 59/3704 | 79/8465 | 2.05e-08 | 1.91e-07 | 9.70e-08 | 59 |
| hsa0301814 | Oral cavity | OSCC | RNA degradation | 59/3704 | 79/8465 | 2.05e-08 | 1.91e-07 | 9.70e-08 | 59 |
| Page: 1 |
Top |
Cell-cell communication analysis |
| Identification of potential cell-cell interactions between two cell types and their ligand-receptor pairs for different disease states |
| Ligand | Receptor | LRpair | Pathway | Tissue | Disease Stage |
| Page: 1 |
Top |
Single-cell gene regulatory network inference analysis |
| Find out the significant the regulons (TFs) and the target genes of each regulon across cell types for different disease states |
| TF | Cell Type | Tissue | Disease Stage | Target Gene | RSS | Regulon Activity |
| DIS3 | TFH | Endometrium | EEC | TFIP11,SNHG9,NBEAL1, etc. | 5.05e-02 |  |
| DIS3 | TH17 | Endometrium | EEC | TFIP11,SNHG9,NBEAL1, etc. | 3.02e-02 | |
| DIS3 | TREG | Lung | IAC | H1F0,VDR,FUT11, etc. | 2.01e-01 |  |
| DIS3 | MAIT | Lung | IAC | H1F0,VDR,FUT11, etc. | 4.77e-05 | |
| DIS3 | BMEM | Lung | IAC | H1F0,VDR,FUT11, etc. | 6.06e-05 | |
| DIS3 | MDSC | Lung | IAC | H1F0,VDR,FUT11, etc. | 9.15e-05 | |
| DIS3 | INFIB | Thyroid | ADJ | ZC3H11A,CHMP4C,MTCO2P12, etc. | 4.20e-01 |  |
| DIS3 | ICAF | Thyroid | goiters | ZC3H11A,CHMP4C,MTCO2P12, etc. | 2.22e-16 |  |
| DIS3 | MSC.MVA | Thyroid | Healthy | ZC3H11A,CHMP4C,MTCO2P12, etc. | 3.56e-02 |  |
| DIS3 | ICAF | Thyroid | Healthy | ZC3H11A,CHMP4C,MTCO2P12, etc. | 0.00e+00 | |
| ∗The dot plots of a searched regulon are shown for all cell subpopulations in each disease state of each tissue based on the regulon specific score inferred using pySCENIC and by calculating the average expression. |
| Page: 1 |
Top |
Somatic mutation of malignant transformation related genes |
| Annotation of somatic variants for genes involved in malignant transformation |
| Hugo Symbol | Variant Class | Variant Classification | dbSNP RS | HGVSc | HGVSp | HGVSp Short | SWISSPROT | BIOTYPE | SIFT | PolyPhen | Tumor Sample Barcode | Tissue | Histology | Sex | Age | Stage | Therapy Types | Drugs | Outcome |
| DIS3 | SNV | Missense_Mutation | c.2066N>A | p.Arg689Gln | p.R689Q | Q9Y2L1 | protein_coding | deleterious(0) | probably_damaging(0.976) | TCGA-AN-A046-01 | Breast | breast invasive carcinoma | Female | >=65 | I/II | Unknown | Unknown | SD | |
| DIS3 | SNV | Missense_Mutation | c.1001T>C | p.Val334Ala | p.V334A | Q9Y2L1 | protein_coding | tolerated(0.82) | benign(0) | TCGA-BH-A0DX-01 | Breast | breast invasive carcinoma | Female | <65 | I/II | Chemotherapy | taxotere | CR | |
| DIS3 | SNV | Missense_Mutation | rs760670933 | c.616G>A | p.Glu206Lys | p.E206K | Q9Y2L1 | protein_coding | tolerated(0.33) | benign(0.149) | TCGA-BH-A1F8-01 | Breast | breast invasive carcinoma | Female | >=65 | III/IV | Unknown | Unknown | PD |
| DIS3 | SNV | Missense_Mutation | c.1662N>G | p.Asp554Glu | p.D554E | Q9Y2L1 | protein_coding | tolerated(0.21) | benign(0.018) | TCGA-BH-A1FN-01 | Breast | breast invasive carcinoma | Female | <65 | I/II | Unknown | Unknown | PD | |
| DIS3 | insertion | Frame_Shift_Ins | novel | c.2032dupA | p.Ile678AsnfsTer3 | p.I678Nfs*3 | Q9Y2L1 | protein_coding | TCGA-AN-A0AK-01 | Breast | breast invasive carcinoma | Female | >=65 | I/II | Unknown | Unknown | SD | ||
| DIS3 | deletion | Frame_Shift_Del | novel | c.527delN | p.Asn176MetfsTer10 | p.N176Mfs*10 | Q9Y2L1 | protein_coding | TCGA-EW-A2FV-01 | Breast | breast invasive carcinoma | Female | <65 | III/IV | Chemotherapy | docetaxel | SD | ||
| DIS3 | SNV | Missense_Mutation | novel | c.2257T>C | p.Tyr753His | p.Y753H | Q9Y2L1 | protein_coding | deleterious(0) | probably_damaging(1) | TCGA-2W-A8YY-01 | Cervix | cervical & endocervical cancer | Female | <65 | I/II | Chemotherapy | cisplatin | CR |
| DIS3 | SNV | Missense_Mutation | rs757306363 | c.1831C>T | p.Arg611Cys | p.R611C | Q9Y2L1 | protein_coding | deleterious(0) | probably_damaging(1) | TCGA-2W-A8YY-01 | Cervix | cervical & endocervical cancer | Female | <65 | I/II | Chemotherapy | cisplatin | CR |
| DIS3 | SNV | Missense_Mutation | novel | c.2164N>A | p.Ala722Thr | p.A722T | Q9Y2L1 | protein_coding | deleterious(0) | probably_damaging(0.979) | TCGA-EA-A3HS-01 | Cervix | cervical & endocervical cancer | Female | <65 | I/II | Unknown | Unknown | SD |
| DIS3 | SNV | Missense_Mutation | c.2348C>T | p.Ala783Val | p.A783V | Q9Y2L1 | protein_coding | deleterious(0.01) | benign(0.247) | TCGA-AA-3819-01 | Colorectum | colon adenocarcinoma | Female | <65 | I/II | Unknown | Unknown | SD |
| Page: 1 2 3 4 5 6 7 8 9 10 |
Top |
Related drugs of malignant transformation related genes |
| Identification of chemicals and drugs interact with genes involved in malignant transfromation |
| (DGIdb 4.0) |
| Entrez ID | Symbol | Category | Interaction Types | Drug Claim Name | Drug Name | PMIDs |
| Page: 1 |

Copyright 2023-Present -The University of Texas Health Science Center at Houston |