
|
|||||
|
 | |
| |
| |
| |
| |
| |
|
Gene: DHRS3 |
Gene summary for DHRS3 |
| Gene information | Species | Human | Gene symbol | DHRS3 | Gene ID | 9249 |
| Gene name | dehydrogenase/reductase 3 | |
| Gene Alias | DD83.1 | |
| Cytomap | 1p36.21 | |
| Gene Type | protein-coding | GO ID | GO:0001501 | UniProtAcc | O75911 |
Top |
Malignant transformation analysis |
| Identification of the aberrant gene expression in precancerous and cancerous lesions by comparing the gene expression of stem-like cells in diseased tissues with normal stem cells |
| Entrez ID | Symbol | Replicates | Species | Organ | Tissue | Adj P-value | Log2FC | Malignancy |
| 9249 | DHRS3 | HTA11_2112_2000001011 | Human | Colorectum | SER | 2.91e-02 | 7.43e-01 | -0.2196 |
| 9249 | DHRS3 | HTA11_696_2000001011 | Human | Colorectum | AD | 1.53e-14 | 5.29e-01 | -0.1464 |
| 9249 | DHRS3 | HTA11_866_2000001011 | Human | Colorectum | AD | 5.01e-09 | 5.10e-01 | -0.1001 |
| 9249 | DHRS3 | HTA11_7696_3000711011 | Human | Colorectum | AD | 2.35e-11 | 5.48e-01 | 0.0674 |
| 9249 | DHRS3 | A015-C-203 | Human | Colorectum | FAP | 8.17e-04 | 3.62e-02 | -0.1294 |
| 9249 | DHRS3 | A002-C-205 | Human | Colorectum | FAP | 1.17e-05 | -4.88e-02 | -0.1236 |
| 9249 | DHRS3 | A015-C-006 | Human | Colorectum | FAP | 1.16e-02 | -1.30e-01 | -0.0994 |
| 9249 | DHRS3 | A002-C-114 | Human | Colorectum | FAP | 1.06e-04 | 3.47e-02 | -0.1561 |
| 9249 | DHRS3 | A015-C-104 | Human | Colorectum | FAP | 8.10e-06 | 8.37e-02 | -0.1899 |
| 9249 | DHRS3 | A015-C-002 | Human | Colorectum | FAP | 4.27e-02 | -1.42e-01 | -0.0763 |
| 9249 | DHRS3 | A002-C-116 | Human | Colorectum | FAP | 7.40e-05 | -7.17e-02 | -0.0452 |
| 9249 | DHRS3 | A014-C-008 | Human | Colorectum | FAP | 1.36e-02 | -7.42e-04 | -0.191 |
| 9249 | DHRS3 | A018-E-020 | Human | Colorectum | FAP | 1.39e-04 | -8.26e-02 | -0.2034 |
| 9249 | DHRS3 | LZE2D | Human | Esophagus | HGIN | 5.70e-04 | 1.86e-01 | 0.0642 |
| 9249 | DHRS3 | LZE4T | Human | Esophagus | ESCC | 1.71e-11 | -1.86e-01 | 0.0811 |
| 9249 | DHRS3 | LZE5T | Human | Esophagus | ESCC | 1.19e-04 | 1.05e+00 | 0.0514 |
| 9249 | DHRS3 | LZE7T | Human | Esophagus | ESCC | 7.16e-04 | 4.72e-02 | 0.0667 |
| 9249 | DHRS3 | LZE8T | Human | Esophagus | ESCC | 1.13e-17 | 1.04e+00 | 0.067 |
| 9249 | DHRS3 | LZE20T | Human | Esophagus | ESCC | 2.22e-08 | 7.77e-01 | 0.0662 |
| 9249 | DHRS3 | LZE22D1 | Human | Esophagus | HGIN | 2.33e-03 | 3.55e-01 | 0.0595 |
| Page: 1 2 3 4 5 6 7 8 9 |
| Tissue | Expression Dynamics | Abbreviation |
| Breast | 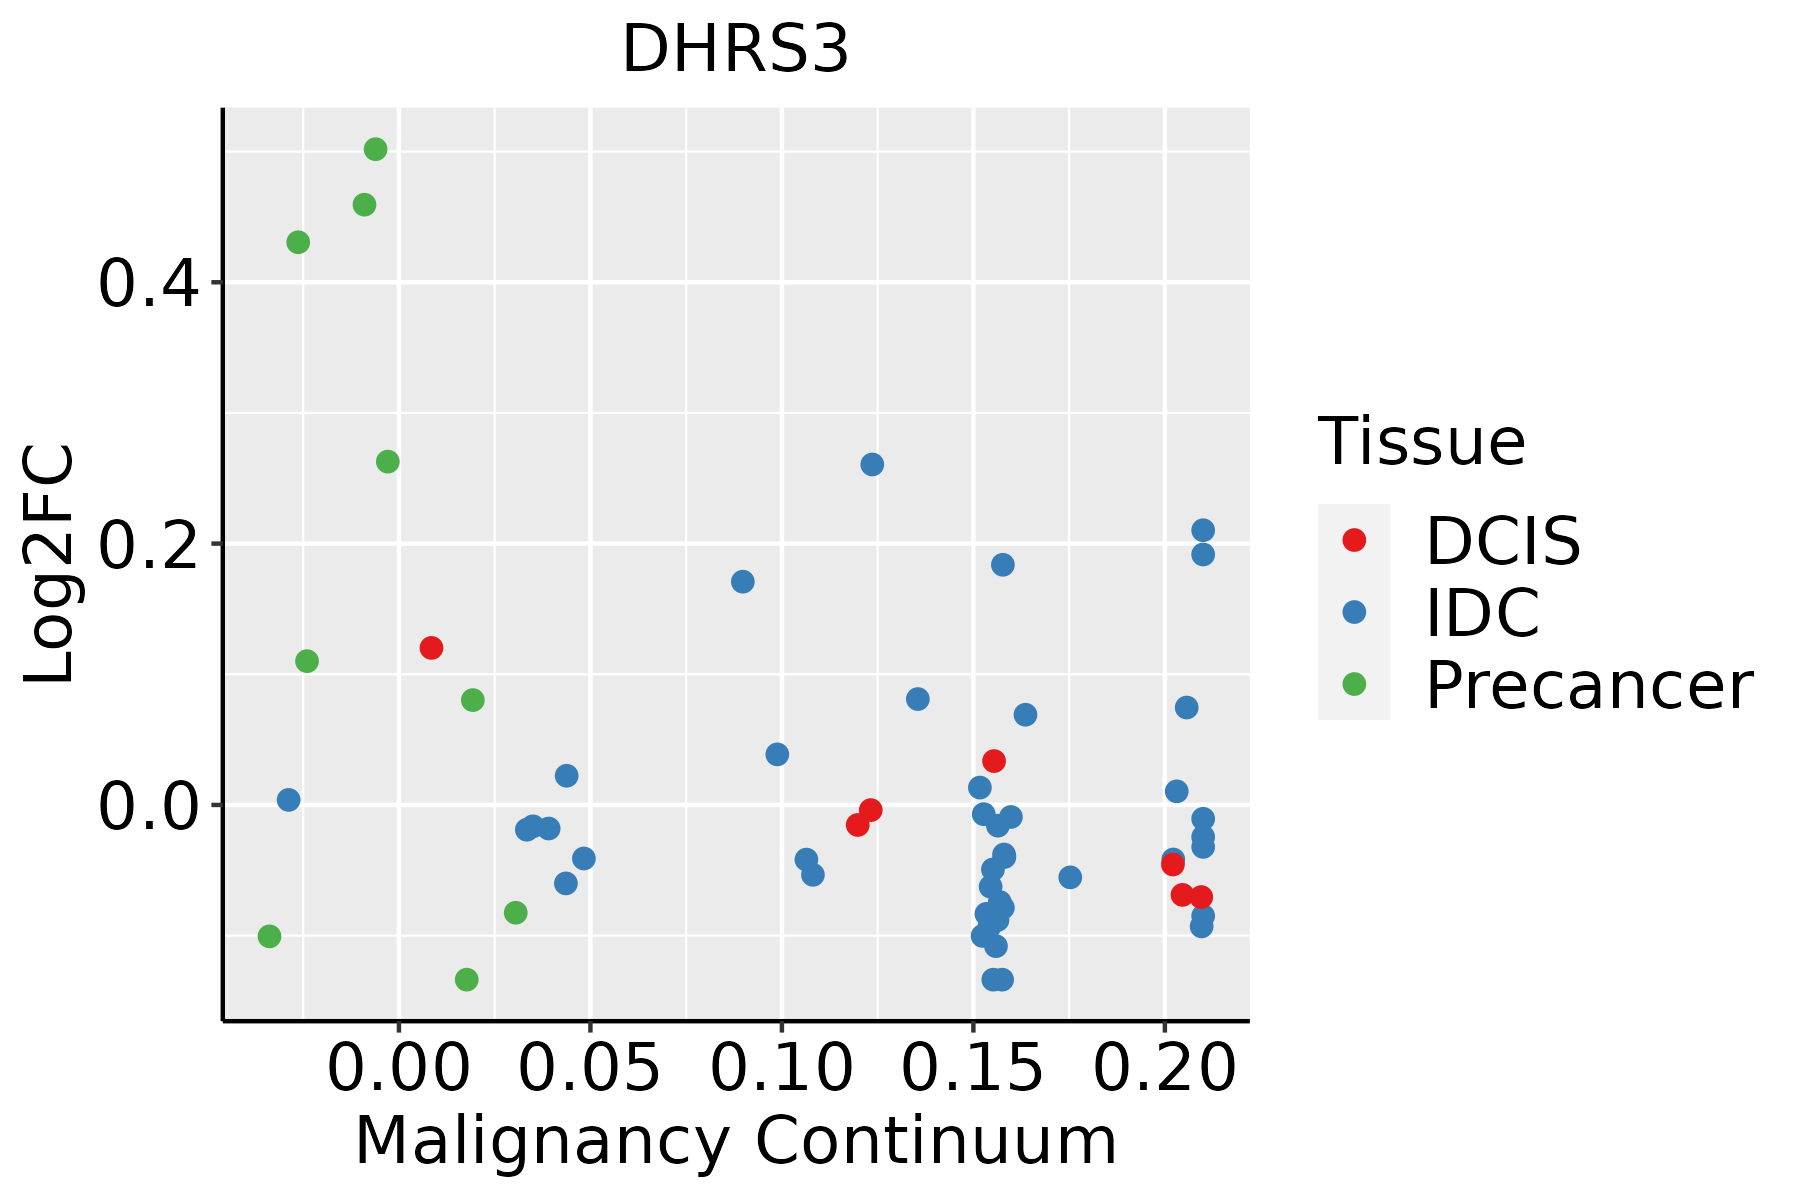 | IDC: Invasive ductal carcinoma |
| DCIS: Ductal carcinoma in situ | ||
| Precancer(BRCA1-mut): Precancerous lesion from BRCA1 mutation carriers | ||
| Cervix | 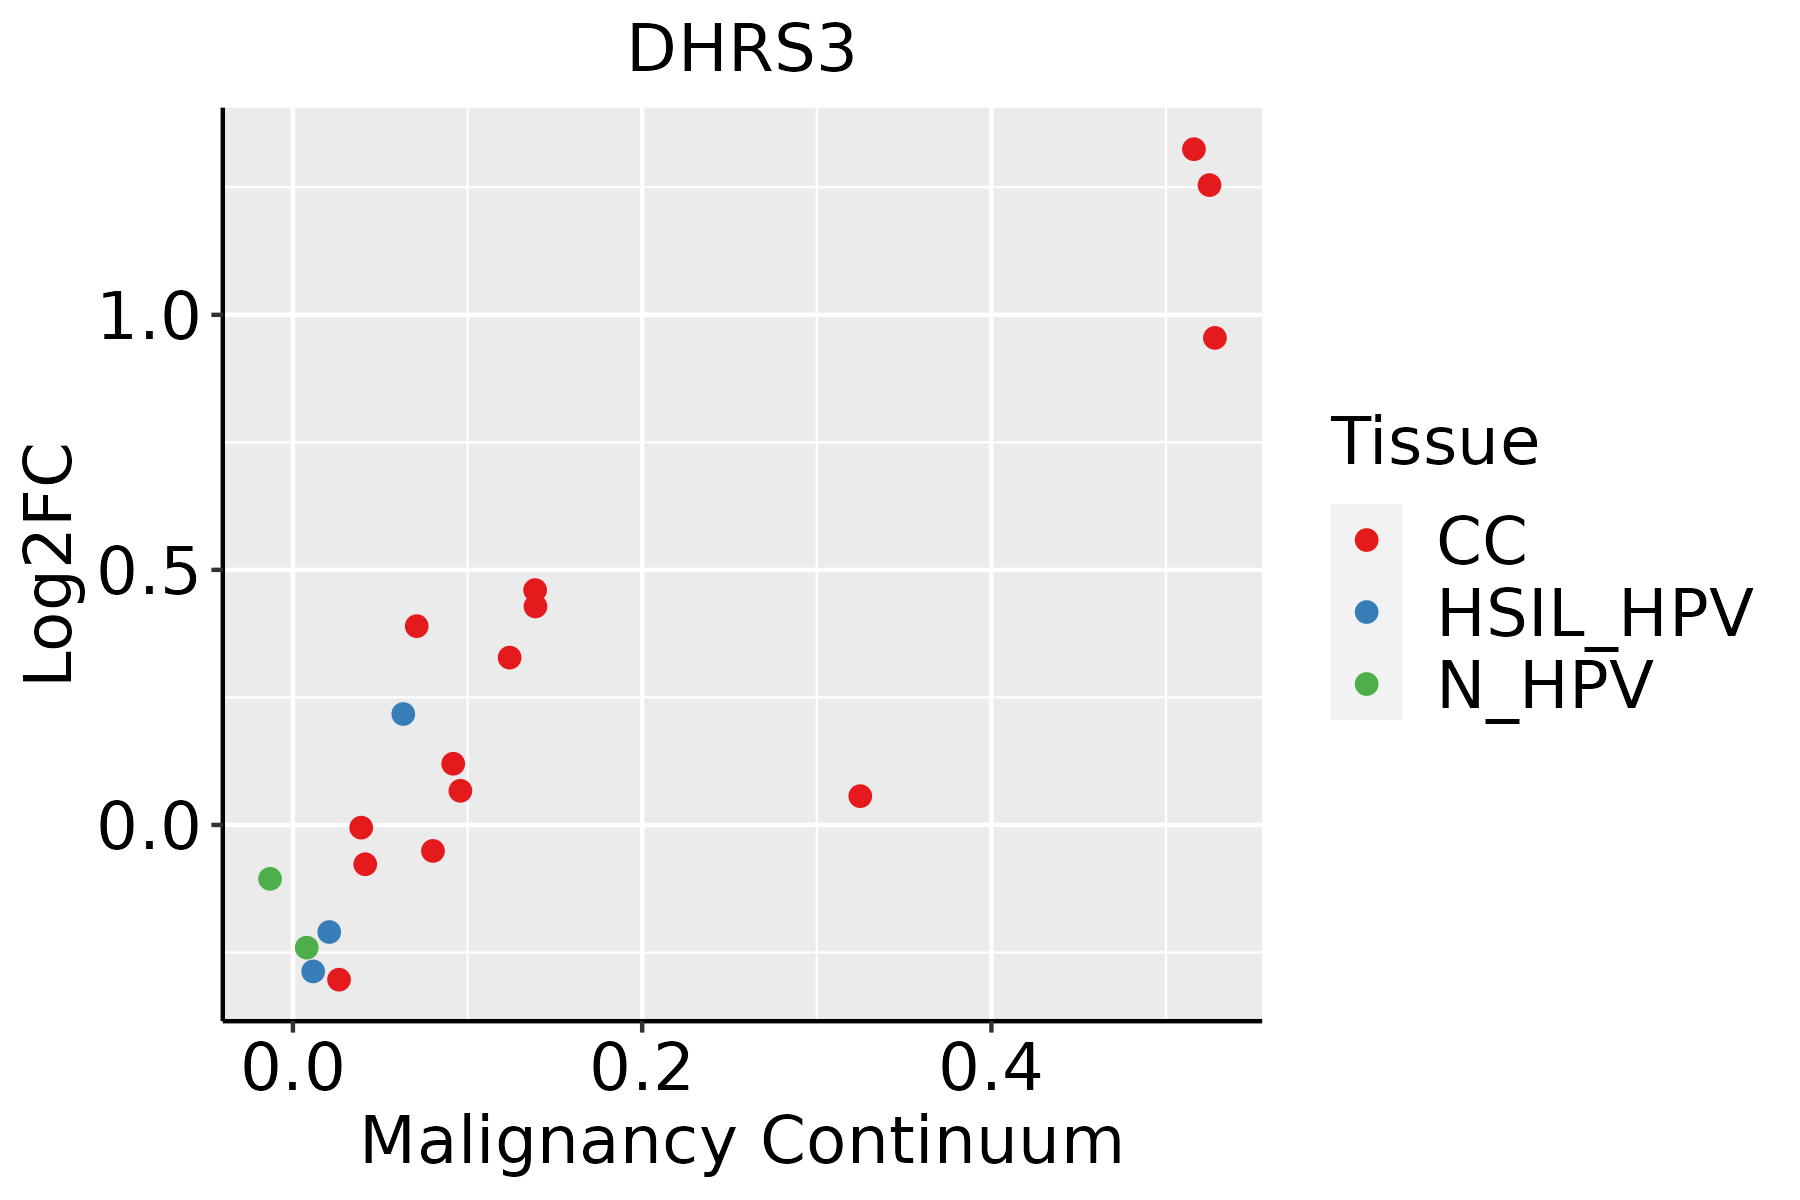 | CC: Cervix cancer |
| HSIL_HPV: HPV-infected high-grade squamous intraepithelial lesions | ||
| N_HPV: HPV-infected normal cervix | ||
| Colorectum (GSE201348) |  | FAP: Familial adenomatous polyposis |
| CRC: Colorectal cancer | ||
| Colorectum (HTA11) |  | AD: Adenomas |
| SER: Sessile serrated lesions | ||
| MSI-H: Microsatellite-high colorectal cancer | ||
| MSS: Microsatellite stable colorectal cancer | ||
| Esophagus |  | ESCC: Esophageal squamous cell carcinoma |
| HGIN: High-grade intraepithelial neoplasias | ||
| LGIN: Low-grade intraepithelial neoplasias | ||
| Liver | 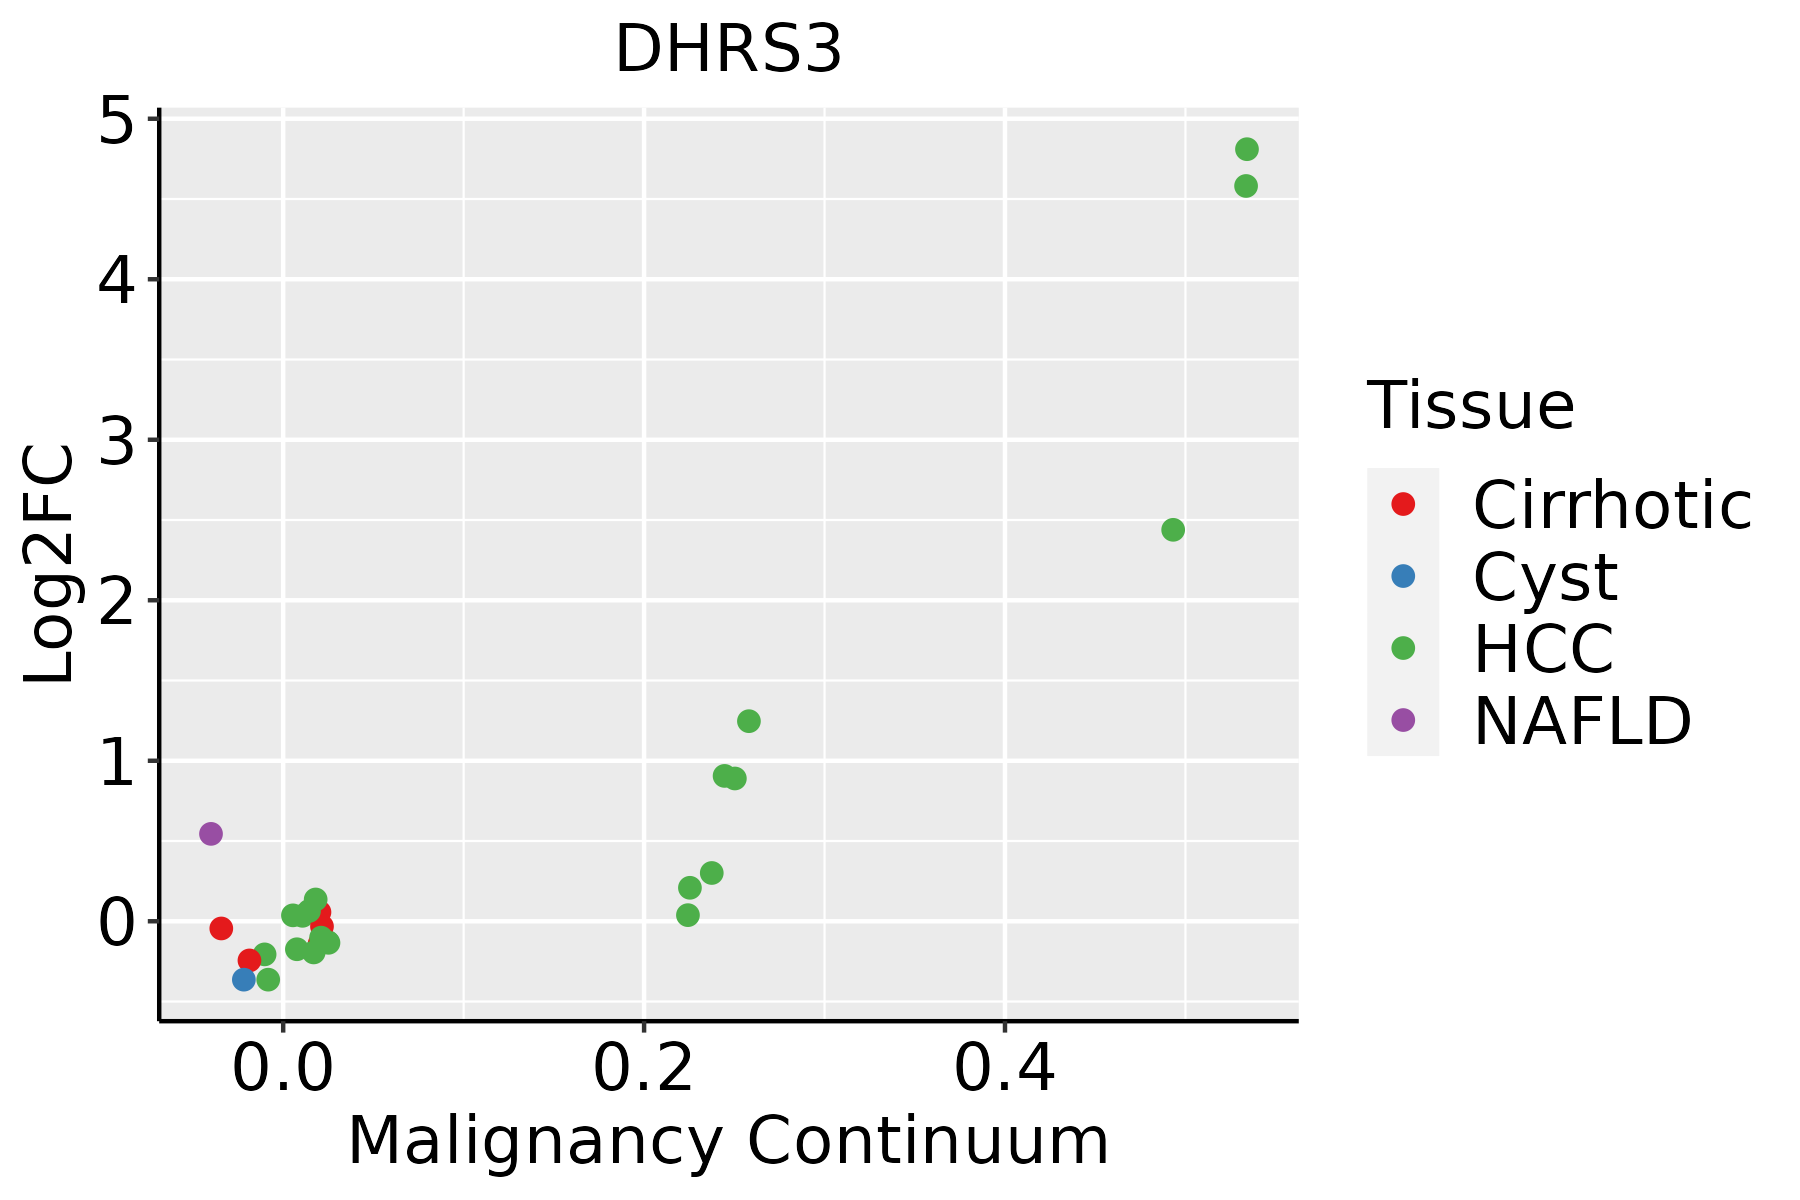 | HCC: Hepatocellular carcinoma |
| NAFLD: Non-alcoholic fatty liver disease | ||
| Oral Cavity |  | EOLP: Erosive Oral lichen planus |
| LP: leukoplakia | ||
| NEOLP: Non-erosive oral lichen planus | ||
| OSCC: Oral squamous cell carcinoma | ||
| Prostate | 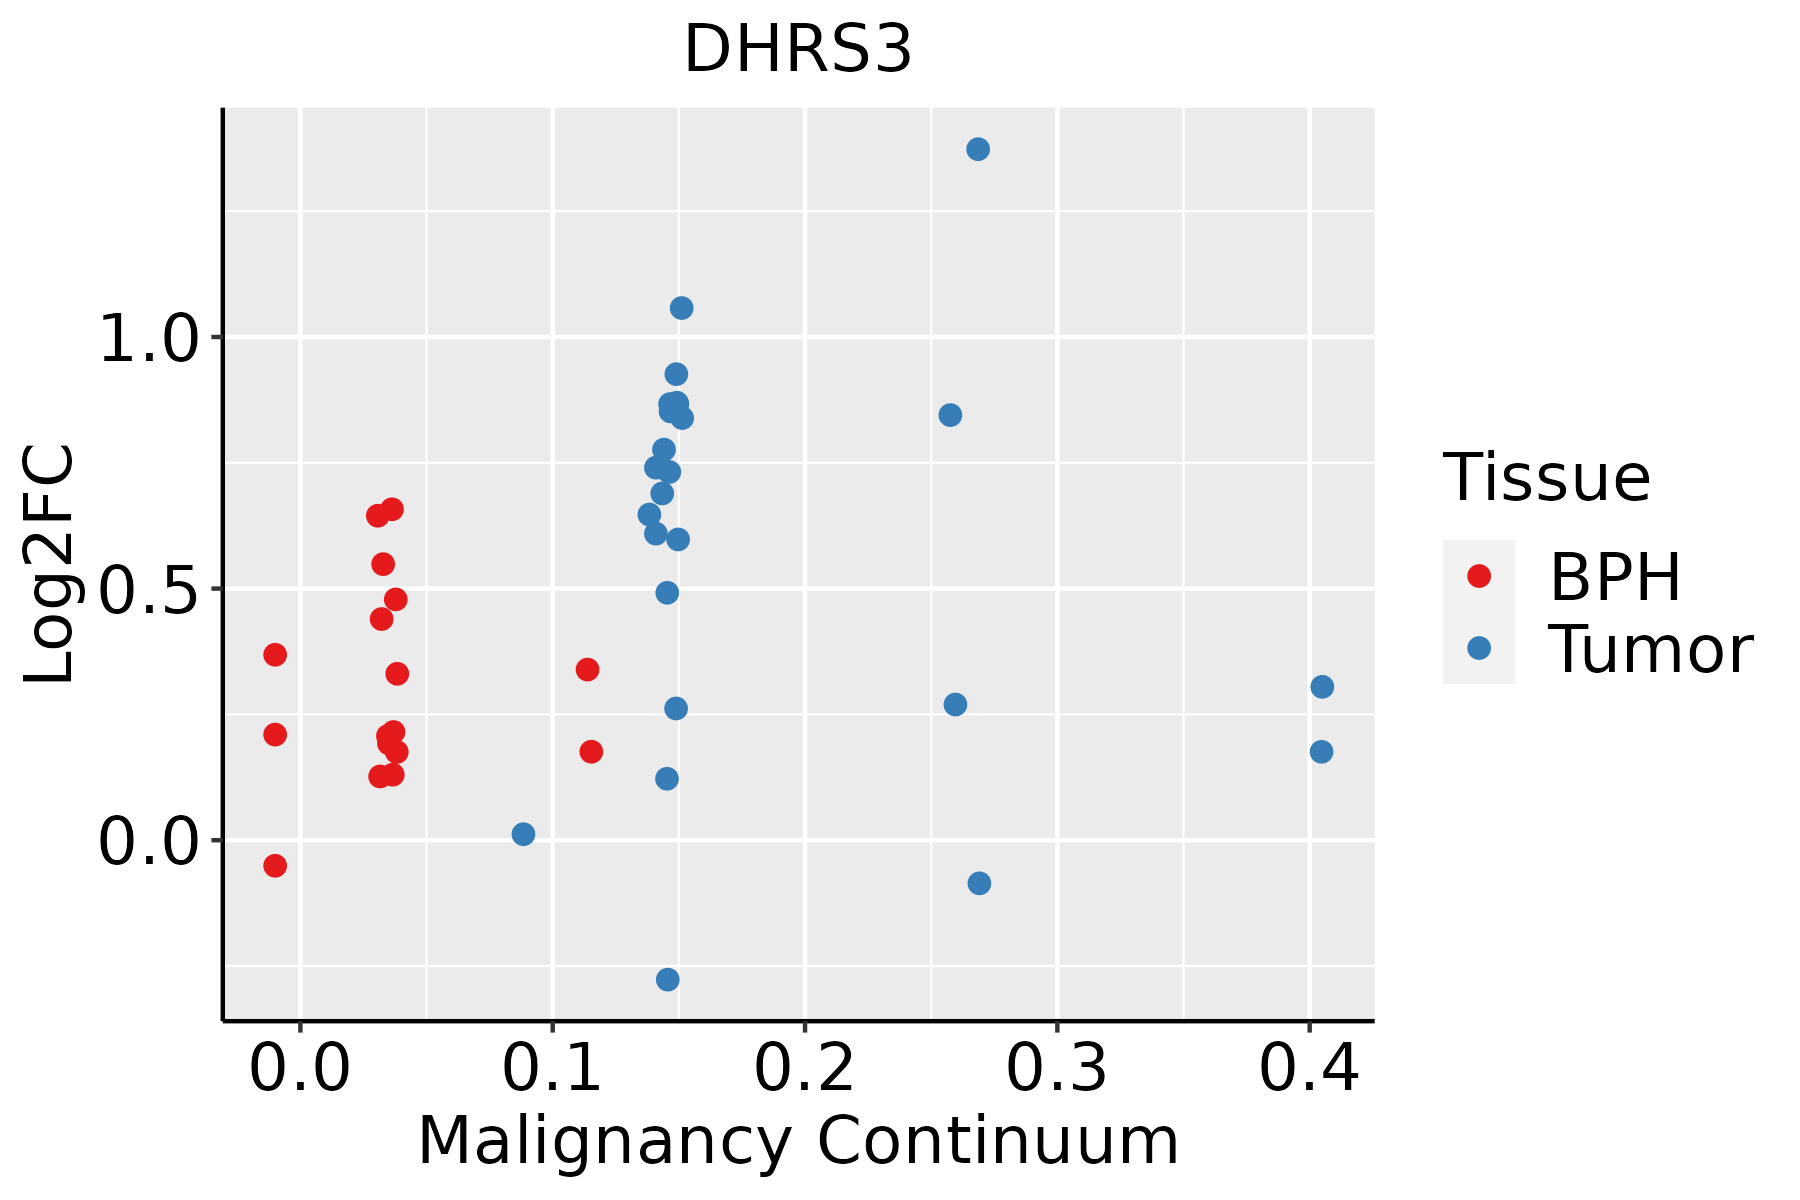 | BPH: Benign Prostatic Hyperplasia |
| Thyroid | 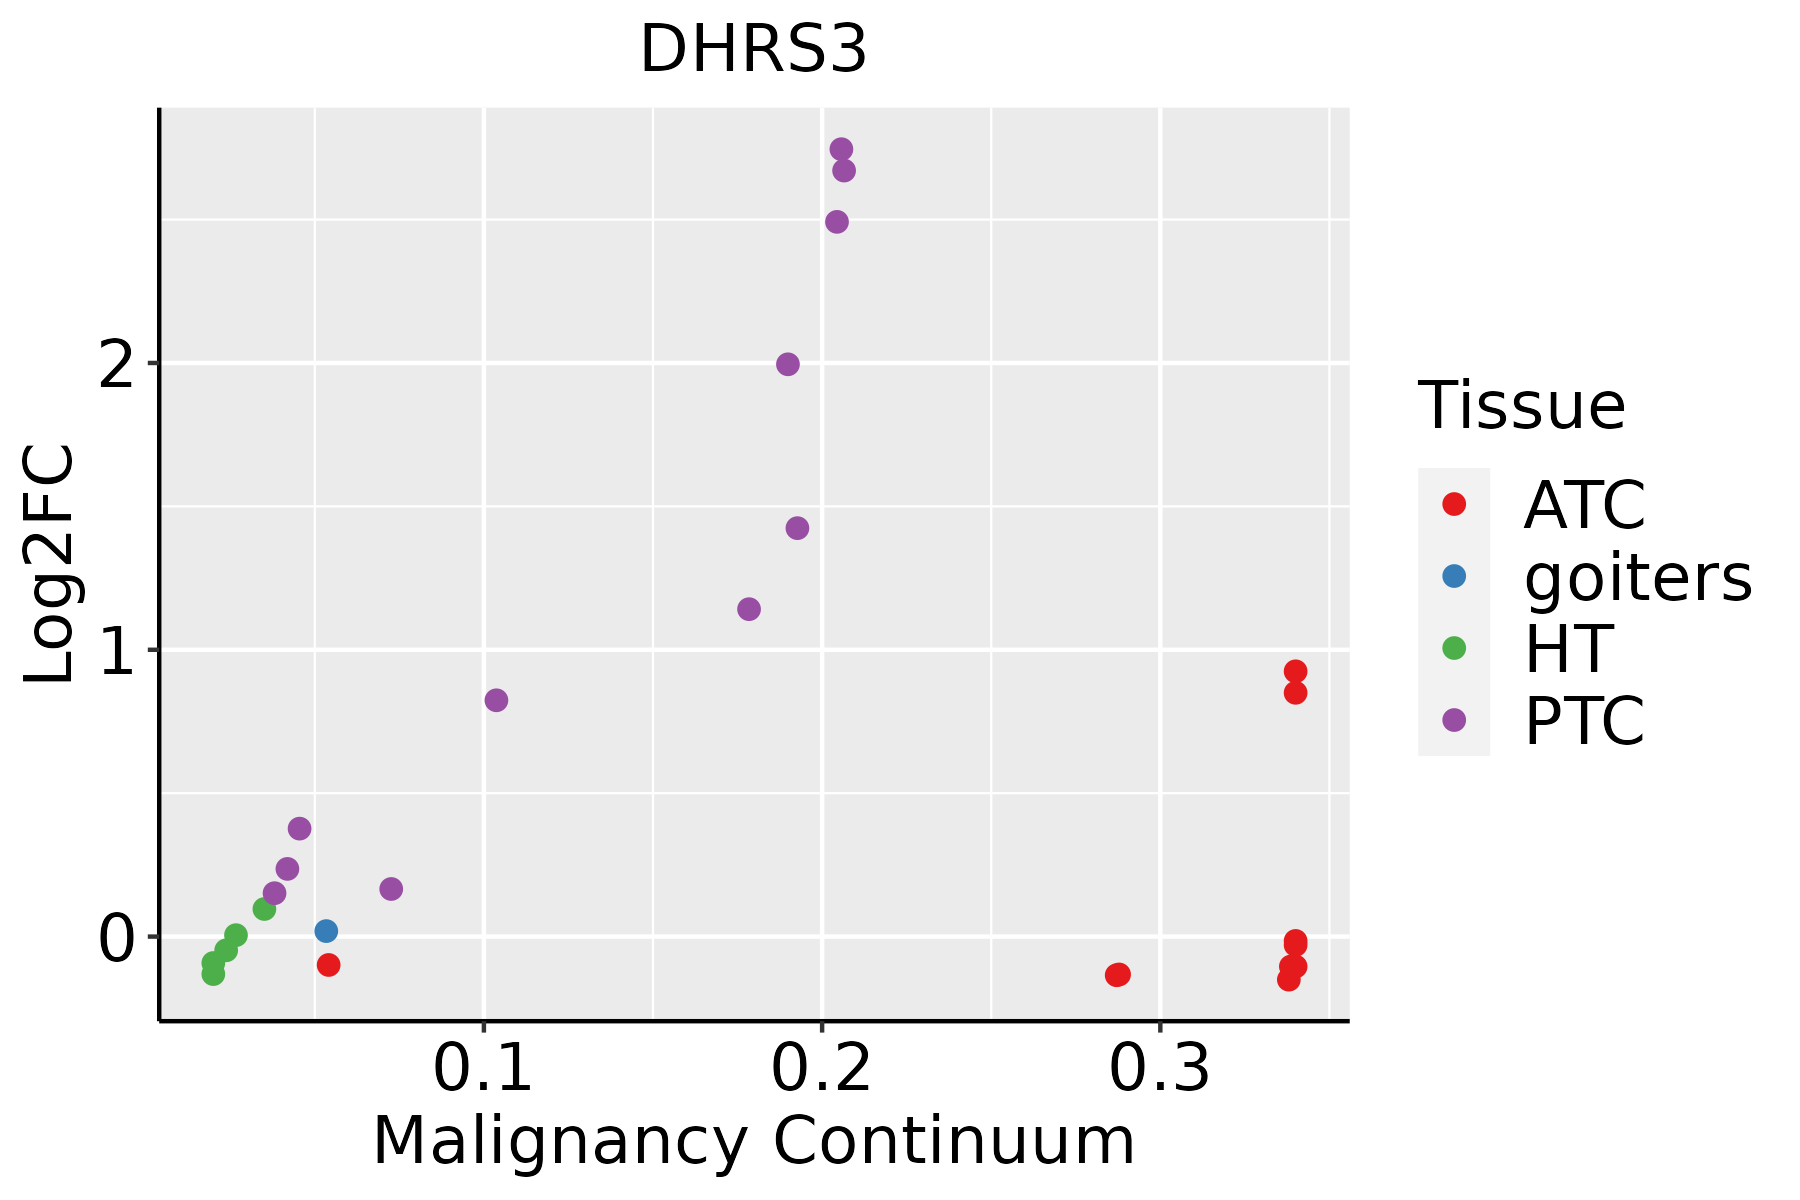 | ATC: Anaplastic thyroid cancer |
| HT: Hashimoto's thyroiditis | ||
| PTC: Papillary thyroid cancer |
| ∗log2FC in expression of this searched gene in stem-like cells from each diseased tissue sample relative to stem-like cells in normal samples in each tissue plotted against the malignancy continuum. Samples are colored based on if they are from different disease stage. |
Top |
Malignant transformation related pathway analysis |
| Find out the enriched GO biological processes and KEGG pathways involved in transition from healthy to precancer to cancer |
| Tissue | Disease Stage | Enriched GO biological Processes |
| Colorectum | AD |  |
| Colorectum | SER |  |
| Colorectum | MSS |  |
| Colorectum | MSI-H |  |
| Colorectum | FAP |  |
| ∗Top 15 enriched GO BP terms are showed in the bar plot of each disease state in each tissue. Each row represents a significant GO biological process which is colored according to the -log10(p.adjust). |
| Page: 1 2 3 4 5 6 7 8 9 |
| GO ID | Tissue | Disease Stage | Description | Gene Ratio | Bg Ratio | pvalue | p.adjust | Count |
| GO:00060918 | Breast | Precancer | generation of precursor metabolites and energy | 94/1080 | 490/18723 | 1.54e-25 | 1.64e-22 | 94 |
| GO:00229008 | Breast | Precancer | electron transport chain | 42/1080 | 175/18723 | 1.37e-15 | 4.59e-13 | 42 |
| GO:00305228 | Breast | Precancer | intracellular receptor signaling pathway | 27/1080 | 265/18723 | 2.99e-03 | 2.57e-02 | 27 |
| GO:00015036 | Breast | Precancer | ossification | 36/1080 | 408/18723 | 7.53e-03 | 4.98e-02 | 36 |
| GO:000609113 | Breast | IDC | generation of precursor metabolites and energy | 103/1434 | 490/18723 | 1.53e-21 | 1.74e-18 | 103 |
| GO:002290013 | Breast | IDC | electron transport chain | 51/1434 | 175/18723 | 2.23e-17 | 8.43e-15 | 51 |
| GO:003052214 | Breast | IDC | intracellular receptor signaling pathway | 37/1434 | 265/18723 | 2.77e-04 | 4.26e-03 | 37 |
| GO:000150311 | Breast | IDC | ossification | 50/1434 | 408/18723 | 6.51e-04 | 8.04e-03 | 50 |
| GO:000609123 | Breast | DCIS | generation of precursor metabolites and energy | 103/1390 | 490/18723 | 1.46e-22 | 1.65e-19 | 103 |
| GO:002290023 | Breast | DCIS | electron transport chain | 51/1390 | 175/18723 | 6.01e-18 | 2.62e-15 | 51 |
| GO:003052224 | Breast | DCIS | intracellular receptor signaling pathway | 35/1390 | 265/18723 | 6.38e-04 | 7.92e-03 | 35 |
| GO:000150321 | Breast | DCIS | ossification | 45/1390 | 408/18723 | 4.98e-03 | 3.72e-02 | 45 |
| GO:00229009 | Cervix | CC | electron transport chain | 53/2311 | 175/18723 | 2.23e-10 | 3.43e-08 | 53 |
| GO:00060919 | Cervix | CC | generation of precursor metabolites and energy | 105/2311 | 490/18723 | 7.40e-09 | 6.61e-07 | 105 |
| GO:00305229 | Cervix | CC | intracellular receptor signaling pathway | 60/2311 | 265/18723 | 1.89e-06 | 5.97e-05 | 60 |
| GO:00015037 | Cervix | CC | ossification | 71/2311 | 408/18723 | 1.67e-03 | 1.28e-02 | 71 |
| GO:00302781 | Cervix | CC | regulation of ossification | 24/2311 | 115/18723 | 6.51e-03 | 3.61e-02 | 24 |
| GO:000609124 | Cervix | N_HPV | generation of precursor metabolites and energy | 40/534 | 490/18723 | 2.59e-09 | 7.88e-07 | 40 |
| GO:002290024 | Cervix | N_HPV | electron transport chain | 21/534 | 175/18723 | 2.95e-08 | 3.63e-06 | 21 |
| GO:00603482 | Cervix | N_HPV | bone development | 15/534 | 205/18723 | 8.27e-04 | 1.02e-02 | 15 |
| Page: 1 2 3 4 5 6 7 8 |
| Pathway ID | Tissue | Disease Stage | Description | Gene Ratio | Bg Ratio | pvalue | p.adjust | qvalue | Count |
| hsa012405 | Esophagus | ESCC | Biosynthesis of cofactors | 97/4205 | 153/8465 | 3.88e-04 | 1.35e-03 | 6.94e-04 | 97 |
| hsa0124012 | Esophagus | ESCC | Biosynthesis of cofactors | 97/4205 | 153/8465 | 3.88e-04 | 1.35e-03 | 6.94e-04 | 97 |
| hsa01240 | Liver | Cirrhotic | Biosynthesis of cofactors | 66/2530 | 153/8465 | 3.11e-04 | 1.99e-03 | 1.23e-03 | 66 |
| hsa012401 | Liver | Cirrhotic | Biosynthesis of cofactors | 66/2530 | 153/8465 | 3.11e-04 | 1.99e-03 | 1.23e-03 | 66 |
| hsa012402 | Liver | HCC | Biosynthesis of cofactors | 103/4020 | 153/8465 | 4.67e-07 | 5.05e-06 | 2.81e-06 | 103 |
| hsa012403 | Liver | HCC | Biosynthesis of cofactors | 103/4020 | 153/8465 | 4.67e-07 | 5.05e-06 | 2.81e-06 | 103 |
| hsa012404 | Oral cavity | OSCC | Biosynthesis of cofactors | 88/3704 | 153/8465 | 3.84e-04 | 1.20e-03 | 6.12e-04 | 88 |
| hsa0124011 | Oral cavity | OSCC | Biosynthesis of cofactors | 88/3704 | 153/8465 | 3.84e-04 | 1.20e-03 | 6.12e-04 | 88 |
| hsa0124021 | Oral cavity | LP | Biosynthesis of cofactors | 57/2418 | 153/8465 | 1.17e-02 | 3.91e-02 | 2.52e-02 | 57 |
| hsa0124031 | Oral cavity | LP | Biosynthesis of cofactors | 57/2418 | 153/8465 | 1.17e-02 | 3.91e-02 | 2.52e-02 | 57 |
| Page: 1 |
Top |
Cell-cell communication analysis |
| Identification of potential cell-cell interactions between two cell types and their ligand-receptor pairs for different disease states |
| Ligand | Receptor | LRpair | Pathway | Tissue | Disease Stage |
| Page: 1 |
Top |
Single-cell gene regulatory network inference analysis |
| Find out the significant the regulons (TFs) and the target genes of each regulon across cell types for different disease states |
| TF | Cell Type | Tissue | Disease Stage | Target Gene | RSS | Regulon Activity |
| ∗The dot plots of a searched regulon are shown for all cell subpopulations in each disease state of each tissue based on the regulon specific score inferred using pySCENIC and by calculating the average expression. |
| Page: 1 |
Top |
Somatic mutation of malignant transformation related genes |
| Annotation of somatic variants for genes involved in malignant transformation |
| Hugo Symbol | Variant Class | Variant Classification | dbSNP RS | HGVSc | HGVSp | HGVSp Short | SWISSPROT | BIOTYPE | SIFT | PolyPhen | Tumor Sample Barcode | Tissue | Histology | Sex | Age | Stage | Therapy Types | Drugs | Outcome |
| DHRS3 | SNV | Missense_Mutation | novel | c.202C>A | p.Leu68Ile | p.L68I | O75911 | protein_coding | tolerated(0.07) | probably_damaging(0.998) | TCGA-AN-A046-01 | Breast | breast invasive carcinoma | Female | >=65 | I/II | Unknown | Unknown | SD |
| DHRS3 | SNV | Missense_Mutation | rs765594786 | c.182N>A | p.Arg61His | p.R61H | O75911 | protein_coding | tolerated(0.46) | benign(0.001) | TCGA-DR-A0ZM-01 | Cervix | cervical & endocervical cancer | Female | <65 | III/IV | Unspecific | Cisplatin | SD |
| DHRS3 | SNV | Missense_Mutation | rs754683233 | c.847N>A | p.Glu283Lys | p.E283K | O75911 | protein_coding | tolerated(0.93) | benign(0.074) | TCGA-ZJ-AAXA-01 | Cervix | cervical & endocervical cancer | Female | <65 | I/II | Unknown | Unknown | SD |
| DHRS3 | SNV | Missense_Mutation | novel | c.686N>A | p.Gly229Asp | p.G229D | O75911 | protein_coding | deleterious(0) | benign(0.365) | TCGA-5M-AAT6-01 | Colorectum | colon adenocarcinoma | Female | <65 | III/IV | Unknown | Unknown | PD |
| DHRS3 | SNV | Missense_Mutation | rs146383898 | c.743G>A | p.Arg248Gln | p.R248Q | O75911 | protein_coding | tolerated(0.75) | benign(0) | TCGA-A6-6781-01 | Colorectum | colon adenocarcinoma | Male | <65 | III/IV | Chemotherapy | oxaliplatin | SD |
| DHRS3 | SNV | Missense_Mutation | rs201342762 | c.331C>T | p.Arg111Trp | p.R111W | O75911 | protein_coding | deleterious(0) | probably_damaging(0.991) | TCGA-AA-3864-01 | Colorectum | colon adenocarcinoma | Male | >=65 | I/II | Unknown | Unknown | SD |
| DHRS3 | SNV | Missense_Mutation | novel | c.481N>T | p.Arg161Cys | p.R161C | O75911 | protein_coding | deleterious(0.03) | probably_damaging(0.973) | TCGA-AJ-A3BG-01 | Endometrium | uterine corpus endometrioid carcinoma | Female | >=65 | I/II | Chemotherapy | carboplatin | PD |
| DHRS3 | SNV | Missense_Mutation | novel | c.650N>C | p.Val217Ala | p.V217A | O75911 | protein_coding | deleterious(0.01) | benign(0.033) | TCGA-AP-A1DK-01 | Endometrium | uterine corpus endometrioid carcinoma | Female | <65 | I/II | Unknown | Unknown | SD |
| DHRS3 | SNV | Missense_Mutation | rs765027018 | c.901N>T | p.Arg301Trp | p.R301W | O75911 | protein_coding | deleterious(0) | probably_damaging(0.948) | TCGA-AX-A0J1-01 | Endometrium | uterine corpus endometrioid carcinoma | Female | >=65 | I/II | Unknown | Unknown | SD |
| DHRS3 | SNV | Missense_Mutation | rs757291841 | c.479C>T | p.Pro160Leu | p.P160L | O75911 | protein_coding | deleterious(0) | probably_damaging(0.999) | TCGA-B5-A3FC-01 | Endometrium | uterine corpus endometrioid carcinoma | Female | <65 | I/II | Unknown | Unknown | SD |
| Page: 1 2 3 |
Top |
Related drugs of malignant transformation related genes |
| Identification of chemicals and drugs interact with genes involved in malignant transfromation |
| (DGIdb 4.0) |
| Entrez ID | Symbol | Category | Interaction Types | Drug Claim Name | Drug Name | PMIDs |
| Page: 1 |

Copyright 2023-Present -The University of Texas Health Science Center at Houston |