
|
|||||
|
 | |
| |
| |
| |
| |
| |
|
Gene: DDX19A |
Gene summary for DDX19A |
| Gene information | Species | Human | Gene symbol | DDX19A | Gene ID | 55308 |
| Gene name | DEAD-box helicase 19A | |
| Gene Alias | DDX19-DDX19L | |
| Cytomap | 16q22.1 | |
| Gene Type | protein-coding | GO ID | GO:0006403 | UniProtAcc | B4DS24 |
Top |
Malignant transformation analysis |
| Identification of the aberrant gene expression in precancerous and cancerous lesions by comparing the gene expression of stem-like cells in diseased tissues with normal stem cells |
| Entrez ID | Symbol | Replicates | Species | Organ | Tissue | Adj P-value | Log2FC | Malignancy |
| 55308 | DDX19A | P21T-E | Human | Esophagus | ESCC | 2.49e-12 | 2.31e-01 | 0.1617 |
| 55308 | DDX19A | P22T-E | Human | Esophagus | ESCC | 5.01e-17 | 2.73e-01 | 0.1236 |
| 55308 | DDX19A | P23T-E | Human | Esophagus | ESCC | 2.00e-28 | 5.70e-01 | 0.108 |
| 55308 | DDX19A | P24T-E | Human | Esophagus | ESCC | 2.73e-07 | 2.16e-01 | 0.1287 |
| 55308 | DDX19A | P26T-E | Human | Esophagus | ESCC | 3.67e-23 | 3.91e-01 | 0.1276 |
| 55308 | DDX19A | P27T-E | Human | Esophagus | ESCC | 1.87e-16 | 2.40e-01 | 0.1055 |
| 55308 | DDX19A | P28T-E | Human | Esophagus | ESCC | 2.69e-15 | 2.75e-01 | 0.1149 |
| 55308 | DDX19A | P30T-E | Human | Esophagus | ESCC | 3.73e-15 | 4.93e-01 | 0.137 |
| 55308 | DDX19A | P31T-E | Human | Esophagus | ESCC | 2.96e-24 | 3.88e-01 | 0.1251 |
| 55308 | DDX19A | P32T-E | Human | Esophagus | ESCC | 1.11e-19 | 3.76e-01 | 0.1666 |
| 55308 | DDX19A | P36T-E | Human | Esophagus | ESCC | 1.11e-12 | 3.32e-01 | 0.1187 |
| 55308 | DDX19A | P37T-E | Human | Esophagus | ESCC | 3.02e-11 | 2.04e-01 | 0.1371 |
| 55308 | DDX19A | P39T-E | Human | Esophagus | ESCC | 1.66e-04 | 1.04e-01 | 0.0894 |
| 55308 | DDX19A | P40T-E | Human | Esophagus | ESCC | 1.16e-08 | 1.66e-01 | 0.109 |
| 55308 | DDX19A | P42T-E | Human | Esophagus | ESCC | 8.31e-19 | 4.11e-01 | 0.1175 |
| 55308 | DDX19A | P44T-E | Human | Esophagus | ESCC | 7.52e-07 | 1.58e-01 | 0.1096 |
| 55308 | DDX19A | P47T-E | Human | Esophagus | ESCC | 8.50e-07 | 1.57e-01 | 0.1067 |
| 55308 | DDX19A | P48T-E | Human | Esophagus | ESCC | 5.05e-15 | 2.10e-01 | 0.0959 |
| 55308 | DDX19A | P49T-E | Human | Esophagus | ESCC | 3.81e-14 | 9.53e-01 | 0.1768 |
| 55308 | DDX19A | P52T-E | Human | Esophagus | ESCC | 8.50e-21 | 4.07e-01 | 0.1555 |
| Page: 1 2 3 4 5 |
| Tissue | Expression Dynamics | Abbreviation |
| Esophagus | 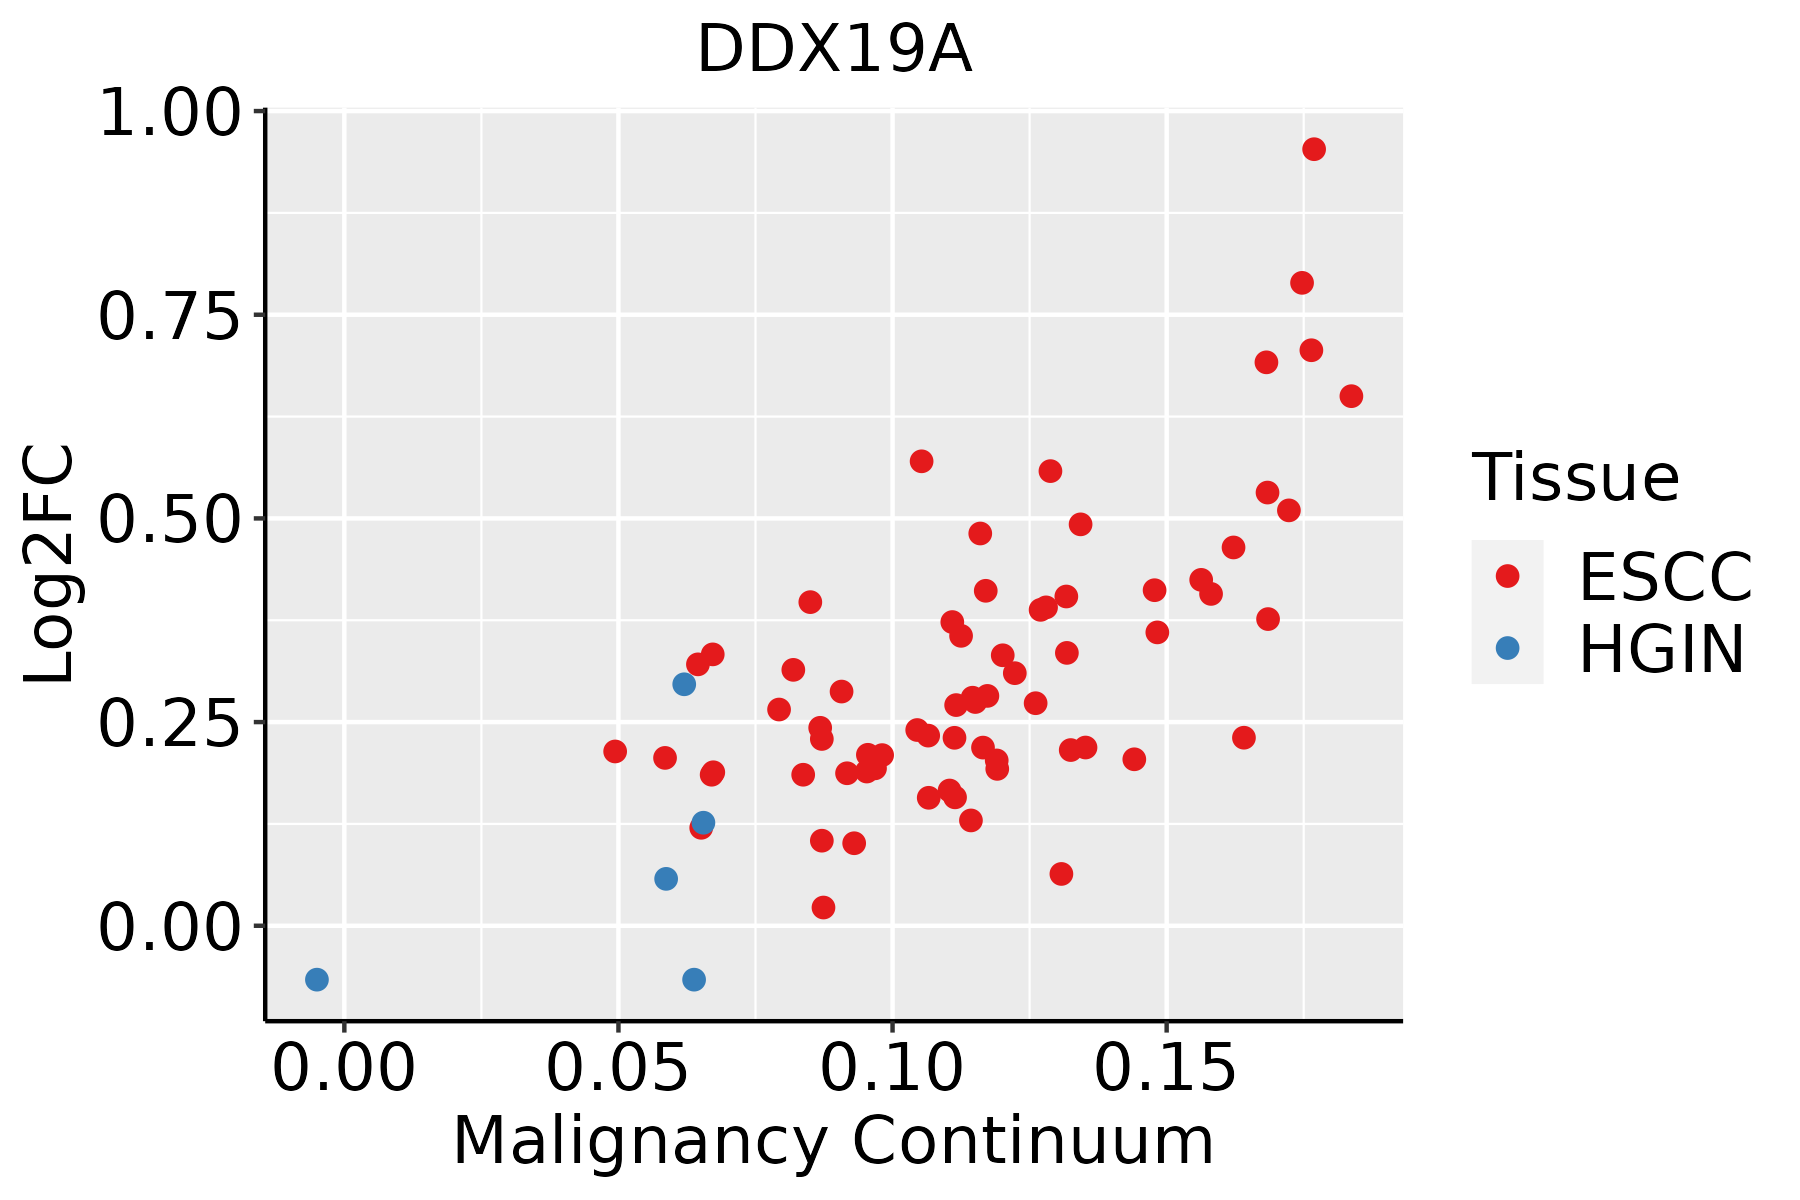 | ESCC: Esophageal squamous cell carcinoma |
| HGIN: High-grade intraepithelial neoplasias | ||
| LGIN: Low-grade intraepithelial neoplasias | ||
| Liver | 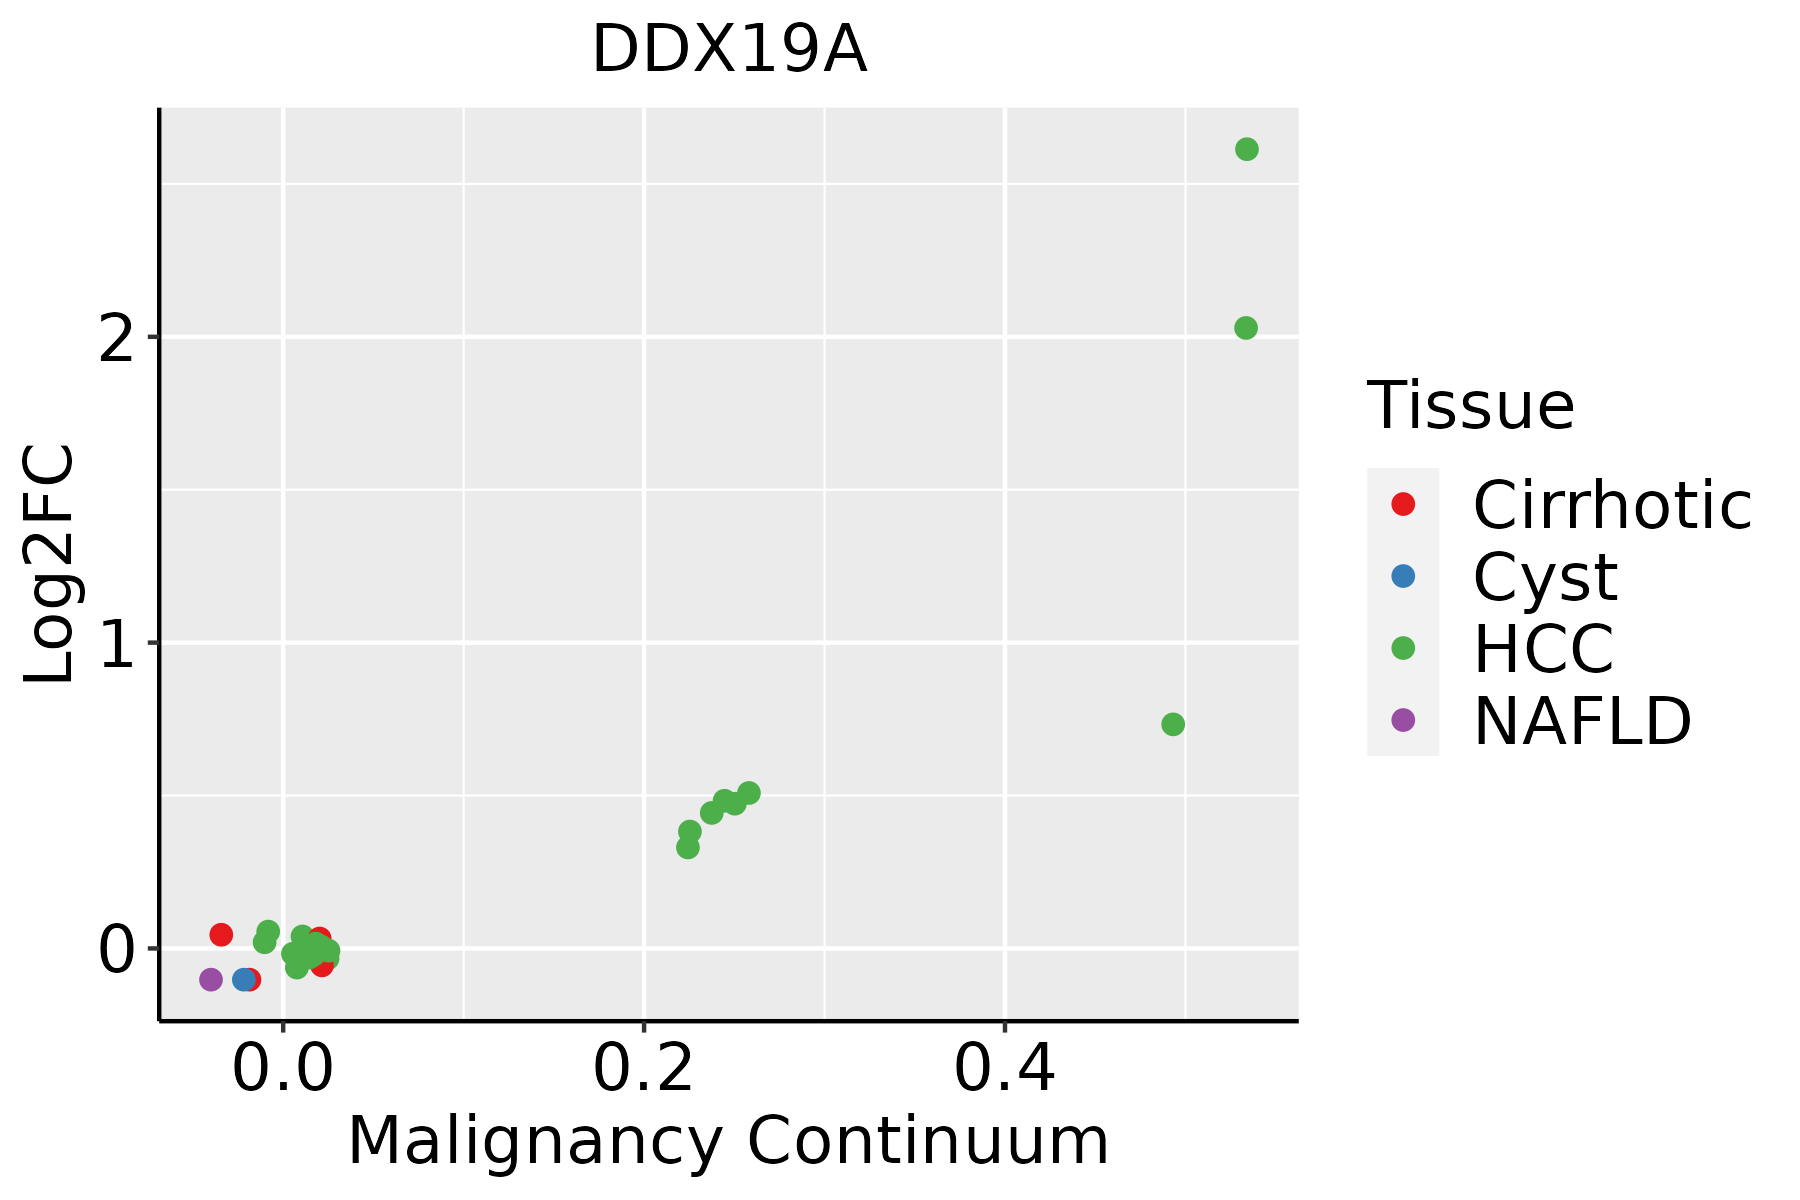 | HCC: Hepatocellular carcinoma |
| NAFLD: Non-alcoholic fatty liver disease | ||
| Oral Cavity | 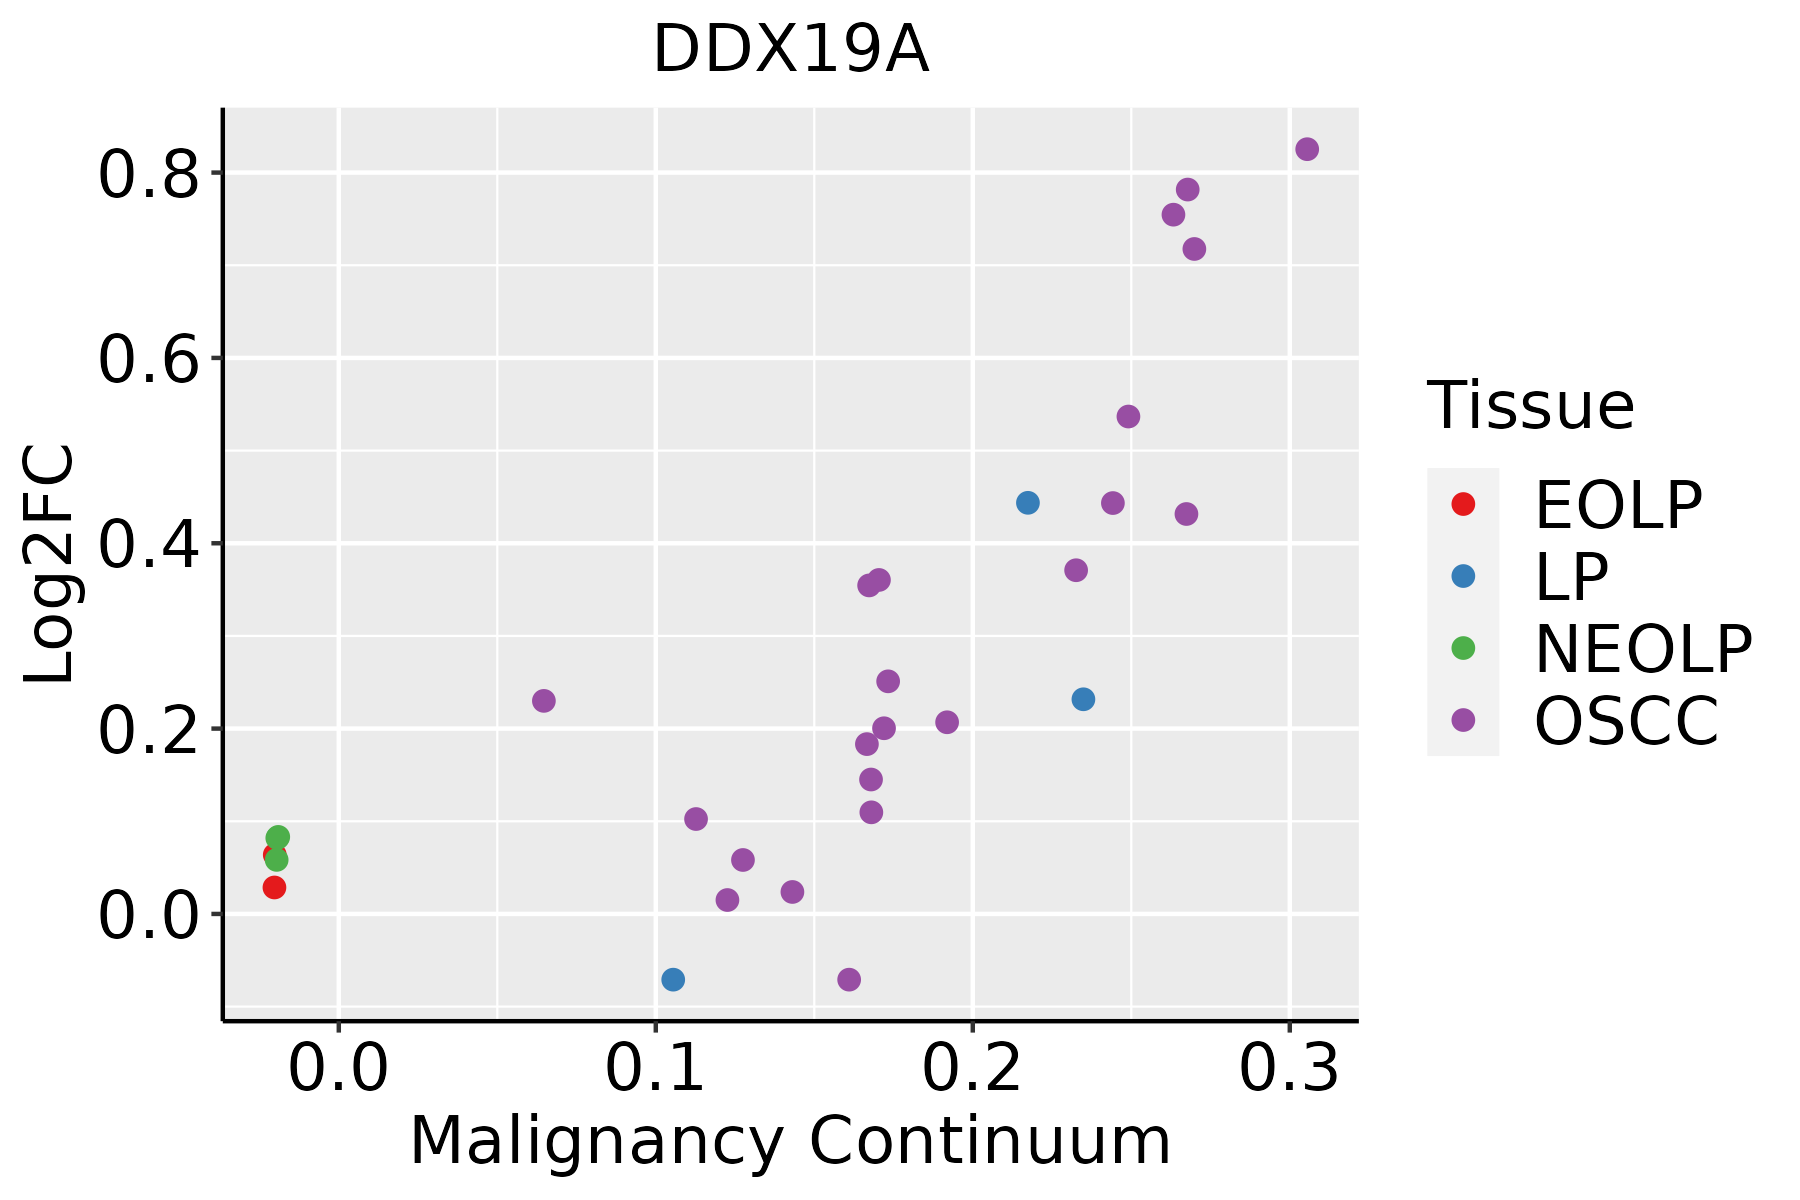 | EOLP: Erosive Oral lichen planus |
| LP: leukoplakia | ||
| NEOLP: Non-erosive oral lichen planus | ||
| OSCC: Oral squamous cell carcinoma | ||
| Thyroid | 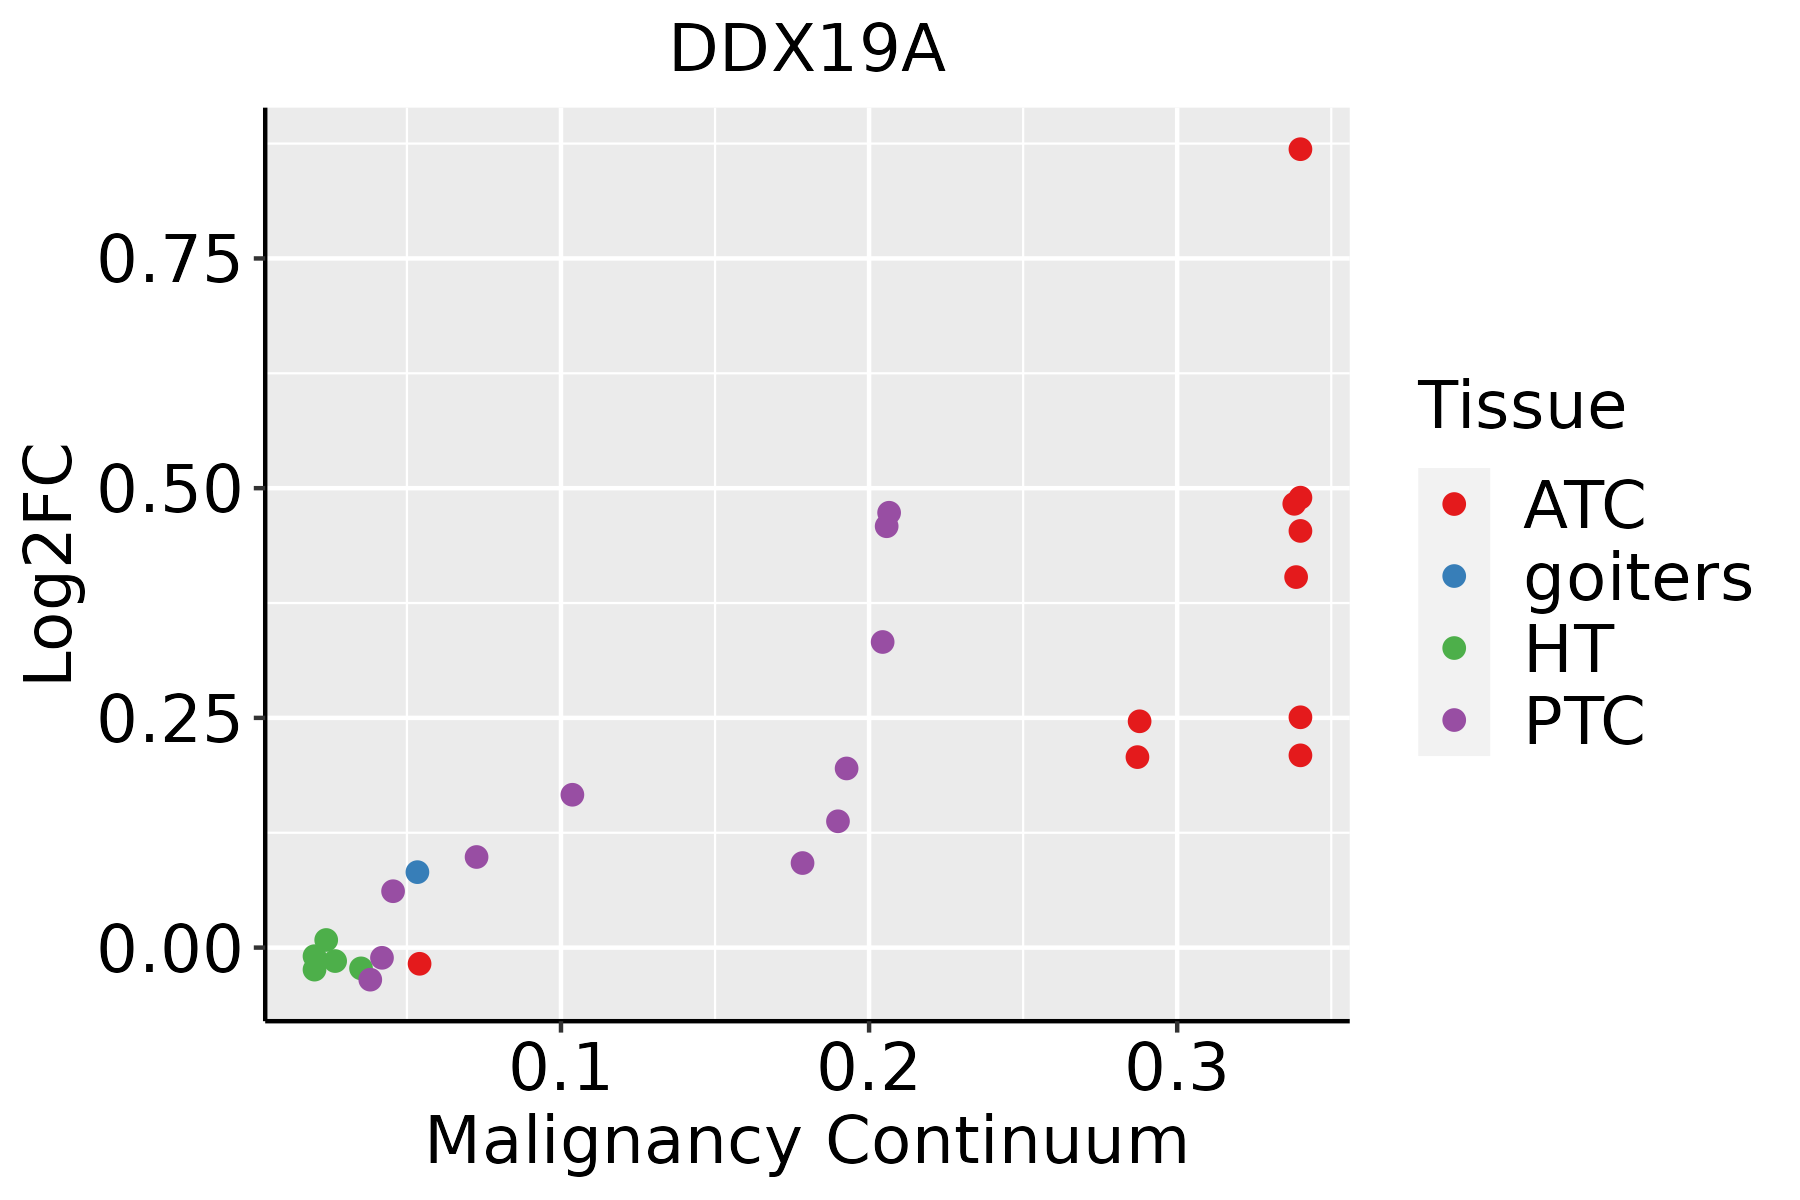 | ATC: Anaplastic thyroid cancer |
| HT: Hashimoto's thyroiditis | ||
| PTC: Papillary thyroid cancer |
| ∗log2FC in expression of this searched gene in stem-like cells from each diseased tissue sample relative to stem-like cells in normal samples in each tissue plotted against the malignancy continuum. Samples are colored based on if they are from different disease stage. |
Top |
Malignant transformation related pathway analysis |
| Find out the enriched GO biological processes and KEGG pathways involved in transition from healthy to precancer to cancer |
| Tissue | Disease Stage | Enriched GO biological Processes |
| Colorectum | AD |  |
| Colorectum | SER |  |
| Colorectum | MSS |  |
| Colorectum | MSI-H |  |
| Colorectum | FAP |  |
| ∗Top 15 enriched GO BP terms are showed in the bar plot of each disease state in each tissue. Each row represents a significant GO biological process which is colored according to the -log10(p.adjust). |
| Page: 1 2 3 4 5 6 7 8 9 |
| GO ID | Tissue | Disease Stage | Description | Gene Ratio | Bg Ratio | pvalue | p.adjust | Count |
| GO:0006913110 | Esophagus | ESCC | nucleocytoplasmic transport | 230/8552 | 301/18723 | 6.04e-28 | 2.02e-25 | 230 |
| GO:0051169110 | Esophagus | ESCC | nuclear transport | 230/8552 | 301/18723 | 6.04e-28 | 2.02e-25 | 230 |
| GO:0006403110 | Esophagus | ESCC | RNA localization | 166/8552 | 201/18723 | 1.95e-27 | 6.18e-25 | 166 |
| GO:005123617 | Esophagus | ESCC | establishment of RNA localization | 134/8552 | 166/18723 | 1.23e-20 | 1.81e-18 | 134 |
| GO:0051168110 | Esophagus | ESCC | nuclear export | 126/8552 | 154/18723 | 1.88e-20 | 2.65e-18 | 126 |
| GO:005102815 | Esophagus | ESCC | mRNA transport | 110/8552 | 130/18723 | 2.76e-20 | 3.80e-18 | 110 |
| GO:005065717 | Esophagus | ESCC | nucleic acid transport | 131/8552 | 163/18723 | 6.94e-20 | 8.46e-18 | 131 |
| GO:005065817 | Esophagus | ESCC | RNA transport | 131/8552 | 163/18723 | 6.94e-20 | 8.46e-18 | 131 |
| GO:001593117 | Esophagus | ESCC | nucleobase-containing compound transport | 162/8552 | 222/18723 | 9.87e-17 | 7.93e-15 | 162 |
| GO:007116612 | Esophagus | ESCC | ribonucleoprotein complex localization | 66/8552 | 77/18723 | 2.94e-13 | 1.38e-11 | 66 |
| GO:007142612 | Esophagus | ESCC | ribonucleoprotein complex export from nucleus | 65/8552 | 76/18723 | 5.56e-13 | 2.50e-11 | 65 |
| GO:000640512 | Esophagus | ESCC | RNA export from nucleus | 68/8552 | 84/18723 | 2.99e-11 | 1.01e-09 | 68 |
| GO:00064064 | Esophagus | ESCC | mRNA export from nucleus | 51/8552 | 59/18723 | 7.98e-11 | 2.47e-09 | 51 |
| GO:00714274 | Esophagus | ESCC | mRNA-containing ribonucleoprotein complex export from nucleus | 51/8552 | 59/18723 | 7.98e-11 | 2.47e-09 | 51 |
| GO:003150314 | Esophagus | ESCC | protein-containing complex localization | 139/8552 | 220/18723 | 1.14e-07 | 1.85e-06 | 139 |
| GO:000640321 | Liver | HCC | RNA localization | 151/7958 | 201/18723 | 3.72e-21 | 5.89e-19 | 151 |
| GO:000691322 | Liver | HCC | nucleocytoplasmic transport | 208/7958 | 301/18723 | 5.51e-21 | 8.12e-19 | 208 |
| GO:005116922 | Liver | HCC | nuclear transport | 208/7958 | 301/18723 | 5.51e-21 | 8.12e-19 | 208 |
| GO:005123621 | Liver | HCC | establishment of RNA localization | 121/7958 | 166/18723 | 1.61e-15 | 1.19e-13 | 121 |
| GO:005116822 | Liver | HCC | nuclear export | 113/7958 | 154/18723 | 6.30e-15 | 4.39e-13 | 113 |
| Page: 1 2 3 4 5 |
| Pathway ID | Tissue | Disease Stage | Description | Gene Ratio | Bg Ratio | pvalue | p.adjust | qvalue | Count |
| hsa0301321 | Esophagus | ESCC | Nucleocytoplasmic transport | 89/4205 | 108/8465 | 1.20e-12 | 2.37e-11 | 1.21e-11 | 89 |
| hsa0301524 | Esophagus | ESCC | mRNA surveillance pathway | 72/4205 | 97/8465 | 6.12e-07 | 4.10e-06 | 2.10e-06 | 72 |
| hsa0301331 | Esophagus | ESCC | Nucleocytoplasmic transport | 89/4205 | 108/8465 | 1.20e-12 | 2.37e-11 | 1.21e-11 | 89 |
| hsa0301534 | Esophagus | ESCC | mRNA surveillance pathway | 72/4205 | 97/8465 | 6.12e-07 | 4.10e-06 | 2.10e-06 | 72 |
| hsa03013 | Liver | HCC | Nucleocytoplasmic transport | 81/4020 | 108/8465 | 4.28e-09 | 6.83e-08 | 3.80e-08 | 81 |
| hsa0301521 | Liver | HCC | mRNA surveillance pathway | 66/4020 | 97/8465 | 3.16e-05 | 1.88e-04 | 1.04e-04 | 66 |
| hsa030131 | Liver | HCC | Nucleocytoplasmic transport | 81/4020 | 108/8465 | 4.28e-09 | 6.83e-08 | 3.80e-08 | 81 |
| hsa0301531 | Liver | HCC | mRNA surveillance pathway | 66/4020 | 97/8465 | 3.16e-05 | 1.88e-04 | 1.04e-04 | 66 |
| hsa030136 | Oral cavity | OSCC | Nucleocytoplasmic transport | 82/3704 | 108/8465 | 7.93e-12 | 1.33e-10 | 6.77e-11 | 82 |
| hsa030158 | Oral cavity | OSCC | mRNA surveillance pathway | 75/3704 | 97/8465 | 1.30e-11 | 2.01e-10 | 1.02e-10 | 75 |
| hsa0301311 | Oral cavity | OSCC | Nucleocytoplasmic transport | 82/3704 | 108/8465 | 7.93e-12 | 1.33e-10 | 6.77e-11 | 82 |
| hsa0301513 | Oral cavity | OSCC | mRNA surveillance pathway | 75/3704 | 97/8465 | 1.30e-11 | 2.01e-10 | 1.02e-10 | 75 |
| hsa0301523 | Oral cavity | LP | mRNA surveillance pathway | 50/2418 | 97/8465 | 1.39e-06 | 1.50e-05 | 9.66e-06 | 50 |
| hsa030132 | Oral cavity | LP | Nucleocytoplasmic transport | 53/2418 | 108/8465 | 4.68e-06 | 4.10e-05 | 2.64e-05 | 53 |
| hsa0301533 | Oral cavity | LP | mRNA surveillance pathway | 50/2418 | 97/8465 | 1.39e-06 | 1.50e-05 | 9.66e-06 | 50 |
| hsa030133 | Oral cavity | LP | Nucleocytoplasmic transport | 53/2418 | 108/8465 | 4.68e-06 | 4.10e-05 | 2.64e-05 | 53 |
| Page: 1 |
Top |
Cell-cell communication analysis |
| Identification of potential cell-cell interactions between two cell types and their ligand-receptor pairs for different disease states |
| Ligand | Receptor | LRpair | Pathway | Tissue | Disease Stage |
| Page: 1 |
Top |
Single-cell gene regulatory network inference analysis |
| Find out the significant the regulons (TFs) and the target genes of each regulon across cell types for different disease states |
| TF | Cell Type | Tissue | Disease Stage | Target Gene | RSS | Regulon Activity |
| ∗The dot plots of a searched regulon are shown for all cell subpopulations in each disease state of each tissue based on the regulon specific score inferred using pySCENIC and by calculating the average expression. |
| Page: 1 |
Top |
Somatic mutation of malignant transformation related genes |
| Annotation of somatic variants for genes involved in malignant transformation |
| Hugo Symbol | Variant Class | Variant Classification | dbSNP RS | HGVSc | HGVSp | HGVSp Short | SWISSPROT | BIOTYPE | SIFT | PolyPhen | Tumor Sample Barcode | Tissue | Histology | Sex | Age | Stage | Therapy Types | Drugs | Outcome |
| DDX19A | SNV | Missense_Mutation | novel | c.1289G>C | p.Gly430Ala | p.G430A | Q9NUU7 | protein_coding | deleterious(0) | probably_damaging(1) | TCGA-AN-A0FF-01 | Breast | breast invasive carcinoma | Female | <65 | I/II | Unknown | Unknown | SD |
| DDX19A | SNV | Missense_Mutation | novel | c.760N>A | p.Asp254Asn | p.D254N | Q9NUU7 | protein_coding | deleterious(0.02) | probably_damaging(0.999) | TCGA-D8-A1JG-01 | Breast | breast invasive carcinoma | Female | <65 | I/II | Chemotherapy | doxorubicin | SD |
| DDX19A | insertion | In_Frame_Ins | novel | c.1291_1292insAAG | p.Arg431delinsGlnGly | p.R431delinsQG | Q9NUU7 | protein_coding | TCGA-AN-A0FF-01 | Breast | breast invasive carcinoma | Female | <65 | I/II | Unknown | Unknown | SD | ||
| DDX19A | insertion | In_Frame_Ins | novel | c.594_595insAGCCTAATTTTTGTATTTTTAATGGAGGTGGGGTTTCACCATGTT | p.Arg198_Gly199insSerLeuIlePheValPheLeuMetGluValGlyPheHisHisVal | p.R198_G199insSLIFVFLMEVGFHHV | Q9NUU7 | protein_coding | TCGA-AO-A0JB-01 | Breast | breast invasive carcinoma | Female | <65 | III/IV | Chemotherapy | cyclophosphamide | SD | ||
| DDX19A | SNV | Missense_Mutation | c.1189N>C | p.Asp397His | p.D397H | Q9NUU7 | protein_coding | deleterious(0) | probably_damaging(1) | TCGA-IR-A3LA-01 | Cervix | cervical & endocervical cancer | Female | <65 | I/II | Chemotherapy | cisplatin | CR | |
| DDX19A | SNV | Missense_Mutation | c.357N>T | p.Glu119Asp | p.E119D | Q9NUU7 | protein_coding | deleterious(0) | benign(0.369) | TCGA-AA-3672-01 | Colorectum | colon adenocarcinoma | Female | >=65 | III/IV | Unknown | Unknown | SD | |
| DDX19A | SNV | Missense_Mutation | novel | c.839T>C | p.Val280Ala | p.V280A | Q9NUU7 | protein_coding | deleterious(0) | probably_damaging(0.999) | TCGA-AA-3966-01 | Colorectum | colon adenocarcinoma | Female | >=65 | I/II | Unknown | Unknown | SD |
| DDX19A | SNV | Missense_Mutation | novel | c.1288N>T | p.Gly430Cys | p.G430C | Q9NUU7 | protein_coding | deleterious(0) | probably_damaging(1) | TCGA-AD-6889-01 | Colorectum | colon adenocarcinoma | Male | >=65 | I/II | Chemotherapy | xeloda | PD |
| DDX19A | SNV | Missense_Mutation | c.1123A>C | p.Ile375Leu | p.I375L | Q9NUU7 | protein_coding | tolerated(0.32) | probably_damaging(0.993) | TCGA-AZ-6598-01 | Colorectum | colon adenocarcinoma | Female | >=65 | I/II | Unknown | Unknown | SD | |
| DDX19A | SNV | Missense_Mutation | rs779504912 | c.893N>A | p.Arg298His | p.R298H | Q9NUU7 | protein_coding | deleterious(0.05) | benign(0.013) | TCGA-CM-6679-01 | Colorectum | colon adenocarcinoma | Male | <65 | I/II | Unknown | Unknown | SD |
| Page: 1 2 3 4 |
Top |
Related drugs of malignant transformation related genes |
| Identification of chemicals and drugs interact with genes involved in malignant transfromation |
| (DGIdb 4.0) |
| Entrez ID | Symbol | Category | Interaction Types | Drug Claim Name | Drug Name | PMIDs |
| Page: 1 |

Copyright 2023-Present -The University of Texas Health Science Center at Houston |