| Tissue | Expression Dynamics | Abbreviation |
| Breast | 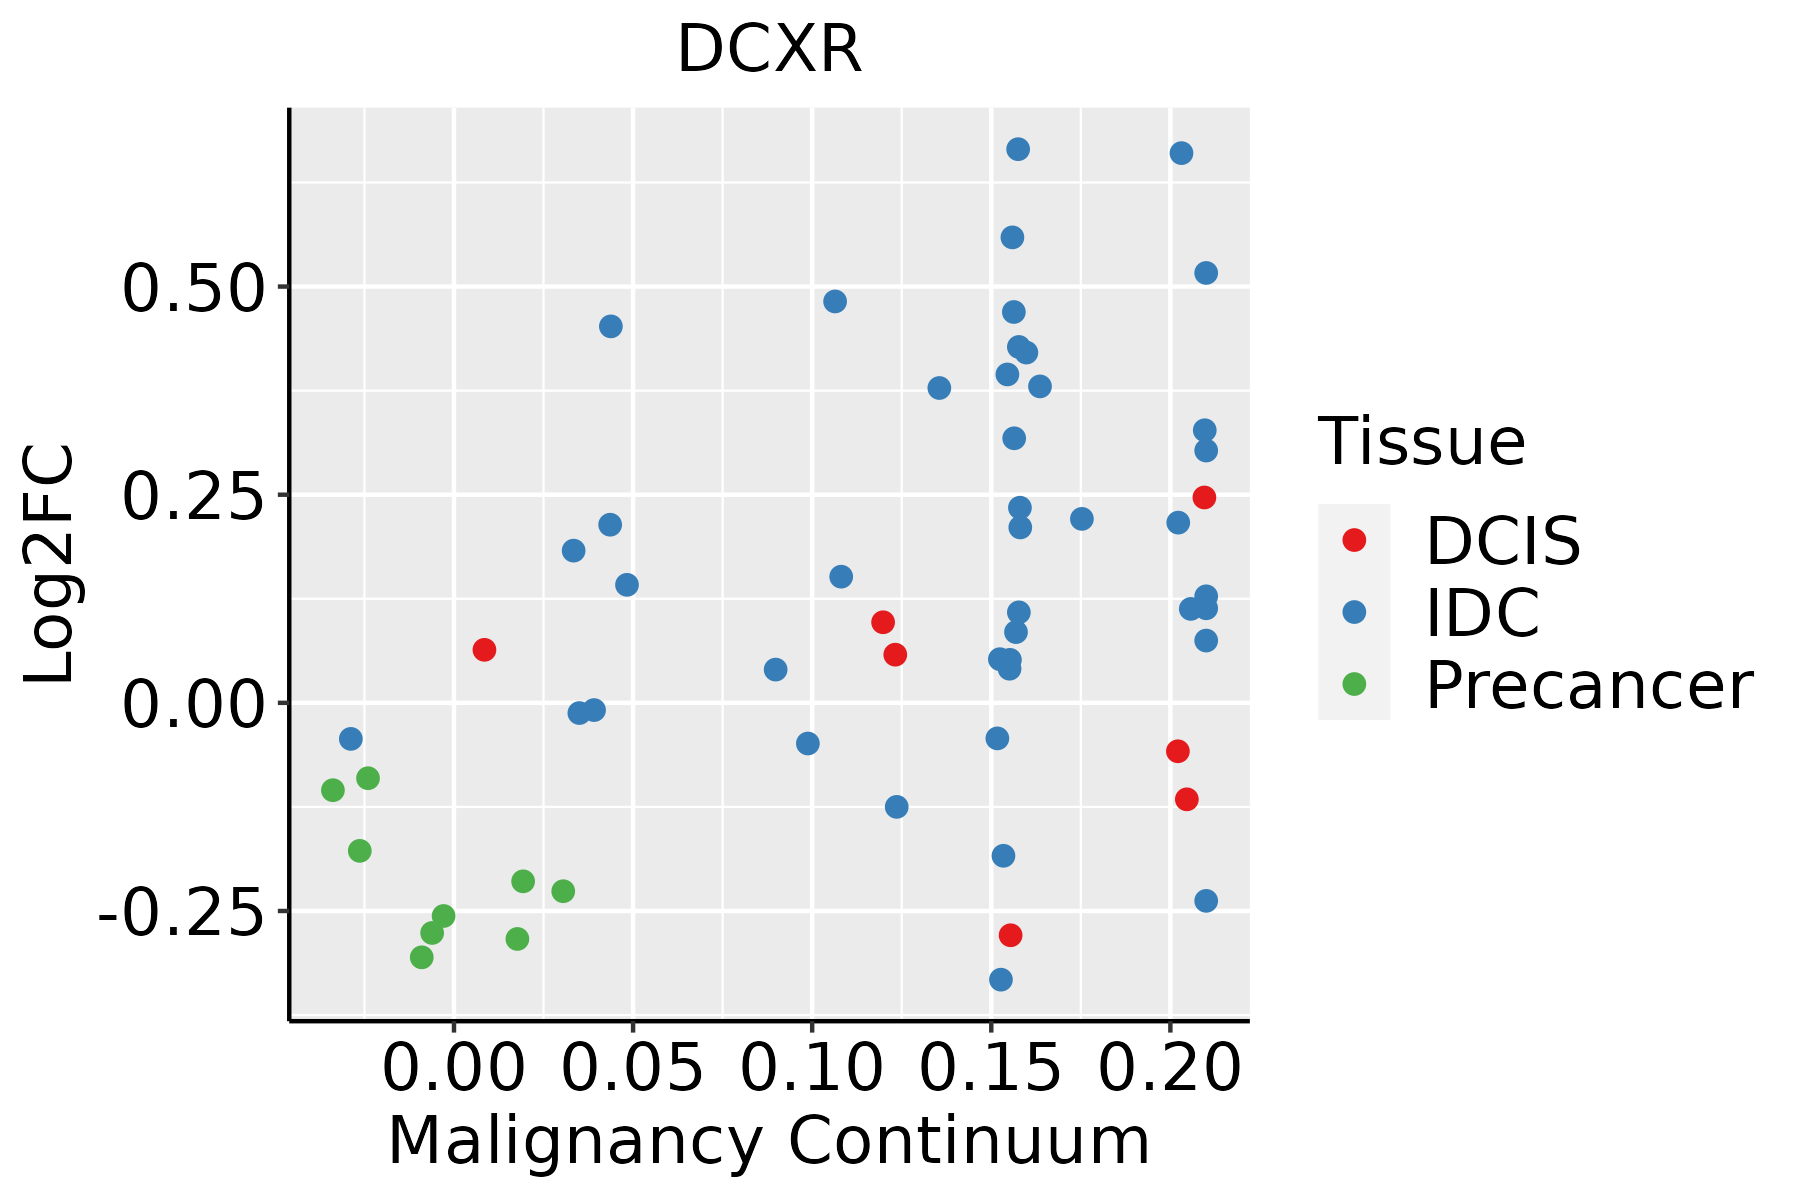 | IDC: Invasive ductal carcinoma |
| DCIS: Ductal carcinoma in situ |
| Precancer(BRCA1-mut): Precancerous lesion from BRCA1 mutation carriers |
| Colorectum (GSE201348) | 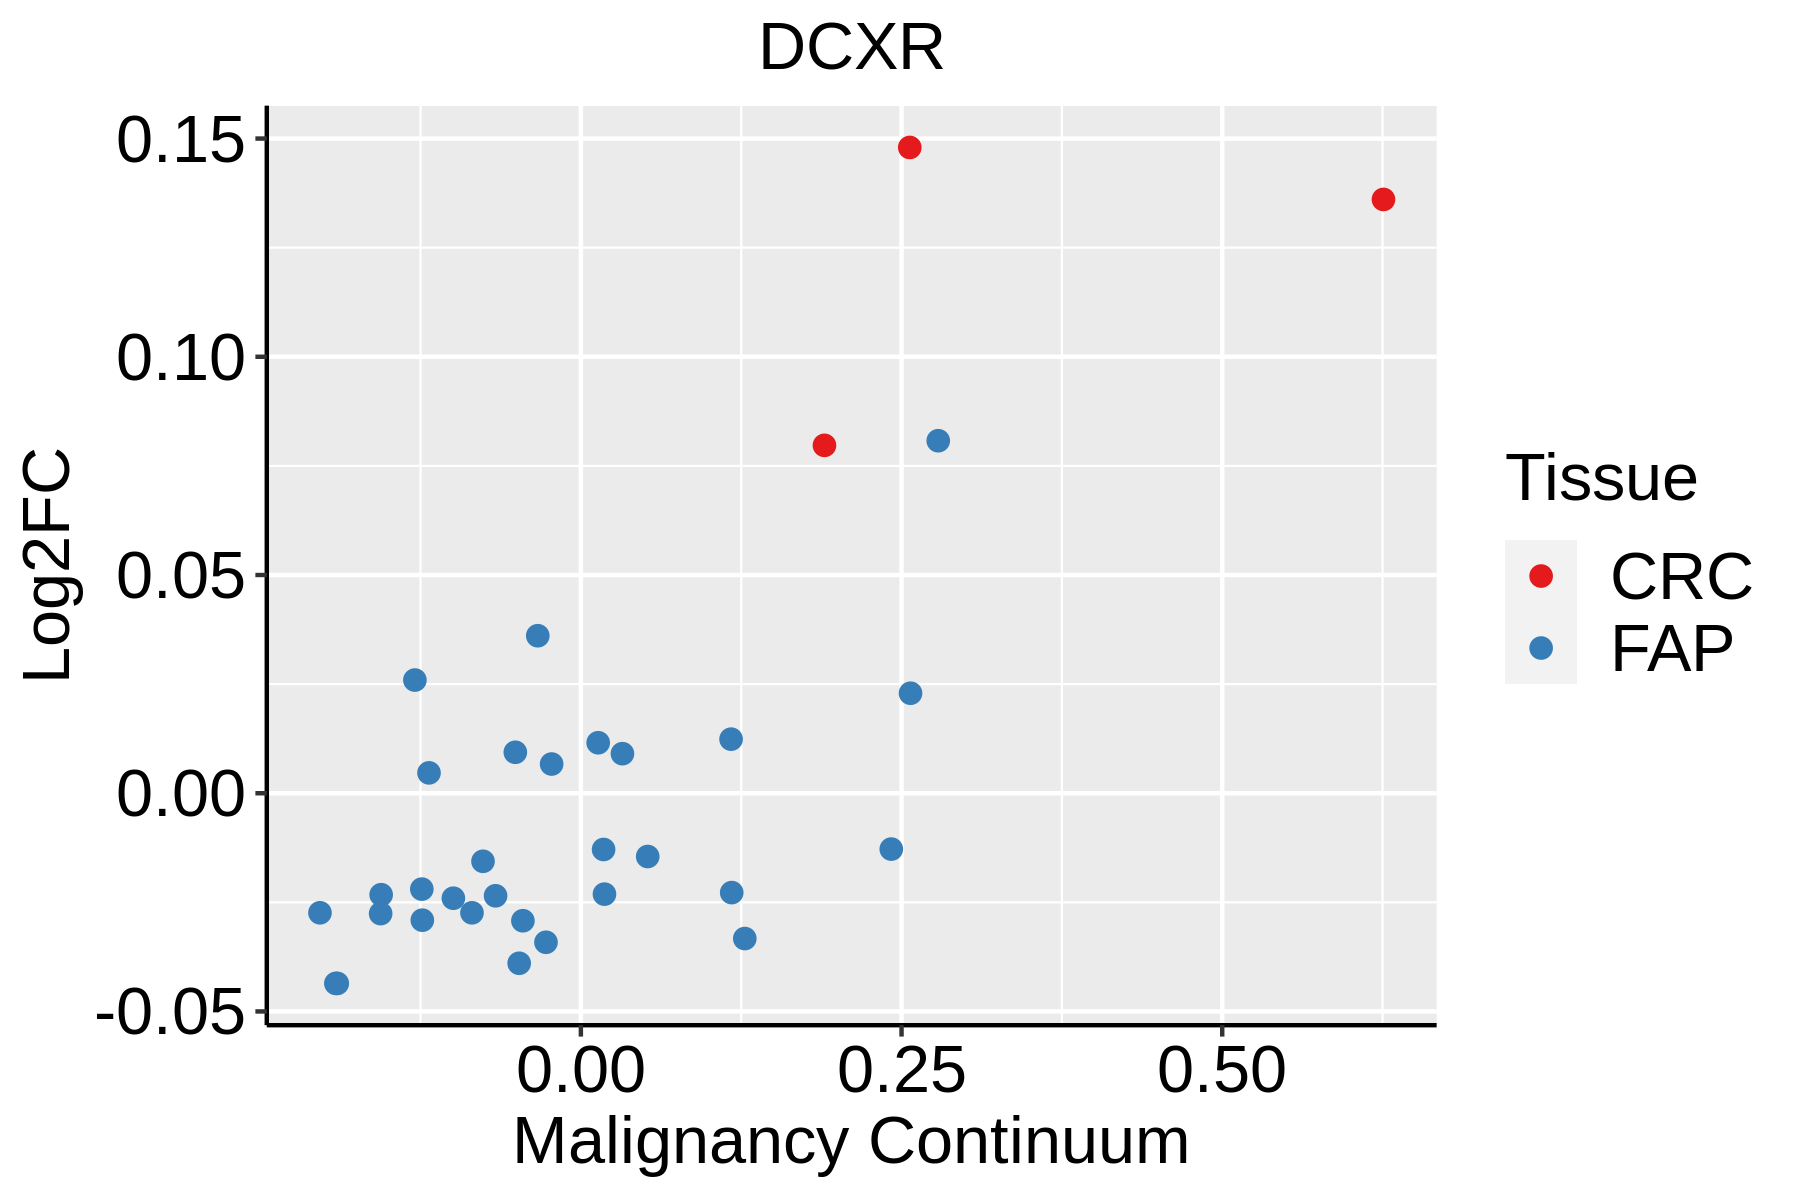 | FAP: Familial adenomatous polyposis |
| CRC: Colorectal cancer |
| Colorectum (HTA11) | 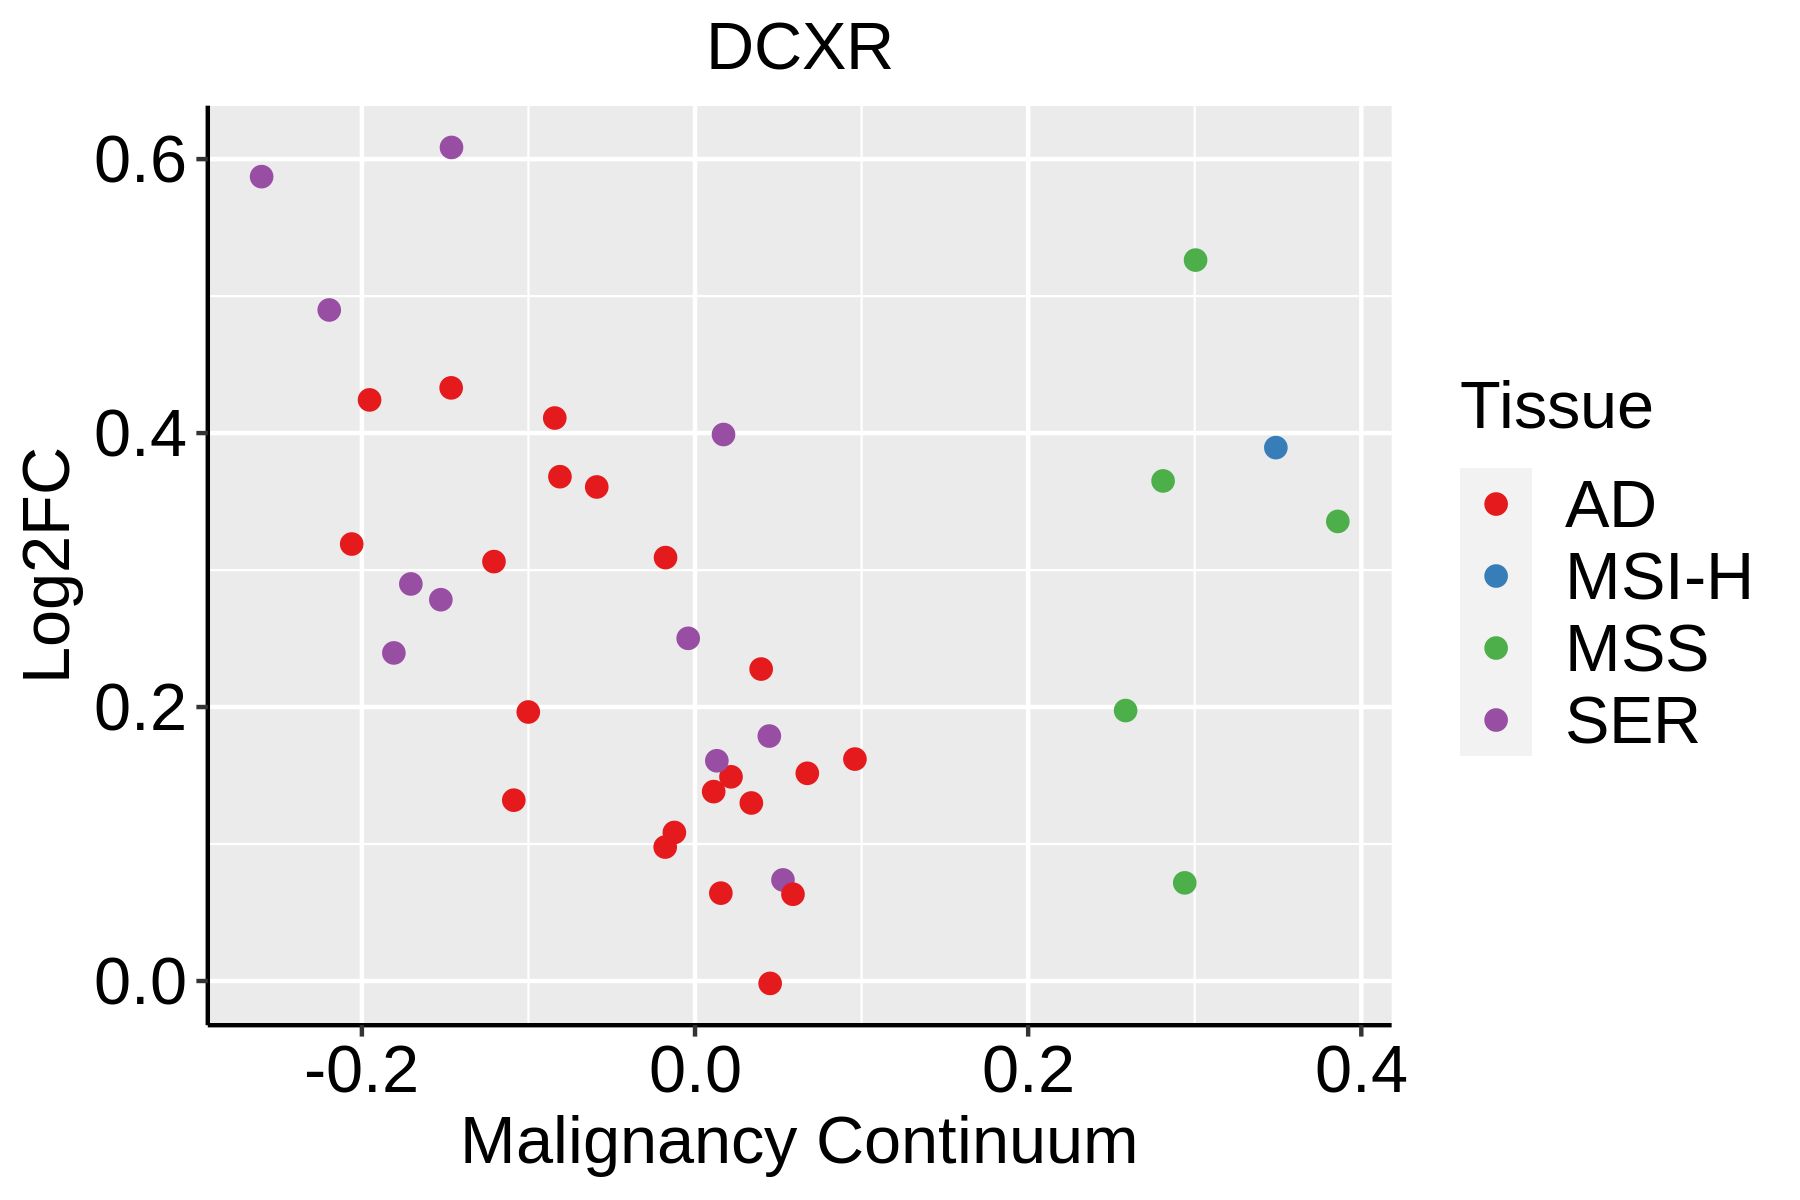 | AD: Adenomas |
| SER: Sessile serrated lesions |
| MSI-H: Microsatellite-high colorectal cancer |
| MSS: Microsatellite stable colorectal cancer |
| Esophagus | 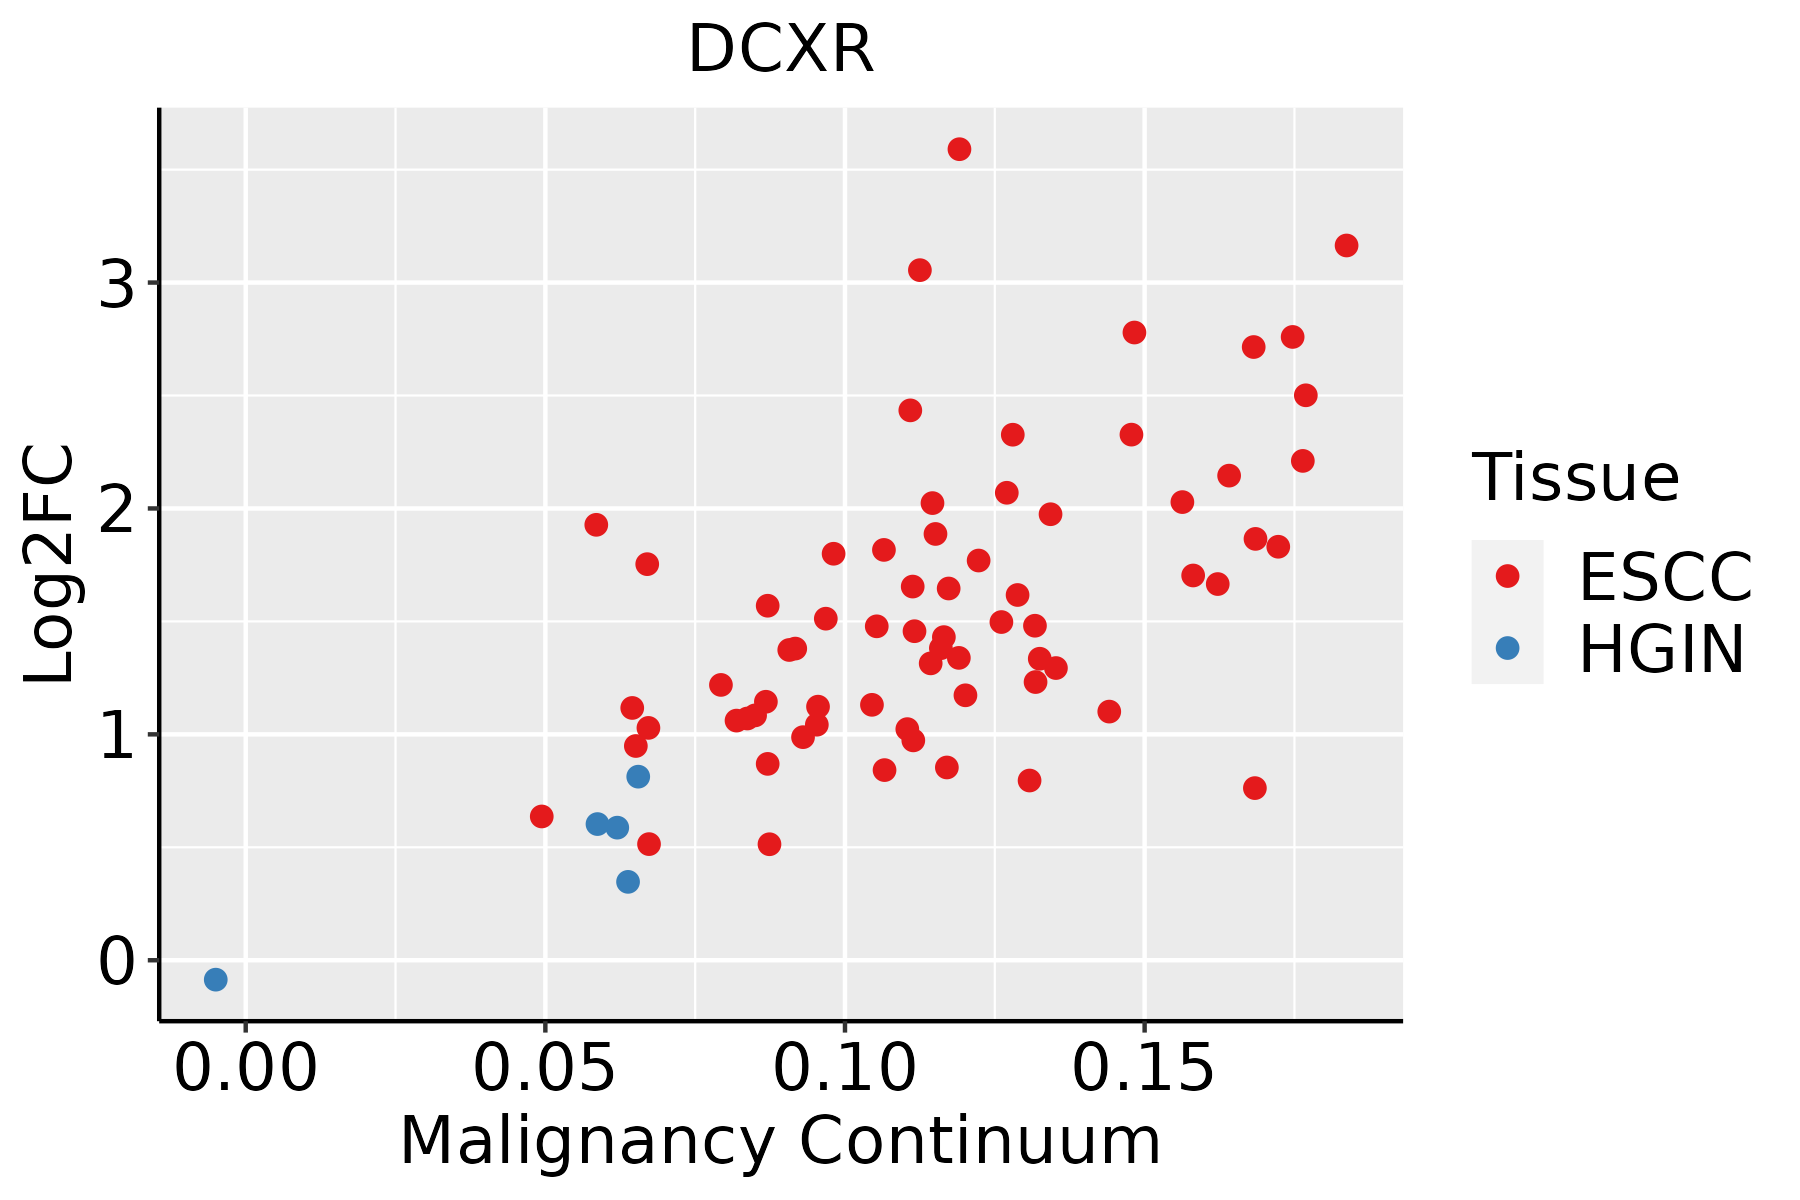 | ESCC: Esophageal squamous cell carcinoma |
| HGIN: High-grade intraepithelial neoplasias |
| LGIN: Low-grade intraepithelial neoplasias |
| Liver | 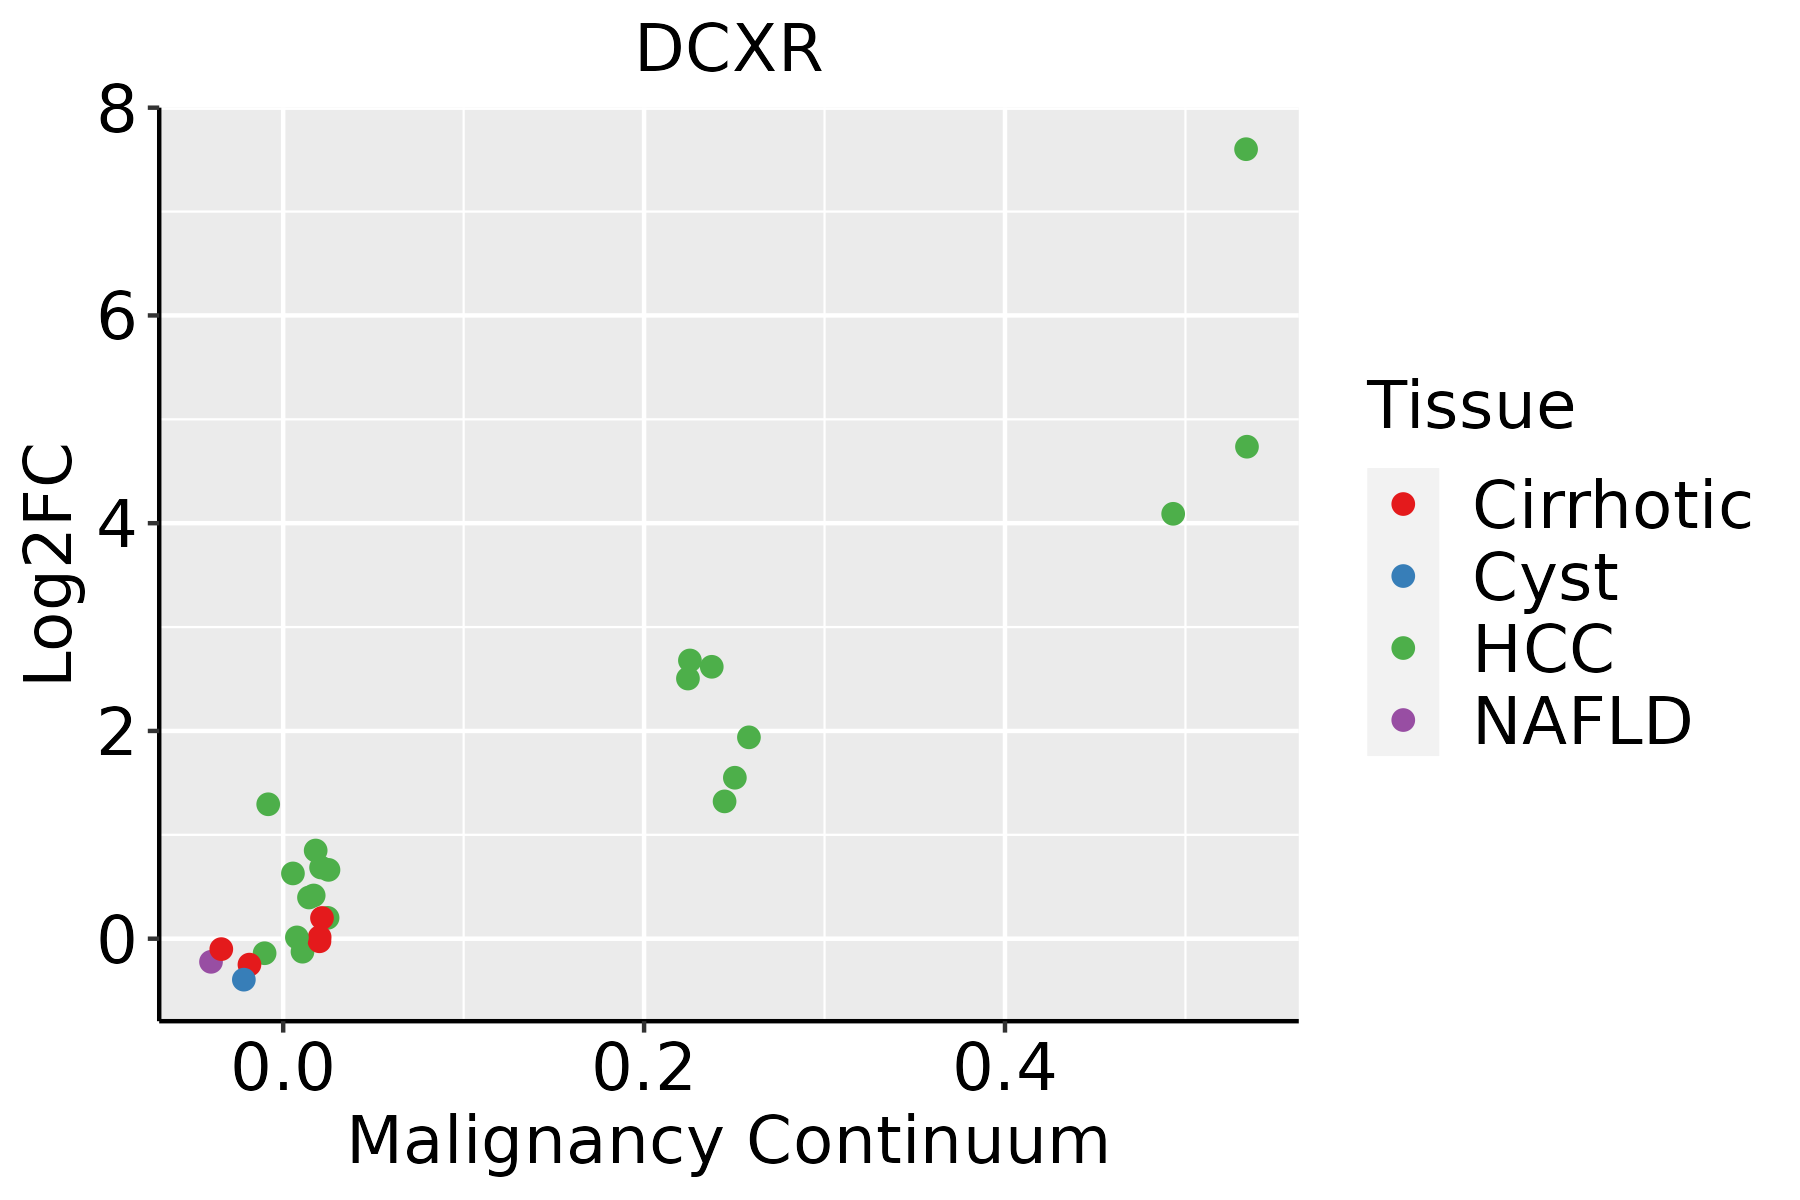 | HCC: Hepatocellular carcinoma |
| NAFLD: Non-alcoholic fatty liver disease |
| Oral Cavity | 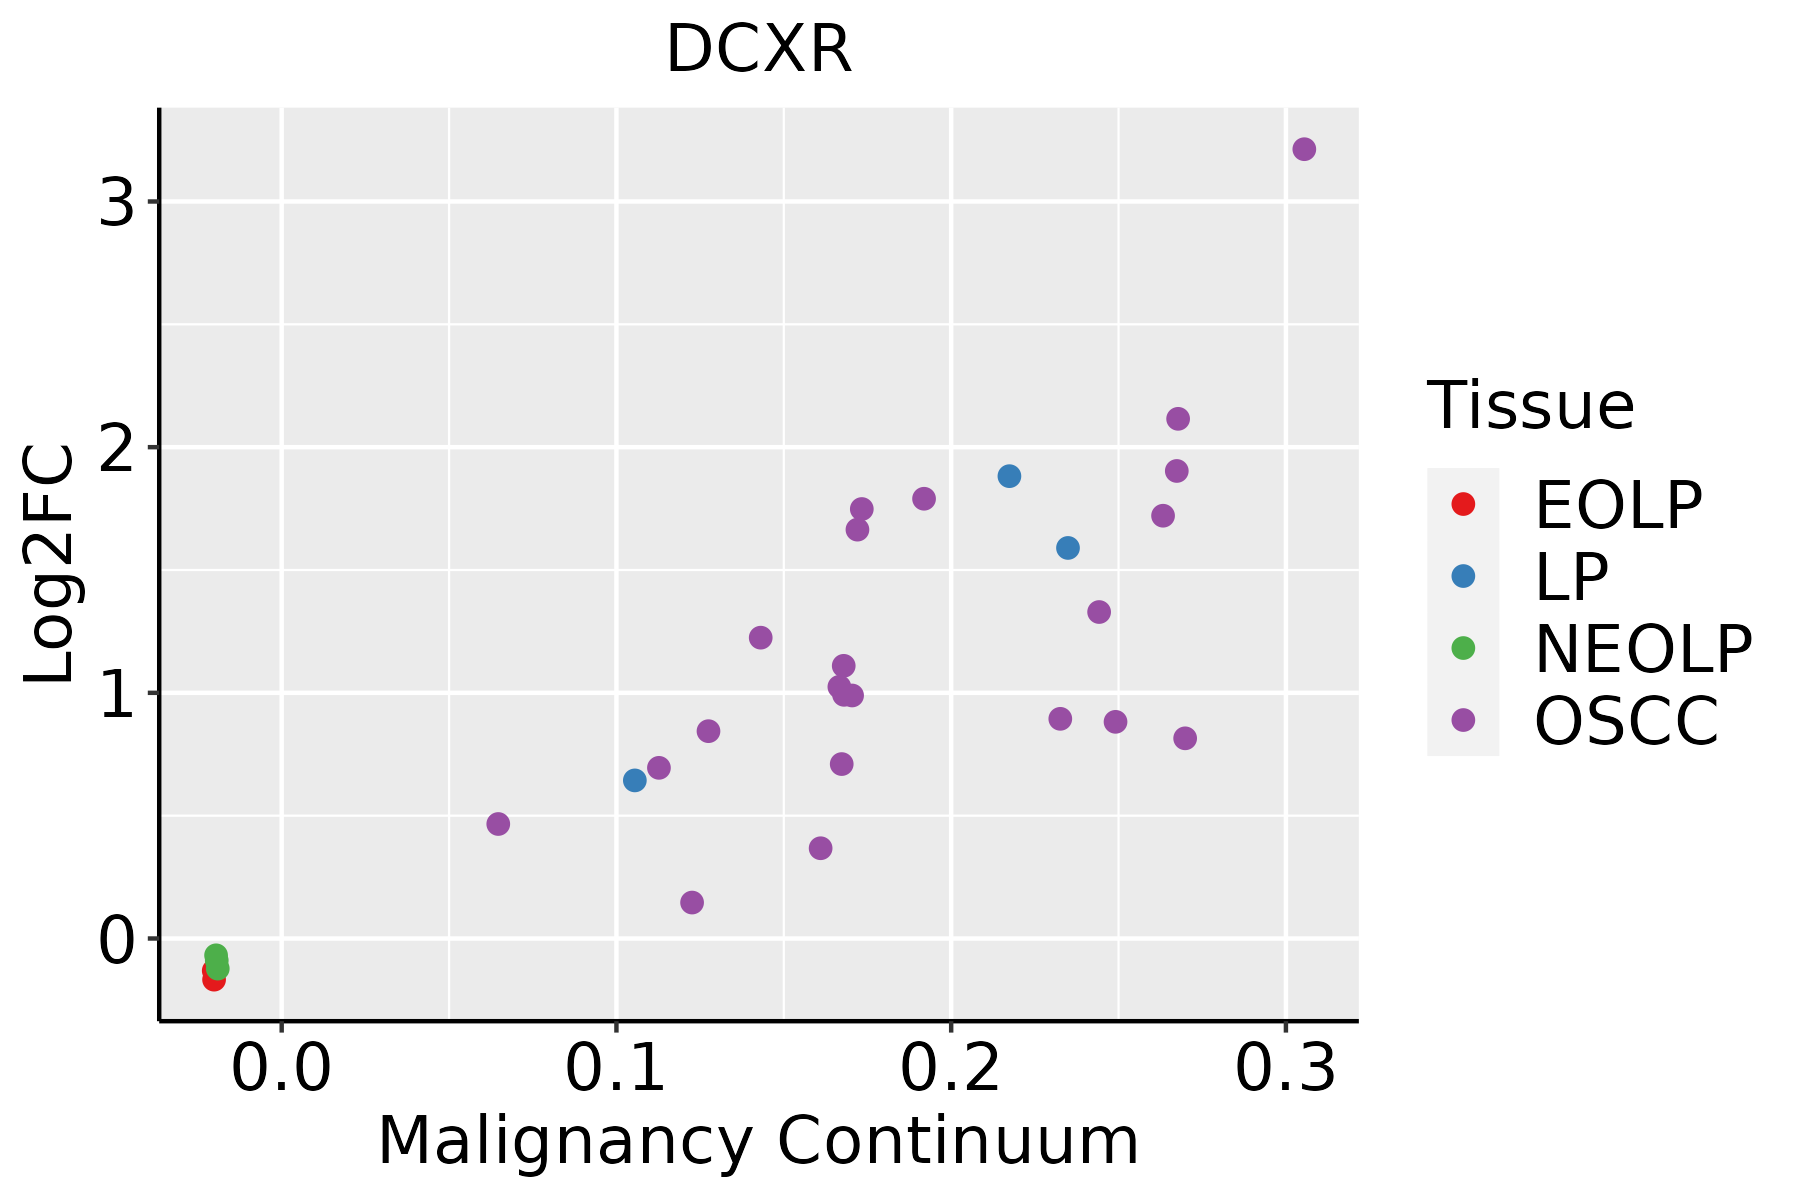 | EOLP: Erosive Oral lichen planus |
| LP: leukoplakia |
| NEOLP: Non-erosive oral lichen planus |
| OSCC: Oral squamous cell carcinoma |
| Prostate | 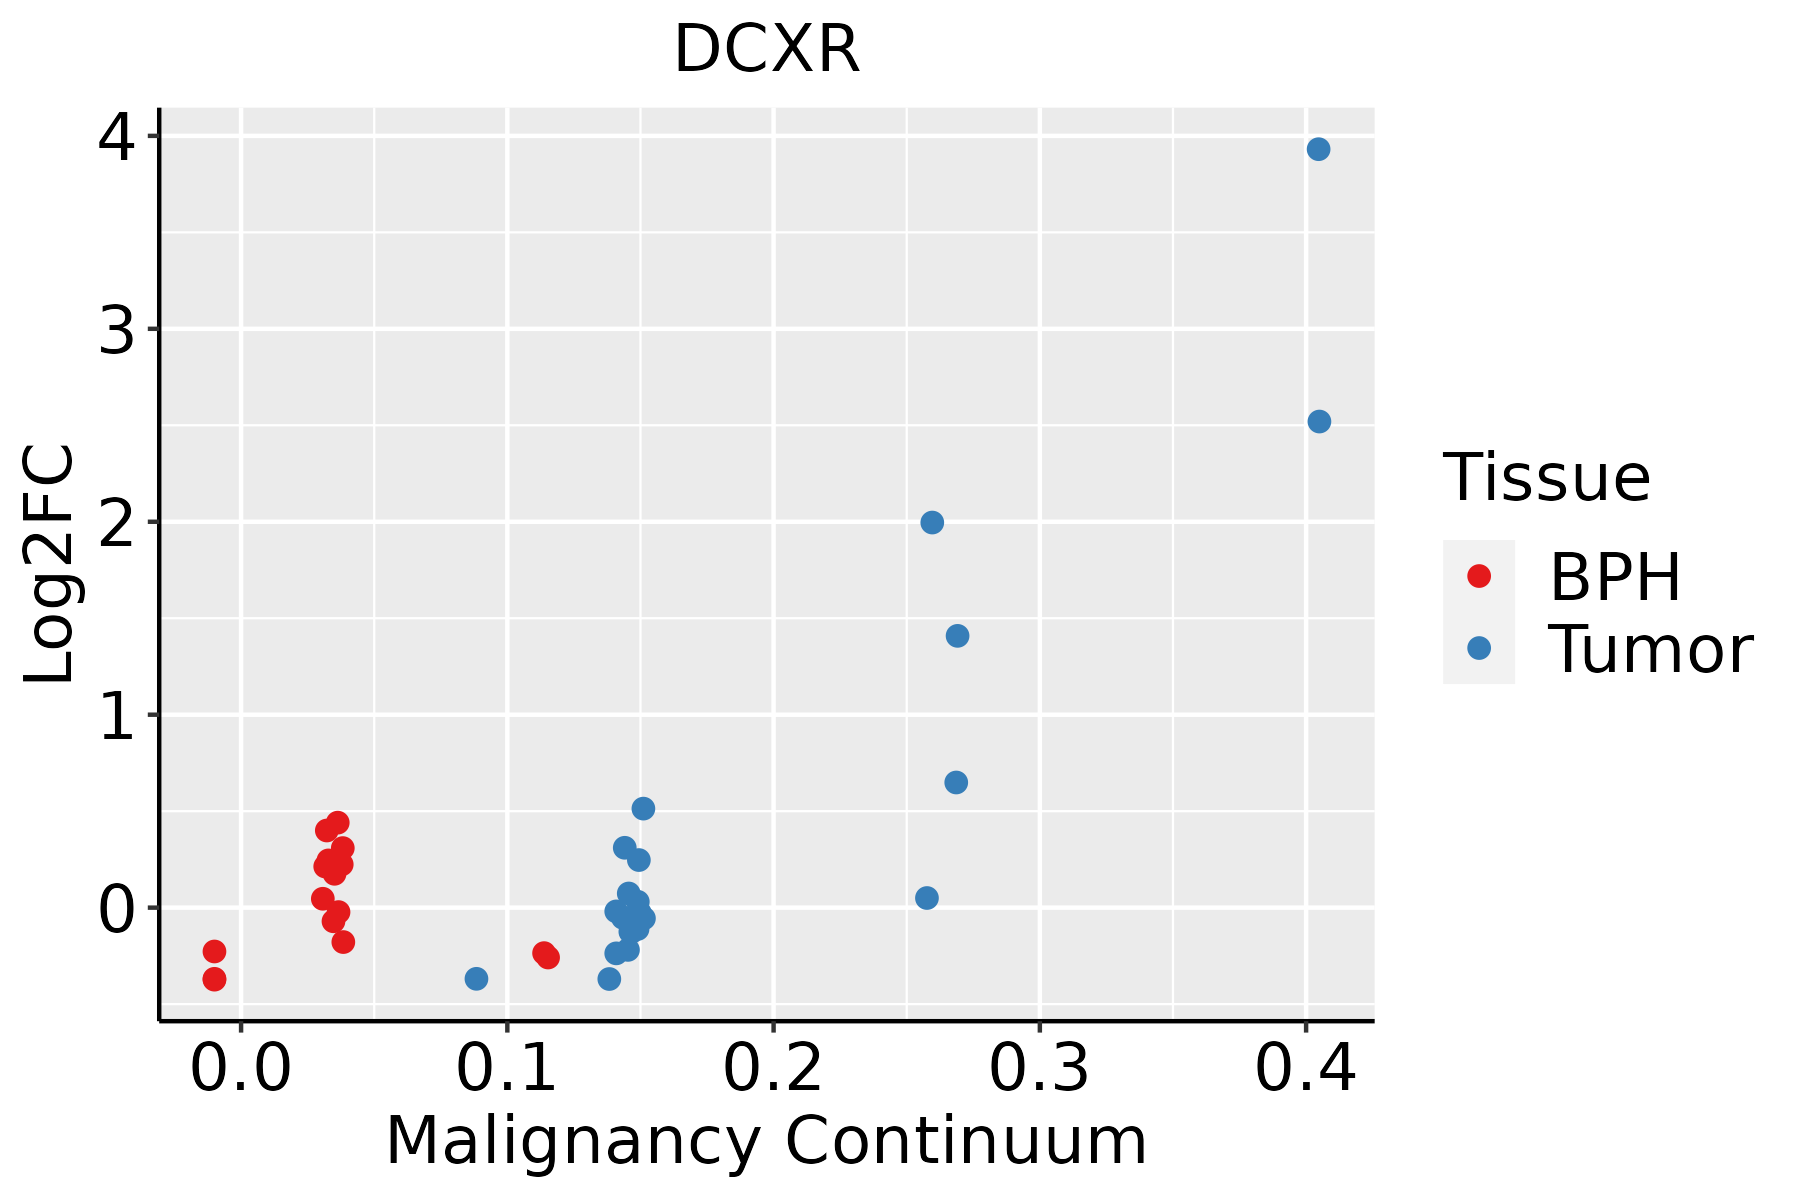 | BPH: Benign Prostatic Hyperplasia |
| Skin | 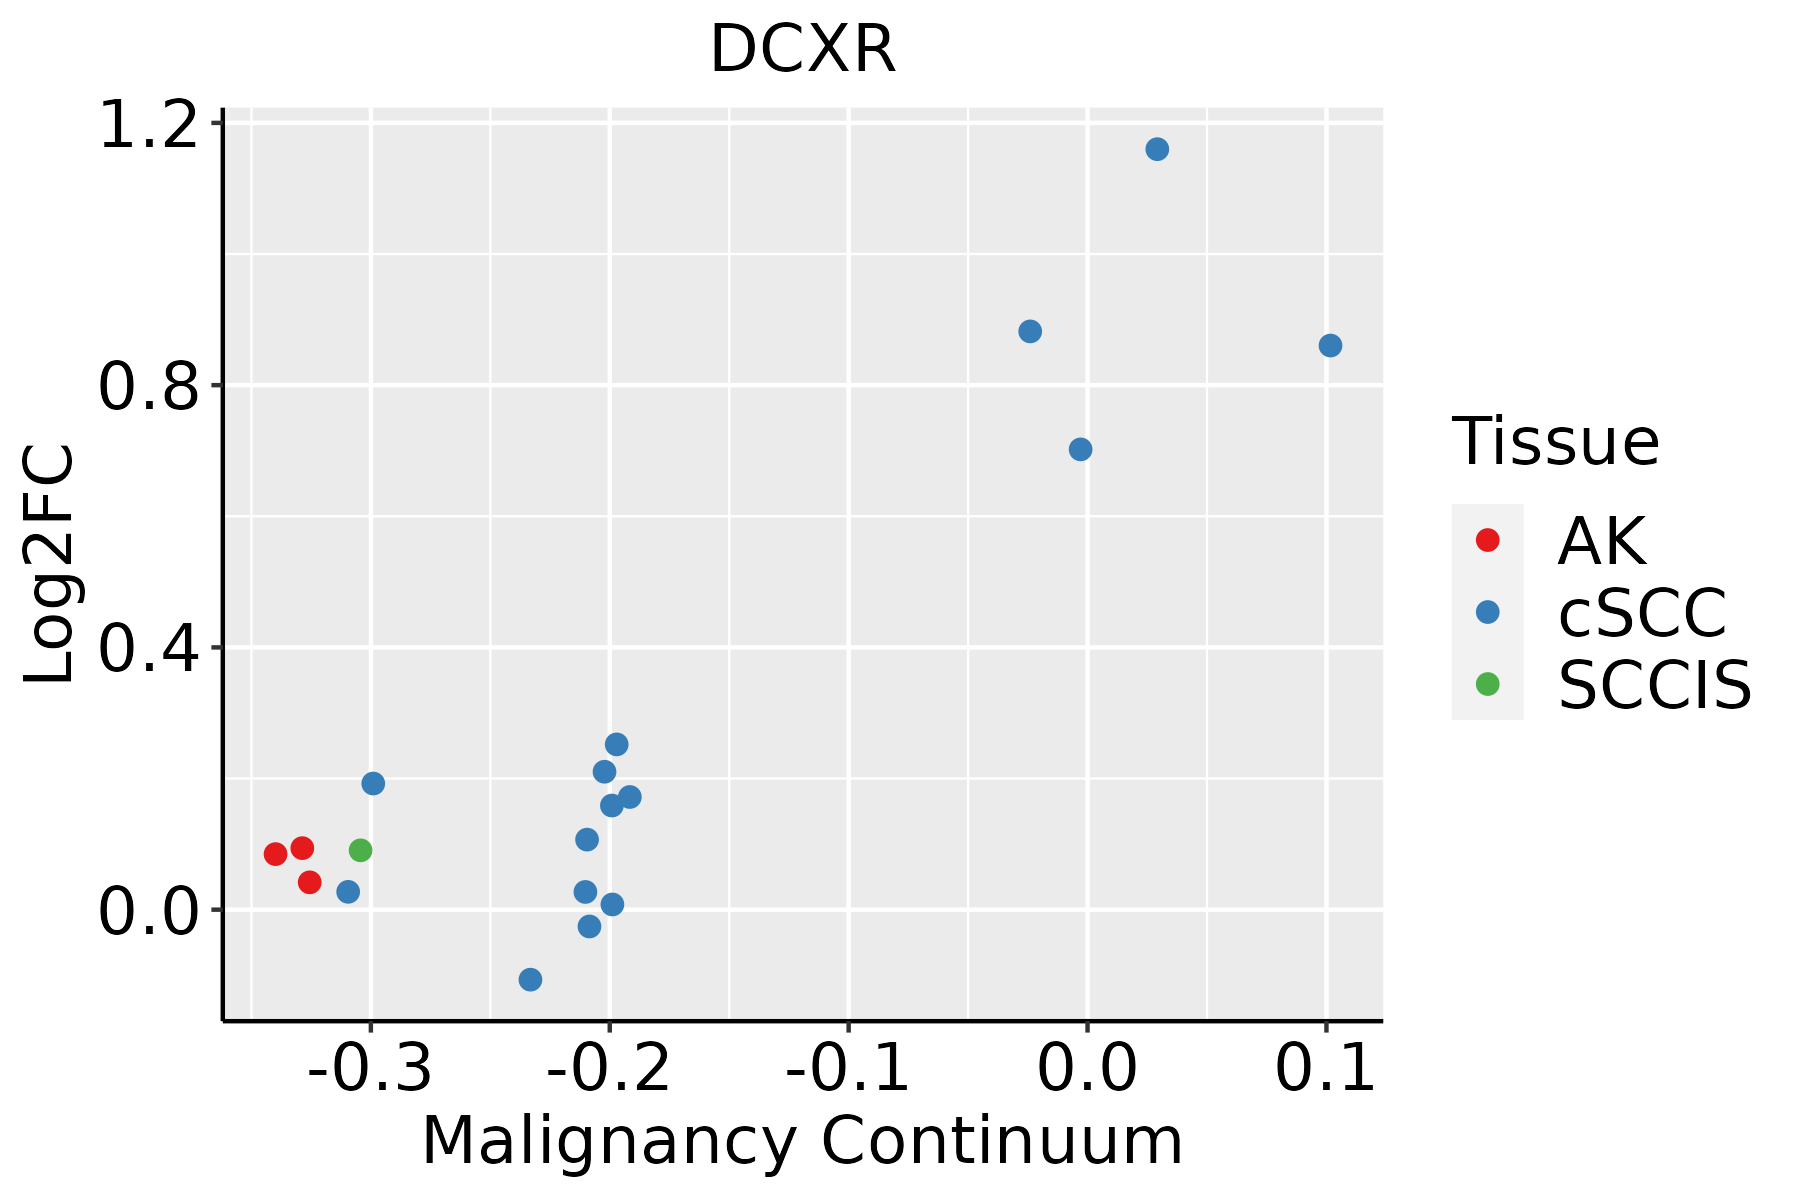 | AK: Actinic keratosis |
| cSCC: Cutaneous squamous cell carcinoma |
| SCCIS:squamous cell carcinoma in situ |
| Thyroid |  | ATC: Anaplastic thyroid cancer |
| HT: Hashimoto's thyroiditis |
| PTC: Papillary thyroid cancer |
| GO ID | Tissue | Disease Stage | Description | Gene Ratio | Bg Ratio | pvalue | p.adjust | Count |
| GO:00725938 | Breast | Precancer | reactive oxygen species metabolic process | 30/1080 | 239/18723 | 5.13e-05 | 1.07e-03 | 30 |
| GO:20003778 | Breast | Precancer | regulation of reactive oxygen species metabolic process | 20/1080 | 157/18723 | 7.19e-04 | 8.65e-03 | 20 |
| GO:00060066 | Breast | Precancer | glucose metabolic process | 23/1080 | 196/18723 | 9.54e-04 | 1.07e-02 | 23 |
| GO:00059966 | Breast | Precancer | monosaccharide metabolic process | 27/1080 | 257/18723 | 1.94e-03 | 1.88e-02 | 27 |
| GO:00193186 | Breast | Precancer | hexose metabolic process | 25/1080 | 237/18723 | 2.64e-03 | 2.36e-02 | 25 |
| GO:20003798 | Breast | Precancer | positive regulation of reactive oxygen species metabolic process | 11/1080 | 76/18723 | 4.08e-03 | 3.22e-02 | 11 |
| GO:007259313 | Breast | IDC | reactive oxygen species metabolic process | 36/1434 | 239/18723 | 7.16e-05 | 1.43e-03 | 36 |
| GO:200037913 | Breast | IDC | positive regulation of reactive oxygen species metabolic process | 14/1434 | 76/18723 | 1.71e-03 | 1.67e-02 | 14 |
| GO:200037713 | Breast | IDC | regulation of reactive oxygen species metabolic process | 22/1434 | 157/18723 | 4.24e-03 | 3.31e-02 | 22 |
| GO:007259322 | Breast | DCIS | reactive oxygen species metabolic process | 37/1390 | 239/18723 | 1.60e-05 | 3.88e-04 | 37 |
| GO:200037922 | Breast | DCIS | positive regulation of reactive oxygen species metabolic process | 15/1390 | 76/18723 | 4.06e-04 | 5.54e-03 | 15 |
| GO:200037723 | Breast | DCIS | regulation of reactive oxygen species metabolic process | 23/1390 | 157/18723 | 1.31e-03 | 1.37e-02 | 23 |
| GO:000600612 | Breast | DCIS | glucose metabolic process | 25/1390 | 196/18723 | 5.59e-03 | 4.06e-02 | 25 |
| GO:0019318 | Colorectum | AD | hexose metabolic process | 77/3918 | 237/18723 | 1.96e-05 | 4.01e-04 | 77 |
| GO:0005996 | Colorectum | AD | monosaccharide metabolic process | 80/3918 | 257/18723 | 7.31e-05 | 1.17e-03 | 80 |
| GO:0006006 | Colorectum | AD | glucose metabolic process | 62/3918 | 196/18723 | 2.76e-04 | 3.39e-03 | 62 |
| GO:0072593 | Colorectum | AD | reactive oxygen species metabolic process | 73/3918 | 239/18723 | 2.79e-04 | 3.42e-03 | 73 |
| GO:2000379 | Colorectum | AD | positive regulation of reactive oxygen species metabolic process | 29/3918 | 76/18723 | 4.31e-04 | 4.82e-03 | 29 |
| GO:2000377 | Colorectum | AD | regulation of reactive oxygen species metabolic process | 48/3918 | 157/18723 | 2.77e-03 | 2.09e-02 | 48 |
| GO:00725931 | Colorectum | SER | reactive oxygen species metabolic process | 61/2897 | 239/18723 | 3.63e-05 | 9.39e-04 | 61 |
| Hugo Symbol | Variant Class | Variant Classification | dbSNP RS | HGVSc | HGVSp | HGVSp Short | SWISSPROT | BIOTYPE | SIFT | PolyPhen | Tumor Sample Barcode | Tissue | Histology | Sex | Age | Stage | Therapy Types | Drugs | Outcome |
| DCXR | insertion | Frame_Shift_Ins | novel | c.639_640insGAGATGCCCTCAGCACC | p.His214GlufsTer9 | p.H214Efs*9 | Q7Z4W1 | protein_coding | | | TCGA-BH-A0BR-01 | Breast | breast invasive carcinoma | Female | <65 | I/II | Unknown | Unknown | SD |
| DCXR | SNV | Missense_Mutation | novel | c.301N>A | p.Asp101Asn | p.D101N | Q7Z4W1 | protein_coding | tolerated(0.06) | possibly_damaging(0.748) | TCGA-ZJ-AAXB-01 | Cervix | cervical & endocervical cancer | Female | <65 | I/II | Unknown | Unknown | SD |
| DCXR | insertion | In_Frame_Ins | novel | c.513_513+1insTGCTCTACCTCT | p.Lys171_Ile172insCysSerThrSer | p.K171_I172insCSTS | Q7Z4W1 | protein_coding | | | TCGA-DS-A1OB-01 | Cervix | cervical & endocervical cancer | Female | <65 | I/II | Chemotherapy | carboplatin | PD |
| DCXR | SNV | Missense_Mutation | rs776627238 | c.28N>T | p.Val10Leu | p.V10L | Q7Z4W1 | protein_coding | deleterious(0.04) | benign(0.005) | TCGA-DM-A1HB-01 | Colorectum | colon adenocarcinoma | Male | >=65 | III/IV | Unknown | Unknown | SD |
| DCXR | SNV | Missense_Mutation | novel | c.398N>G | p.Asn133Ser | p.N133S | Q7Z4W1 | protein_coding | deleterious(0.02) | probably_damaging(0.996) | TCGA-A5-A1OF-01 | Endometrium | uterine corpus endometrioid carcinoma | Female | <65 | I/II | Unknown | Unknown | SD |
| DCXR | SNV | Missense_Mutation | novel | c.639N>T | p.Glu213Asp | p.E213D | Q7Z4W1 | protein_coding | tolerated(0.38) | benign(0) | TCGA-AJ-A3EL-01 | Endometrium | uterine corpus endometrioid carcinoma | Female | <65 | I/II | Unknown | Unknown | SD |
| DCXR | SNV | Missense_Mutation | | c.573N>T | p.Trp191Cys | p.W191C | Q7Z4W1 | protein_coding | deleterious(0) | probably_damaging(0.984) | TCGA-AP-A059-01 | Endometrium | uterine corpus endometrioid carcinoma | Female | >=65 | I/II | Unknown | Unknown | SD |
| DCXR | SNV | Missense_Mutation | novel | c.173N>A | p.Cys58Tyr | p.C58Y | Q7Z4W1 | protein_coding | tolerated(0.1) | benign(0.203) | TCGA-AX-A2HD-01 | Endometrium | uterine corpus endometrioid carcinoma | Female | >=65 | III/IV | Unknown | Unknown | SD |
| DCXR | SNV | Missense_Mutation | novel | c.599T>C | p.Met200Thr | p.M200T | Q7Z4W1 | protein_coding | deleterious(0) | possibly_damaging(0.756) | TCGA-EO-A22U-01 | Endometrium | uterine corpus endometrioid carcinoma | Female | >=65 | I/II | Unknown | Unknown | SD |
| DCXR | SNV | Missense_Mutation | novel | c.158G>A | p.Gly53Glu | p.G53E | Q7Z4W1 | protein_coding | tolerated(0.13) | benign(0.18) | TCGA-EO-A3AY-01 | Endometrium | uterine corpus endometrioid carcinoma | Female | <65 | I/II | Unknown | Unknown | PD |


