
|
|||||
|
 | |
| |
| |
| |
| |
| |
|
Gene: CUTA |
Gene summary for CUTA |
| Gene information | Species | Human | Gene symbol | CUTA | Gene ID | 51596 |
| Gene name | cutA divalent cation tolerance homolog | |
| Gene Alias | ACHAP | |
| Cytomap | 6p21.32 | |
| Gene Type | protein-coding | GO ID | GO:0008104 | UniProtAcc | O60888 |
Top |
Malignant transformation analysis |
| Identification of the aberrant gene expression in precancerous and cancerous lesions by comparing the gene expression of stem-like cells in diseased tissues with normal stem cells |
| Entrez ID | Symbol | Replicates | Species | Organ | Tissue | Adj P-value | Log2FC | Malignancy |
| 51596 | CUTA | NCCBC2 | Human | Breast | DCIS | 9.00e-06 | -1.46e-01 | 0.1554 |
| 51596 | CUTA | NCCBC3 | Human | Breast | DCIS | 1.93e-04 | -6.72e-02 | 0.1198 |
| 51596 | CUTA | NCCBC5 | Human | Breast | DCIS | 6.78e-19 | -2.58e-01 | 0.2046 |
| 51596 | CUTA | P1 | Human | Breast | IDC | 5.65e-35 | -4.87e-01 | 0.1527 |
| 51596 | CUTA | DCIS2 | Human | Breast | DCIS | 3.15e-45 | 1.29e-01 | 0.0085 |
| 51596 | CUTA | CA_HPV_1 | Human | Cervix | CC | 3.03e-19 | -4.85e-01 | 0.0264 |
| 51596 | CUTA | CA_HPV_3 | Human | Cervix | CC | 3.28e-05 | 4.91e-02 | 0.0414 |
| 51596 | CUTA | CCI_1 | Human | Cervix | CC | 3.15e-09 | -7.24e-01 | 0.528 |
| 51596 | CUTA | CCI_2 | Human | Cervix | CC | 1.85e-03 | -5.78e-01 | 0.5249 |
| 51596 | CUTA | CCI_3 | Human | Cervix | CC | 7.12e-12 | -7.07e-01 | 0.516 |
| 51596 | CUTA | CCII_1 | Human | Cervix | CC | 1.41e-25 | -7.85e-01 | 0.3249 |
| 51596 | CUTA | sample3 | Human | Cervix | CC | 1.10e-05 | -2.18e-01 | 0.1387 |
| 51596 | CUTA | H2 | Human | Cervix | HSIL_HPV | 4.56e-03 | -2.73e-01 | 0.0632 |
| 51596 | CUTA | L1 | Human | Cervix | CC | 2.83e-07 | -3.93e-01 | 0.0802 |
| 51596 | CUTA | T3 | Human | Cervix | CC | 1.39e-05 | -2.51e-01 | 0.1389 |
| 51596 | CUTA | HTA11_3410_2000001011 | Human | Colorectum | AD | 1.43e-25 | 4.59e-01 | 0.0155 |
| 51596 | CUTA | HTA11_2487_2000001011 | Human | Colorectum | SER | 1.05e-15 | 5.81e-01 | -0.1808 |
| 51596 | CUTA | HTA11_2951_2000001011 | Human | Colorectum | AD | 5.61e-08 | 6.18e-01 | 0.0216 |
| 51596 | CUTA | HTA11_1938_2000001011 | Human | Colorectum | AD | 4.67e-26 | 7.53e-01 | -0.0811 |
| 51596 | CUTA | HTA11_78_2000001011 | Human | Colorectum | AD | 1.09e-04 | 2.98e-01 | -0.1088 |
| Page: 1 2 3 4 5 6 7 8 9 10 11 12 13 |
| Tissue | Expression Dynamics | Abbreviation |
| Breast | 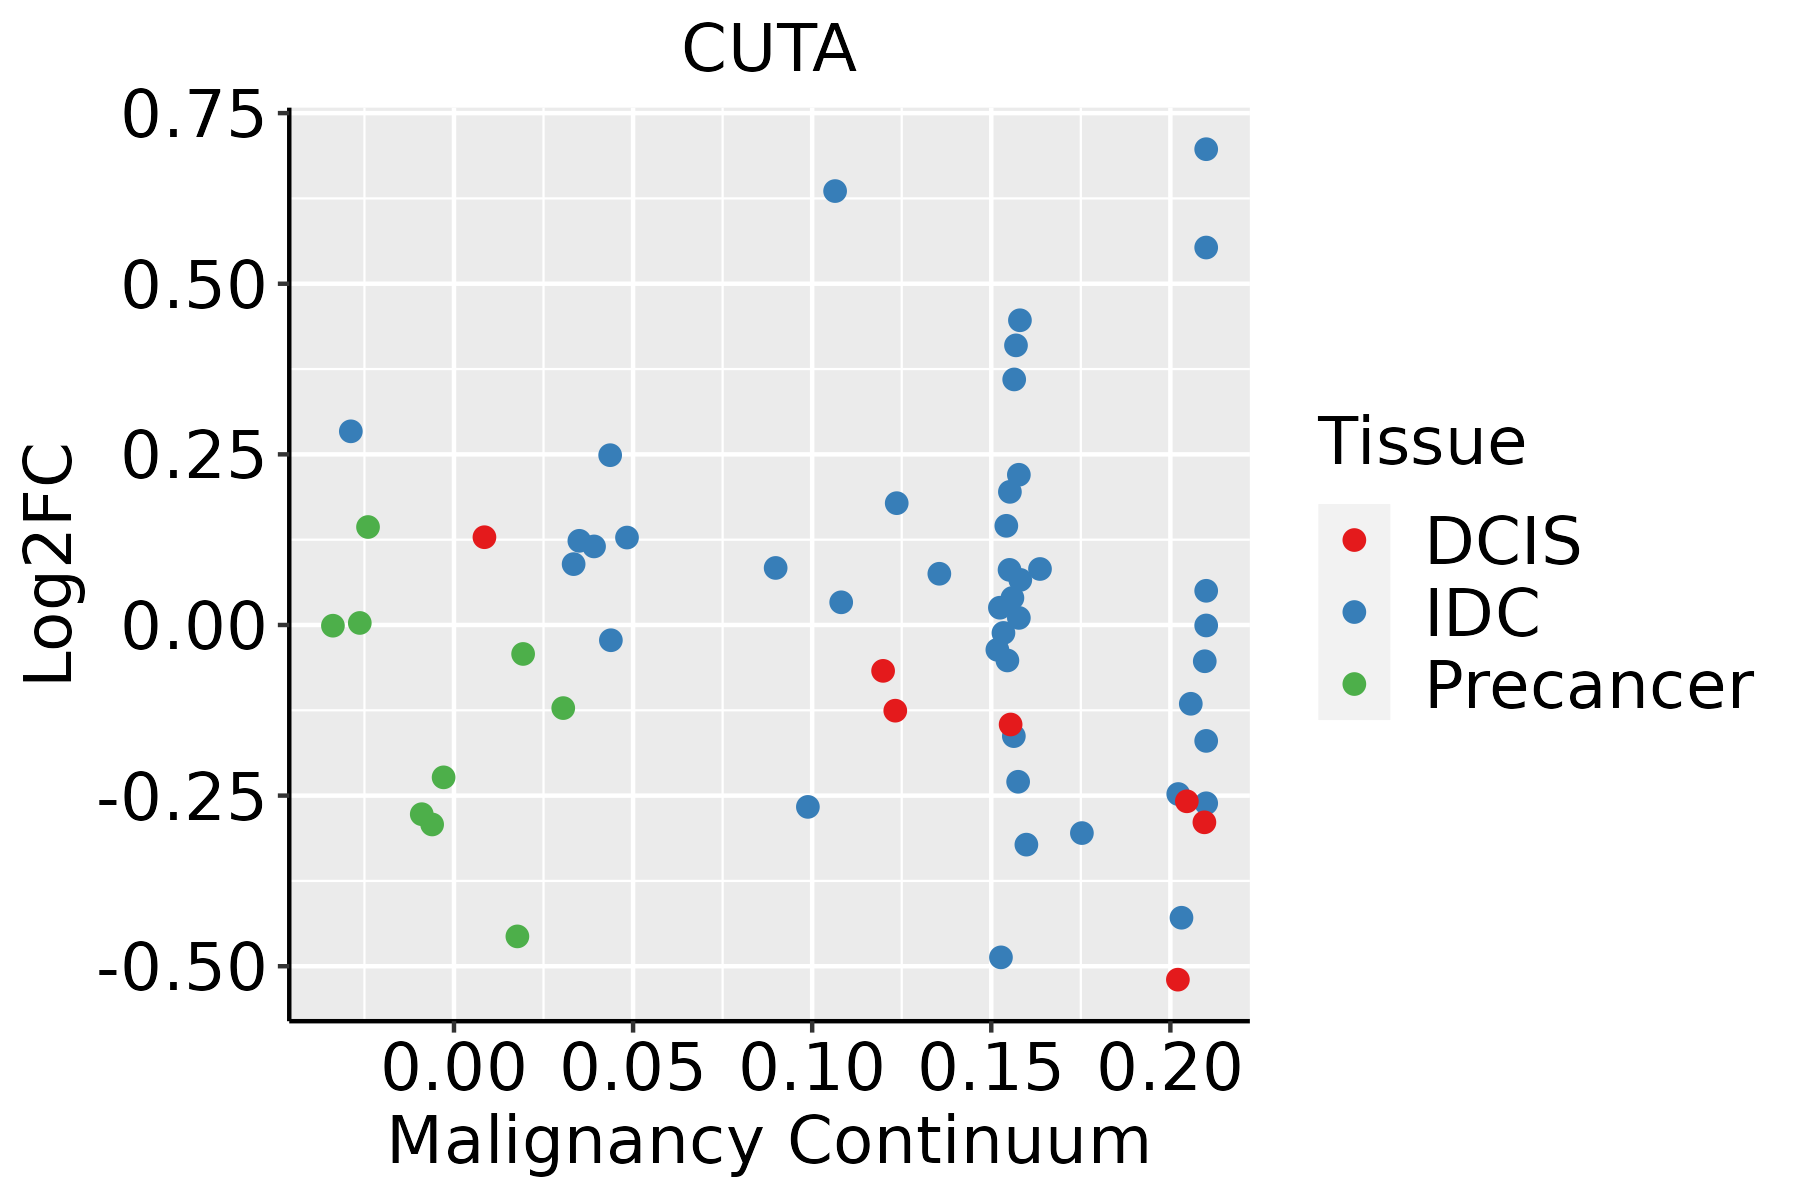 | IDC: Invasive ductal carcinoma |
| DCIS: Ductal carcinoma in situ | ||
| Precancer(BRCA1-mut): Precancerous lesion from BRCA1 mutation carriers | ||
| Cervix |  | CC: Cervix cancer |
| HSIL_HPV: HPV-infected high-grade squamous intraepithelial lesions | ||
| N_HPV: HPV-infected normal cervix | ||
| Colorectum (GSE201348) |  | FAP: Familial adenomatous polyposis |
| CRC: Colorectal cancer | ||
| Colorectum (HTA11) |  | AD: Adenomas |
| SER: Sessile serrated lesions | ||
| MSI-H: Microsatellite-high colorectal cancer | ||
| MSS: Microsatellite stable colorectal cancer | ||
| Endometrium |  | AEH: Atypical endometrial hyperplasia |
| EEC: Endometrioid Cancer | ||
| Esophagus | 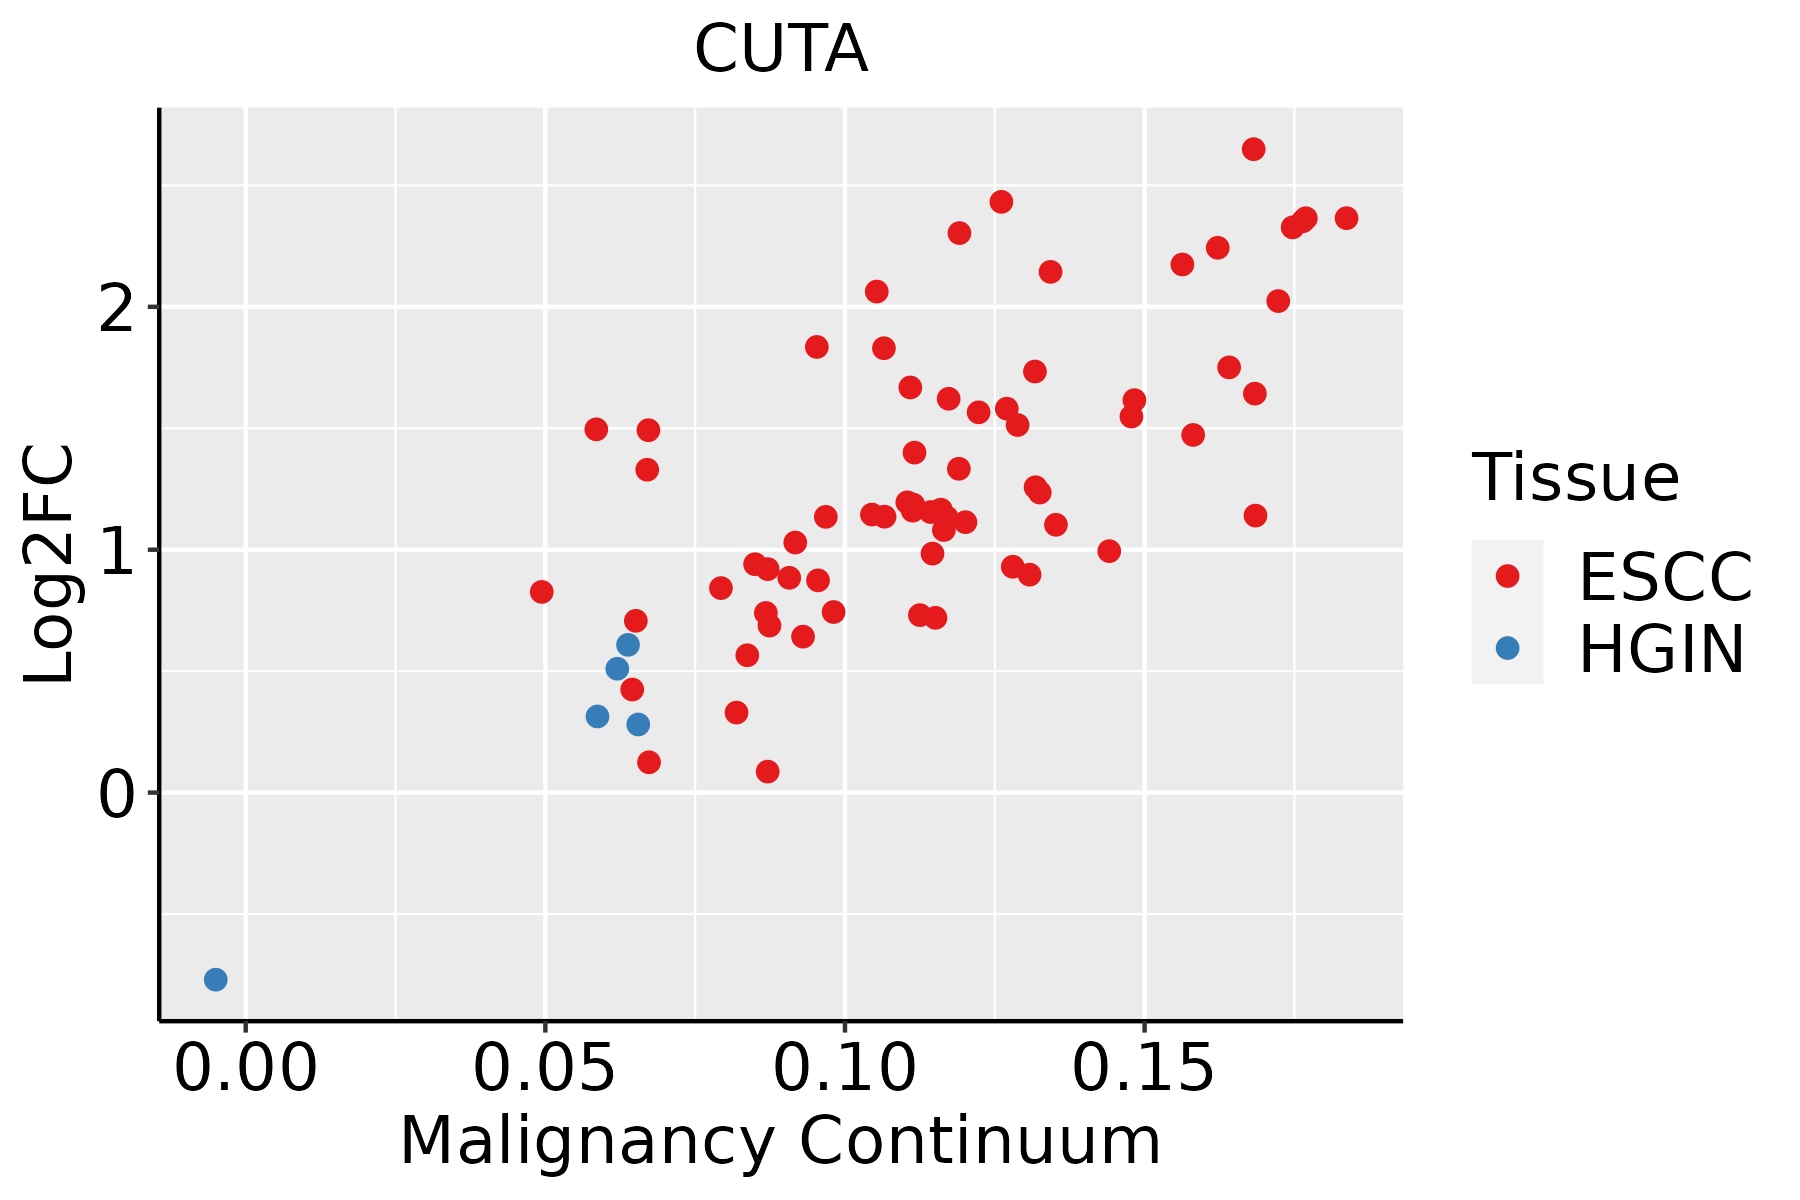 | ESCC: Esophageal squamous cell carcinoma |
| HGIN: High-grade intraepithelial neoplasias | ||
| LGIN: Low-grade intraepithelial neoplasias | ||
| Liver | 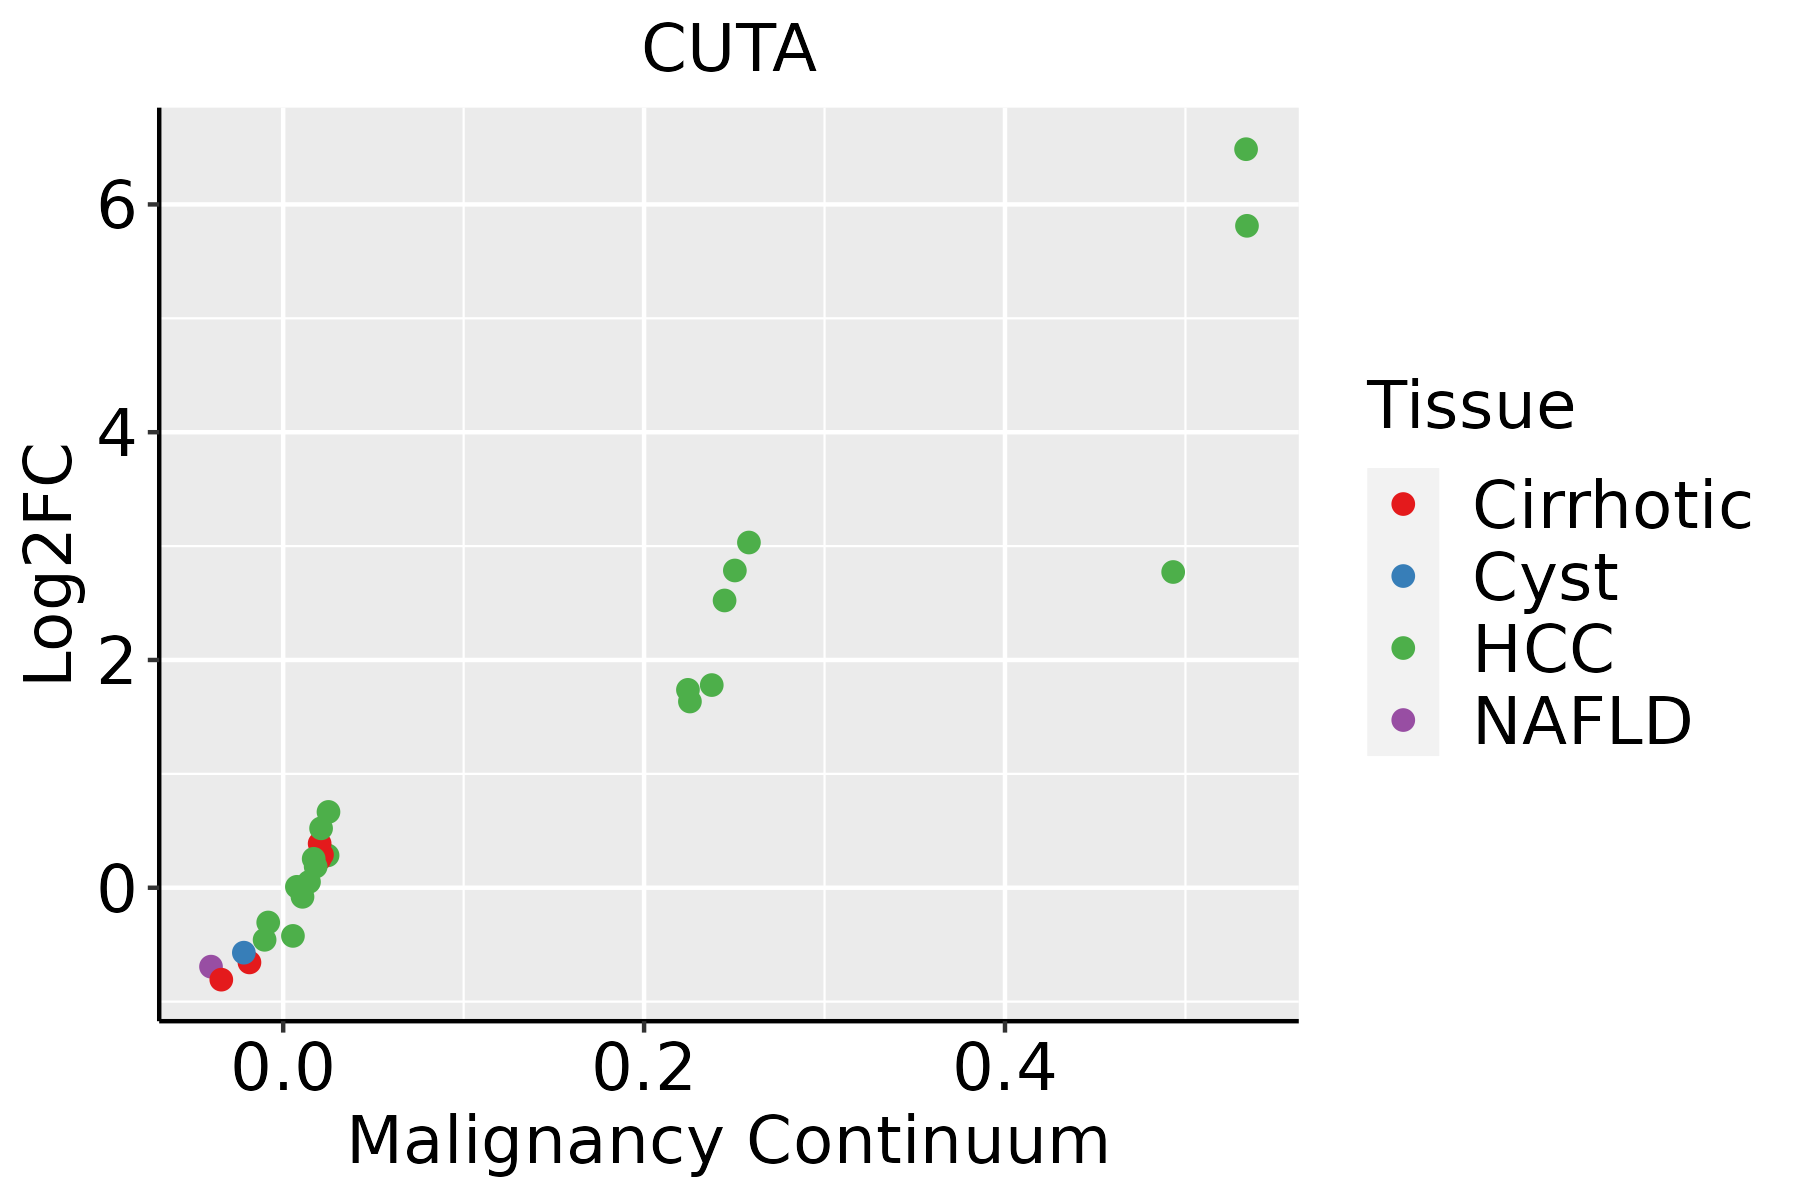 | HCC: Hepatocellular carcinoma |
| NAFLD: Non-alcoholic fatty liver disease | ||
| Oral Cavity |  | EOLP: Erosive Oral lichen planus |
| LP: leukoplakia | ||
| NEOLP: Non-erosive oral lichen planus | ||
| OSCC: Oral squamous cell carcinoma | ||
| Prostate | 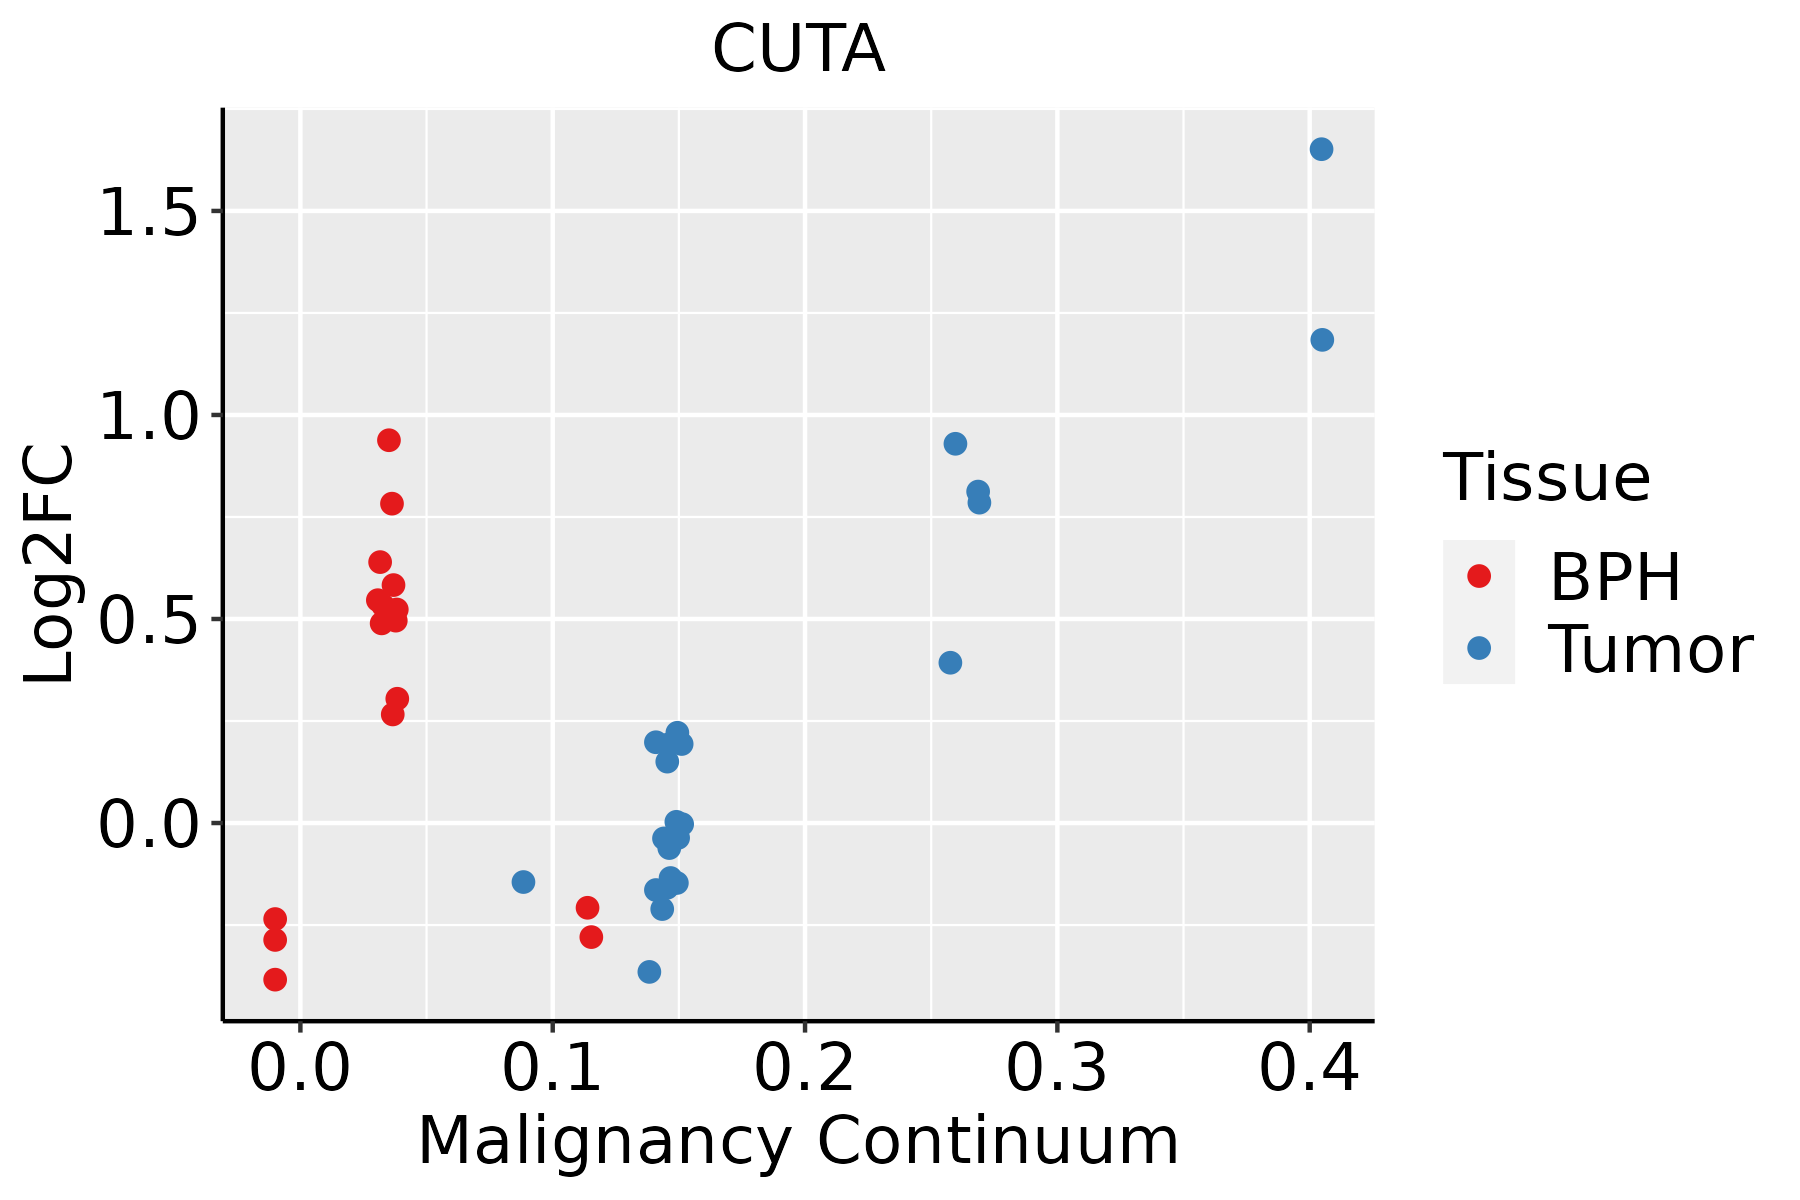 | BPH: Benign Prostatic Hyperplasia |
| Skin | 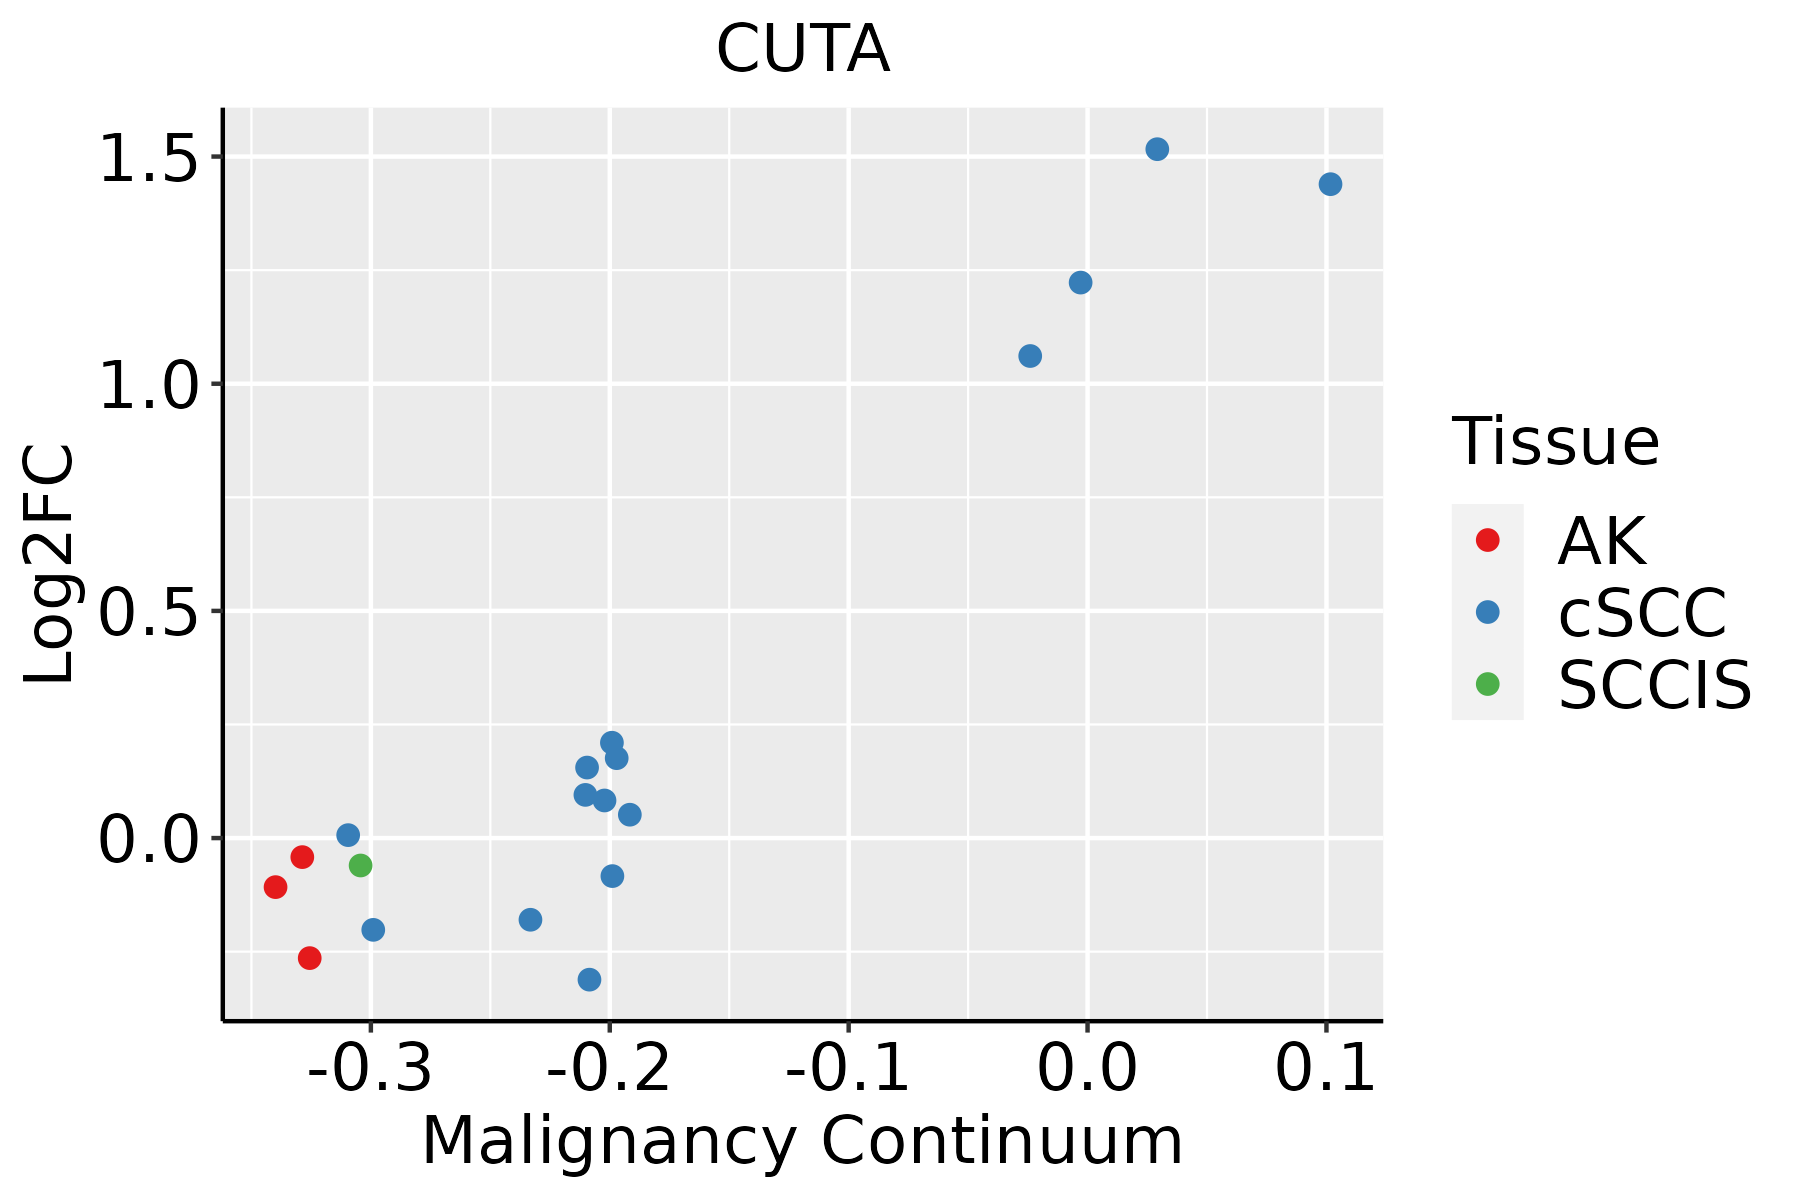 | AK: Actinic keratosis |
| cSCC: Cutaneous squamous cell carcinoma | ||
| SCCIS:squamous cell carcinoma in situ | ||
| Thyroid | 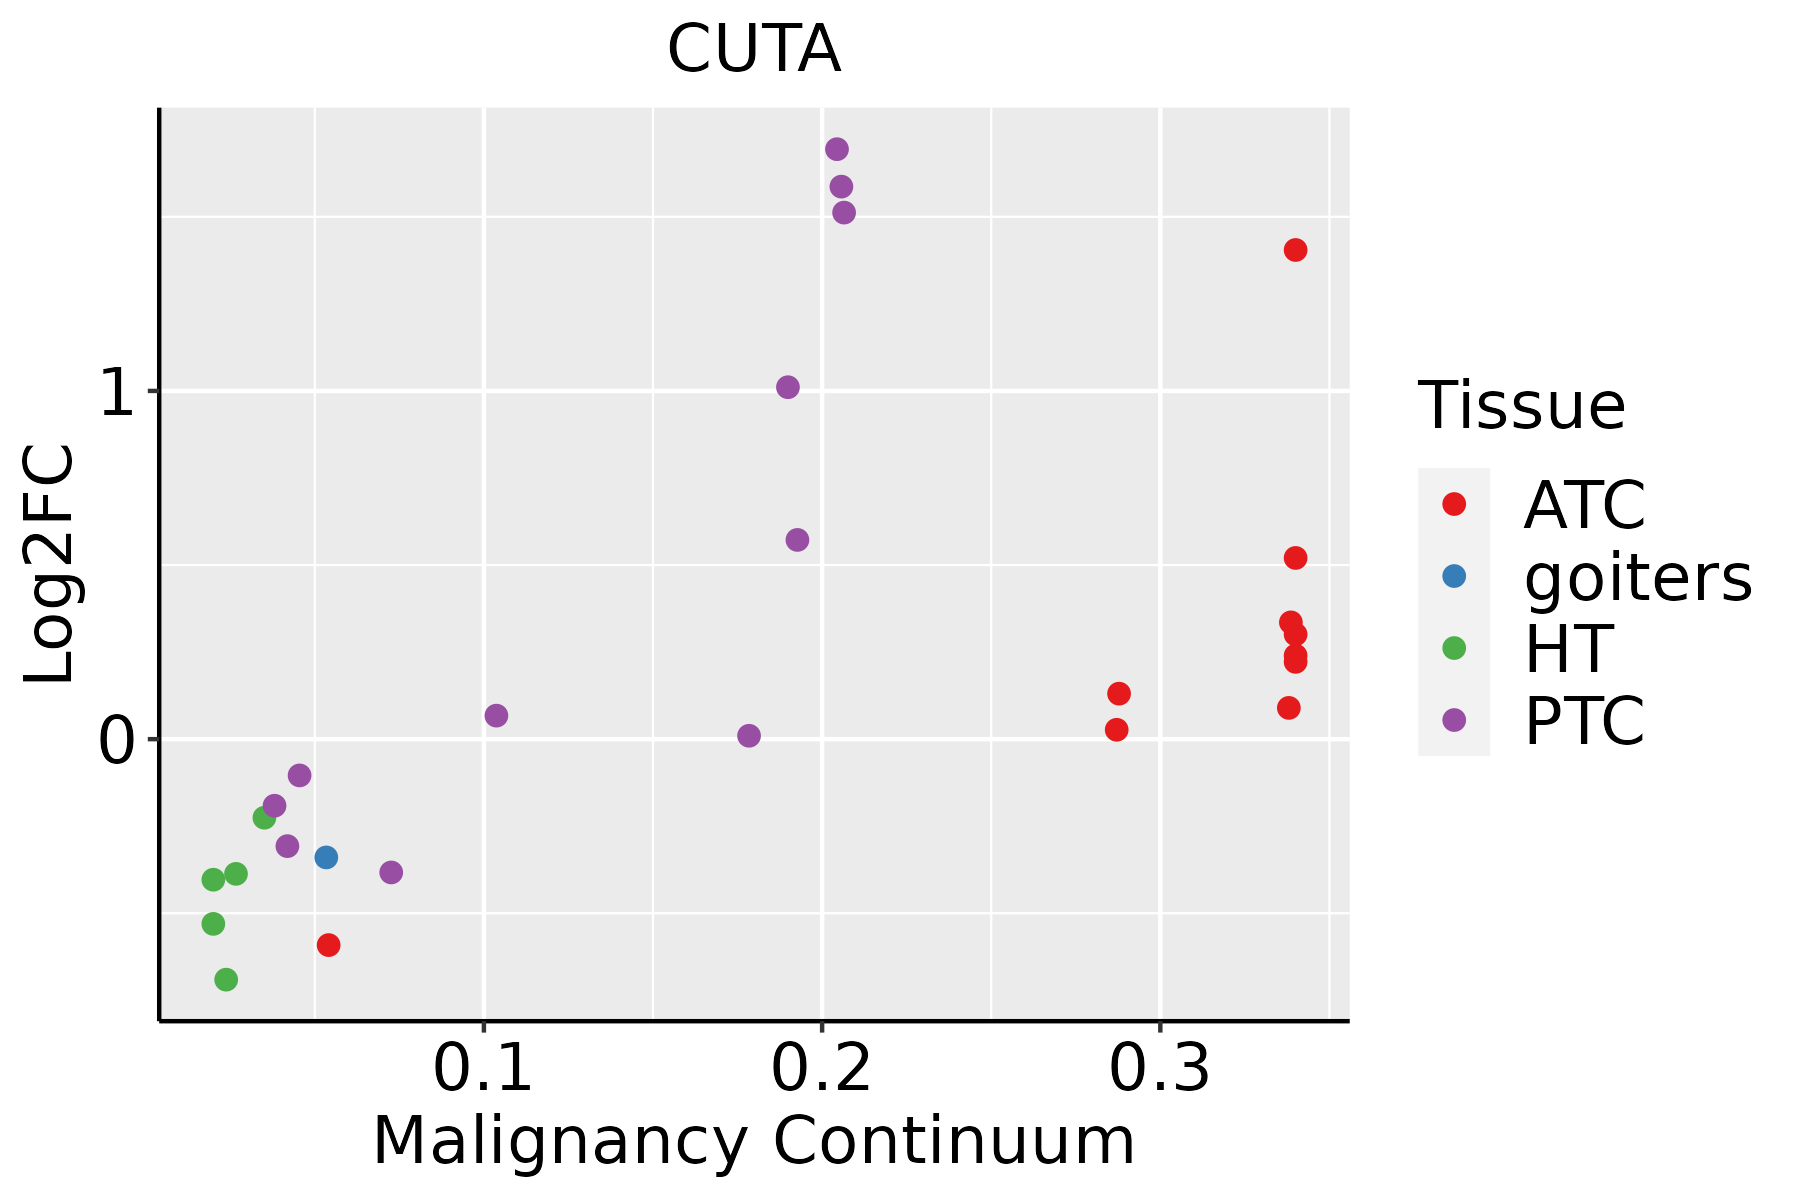 | ATC: Anaplastic thyroid cancer |
| HT: Hashimoto's thyroiditis | ||
| PTC: Papillary thyroid cancer |
| ∗log2FC in expression of this searched gene in stem-like cells from each diseased tissue sample relative to stem-like cells in normal samples in each tissue plotted against the malignancy continuum. Samples are colored based on if they are from different disease stage. |
Top |
Malignant transformation related pathway analysis |
| Find out the enriched GO biological processes and KEGG pathways involved in transition from healthy to precancer to cancer |
| Tissue | Disease Stage | Enriched GO biological Processes |
| Colorectum | AD |  |
| Colorectum | SER |  |
| Colorectum | MSS |  |
| Colorectum | MSI-H |  |
| Colorectum | FAP |  |
| ∗Top 15 enriched GO BP terms are showed in the bar plot of each disease state in each tissue. Each row represents a significant GO biological process which is colored according to the -log10(p.adjust). |
| Page: 1 2 3 4 5 6 7 8 9 |
| GO ID | Tissue | Disease Stage | Description | Gene Ratio | Bg Ratio | pvalue | p.adjust | Count |
| GO:001003814 | Breast | IDC | response to metal ion | 65/1434 | 373/18723 | 2.95e-10 | 3.42e-08 | 65 |
| GO:001003824 | Breast | DCIS | response to metal ion | 65/1390 | 373/18723 | 8.03e-11 | 9.88e-09 | 65 |
| GO:001003810 | Cervix | CC | response to metal ion | 67/2311 | 373/18723 | 9.67e-04 | 8.10e-03 | 67 |
| GO:001003815 | Cervix | HSIL_HPV | response to metal ion | 36/737 | 373/18723 | 7.19e-07 | 3.65e-05 | 36 |
| GO:0010038 | Colorectum | AD | response to metal ion | 106/3918 | 373/18723 | 3.22e-04 | 3.83e-03 | 106 |
| GO:00100381 | Colorectum | SER | response to metal ion | 84/2897 | 373/18723 | 1.87e-04 | 3.44e-03 | 84 |
| GO:00100382 | Colorectum | MSS | response to metal ion | 90/3467 | 373/18723 | 3.76e-03 | 2.76e-02 | 90 |
| GO:00100383 | Colorectum | MSI-H | response to metal ion | 41/1319 | 373/18723 | 3.09e-03 | 3.87e-02 | 41 |
| GO:001003816 | Endometrium | AEH | response to metal ion | 65/2100 | 373/18723 | 2.02e-04 | 2.54e-03 | 65 |
| GO:001003817 | Endometrium | EEC | response to metal ion | 66/2168 | 373/18723 | 2.86e-04 | 3.23e-03 | 66 |
| GO:001003827 | Esophagus | ESCC | response to metal ion | 208/8552 | 373/18723 | 5.02e-05 | 3.90e-04 | 208 |
| GO:001003812 | Liver | Cirrhotic | response to metal ion | 150/4634 | 373/18723 | 2.27e-11 | 1.37e-09 | 150 |
| GO:001003822 | Liver | HCC | response to metal ion | 208/7958 | 373/18723 | 1.35e-07 | 2.56e-06 | 208 |
| GO:001003820 | Oral cavity | OSCC | response to metal ion | 188/7305 | 373/18723 | 4.34e-06 | 5.00e-05 | 188 |
| GO:0010038110 | Oral cavity | LP | response to metal ion | 124/4623 | 373/18723 | 1.09e-04 | 1.31e-03 | 124 |
| GO:001003818 | Prostate | BPH | response to metal ion | 104/3107 | 373/18723 | 2.32e-08 | 6.99e-07 | 104 |
| GO:001003819 | Prostate | Tumor | response to metal ion | 107/3246 | 373/18723 | 3.02e-08 | 9.77e-07 | 107 |
| GO:001003829 | Skin | cSCC | response to metal ion | 132/4864 | 373/18723 | 3.11e-05 | 3.42e-04 | 132 |
| GO:001003830 | Thyroid | HT | response to metal ion | 50/1272 | 373/18723 | 3.12e-06 | 1.08e-04 | 50 |
| GO:0010038112 | Thyroid | PTC | response to metal ion | 157/5968 | 373/18723 | 1.80e-05 | 1.86e-04 | 157 |
| Page: 1 2 |
| Pathway ID | Tissue | Disease Stage | Description | Gene Ratio | Bg Ratio | pvalue | p.adjust | qvalue | Count |
| Page: 1 |
Top |
Cell-cell communication analysis |
| Identification of potential cell-cell interactions between two cell types and their ligand-receptor pairs for different disease states |
| Ligand | Receptor | LRpair | Pathway | Tissue | Disease Stage |
| Page: 1 |
Top |
Single-cell gene regulatory network inference analysis |
| Find out the significant the regulons (TFs) and the target genes of each regulon across cell types for different disease states |
| TF | Cell Type | Tissue | Disease Stage | Target Gene | RSS | Regulon Activity |
| ∗The dot plots of a searched regulon are shown for all cell subpopulations in each disease state of each tissue based on the regulon specific score inferred using pySCENIC and by calculating the average expression. |
| Page: 1 |
Top |
Somatic mutation of malignant transformation related genes |
| Annotation of somatic variants for genes involved in malignant transformation |
| Hugo Symbol | Variant Class | Variant Classification | dbSNP RS | HGVSc | HGVSp | HGVSp Short | SWISSPROT | BIOTYPE | SIFT | PolyPhen | Tumor Sample Barcode | Tissue | Histology | Sex | Age | Stage | Therapy Types | Drugs | Outcome |
| CUTA | insertion | Frame_Shift_Ins | novel | c.421-1_421insTACTGCACAGAGCCATCAGGCCGTACTCTCCGAGCAAGGACCCGGA | p.Met141TyrfsTer18 | p.M141Yfs*18 | O60888 | protein_coding | TCGA-A8-A097-01 | Breast | breast invasive carcinoma | Female | >=65 | I/II | Hormone Therapy | tamoxiphen | SD | ||
| CUTA | SNV | Missense_Mutation | c.26C>T | p.Ser9Phe | p.S9F | O60888 | protein_coding | tolerated_low_confidence(1) | benign(0) | TCGA-IR-A3LK-01 | Cervix | cervical & endocervical cancer | Female | >=65 | I/II | Chemotherapy | cisplatin | PD | |
| CUTA | SNV | Missense_Mutation | novel | c.134N>T | p.Ala45Val | p.A45V | O60888 | protein_coding | tolerated(0.09) | benign(0.003) | TCGA-AJ-A3BH-01 | Endometrium | uterine corpus endometrioid carcinoma | Female | Unknown | I/II | Unknown | Unknown | SD |
| CUTA | SNV | Missense_Mutation | novel | c.355N>G | p.Ile119Val | p.I119V | O60888 | protein_coding | tolerated(0.43) | benign(0.02) | TCGA-AP-A1DK-01 | Endometrium | uterine corpus endometrioid carcinoma | Female | <65 | I/II | Unknown | Unknown | SD |
| CUTA | SNV | Missense_Mutation | novel | c.275T>C | p.Val92Ala | p.V92A | O60888 | protein_coding | deleterious(0) | probably_damaging(0.995) | TCGA-B5-A3FA-01 | Endometrium | uterine corpus endometrioid carcinoma | Female | >=65 | I/II | Unknown | Unknown | SD |
| CUTA | SNV | Missense_Mutation | novel | c.265N>A | p.Ala89Thr | p.A89T | O60888 | protein_coding | tolerated(0.07) | possibly_damaging(0.696) | TCGA-DF-A2KU-01 | Endometrium | uterine corpus endometrioid carcinoma | Female | Unknown | I/II | Unknown | Unknown | SD |
| CUTA | SNV | Missense_Mutation | novel | c.346N>A | p.Val116Ile | p.V116I | O60888 | protein_coding | tolerated(0.06) | possibly_damaging(0.829) | TCGA-EO-A22R-01 | Endometrium | uterine corpus endometrioid carcinoma | Female | <65 | I/II | Unknown | Unknown | SD |
| CUTA | SNV | Missense_Mutation | rs780611595 | c.77N>A | p.Ser26Tyr | p.S26Y | O60888 | protein_coding | deleterious_low_confidence(0) | possibly_damaging(0.676) | TCGA-EO-A22X-01 | Endometrium | uterine corpus endometrioid carcinoma | Female | <65 | III/IV | Unspecific | Carboplatin | Complete Response |
| CUTA | SNV | Missense_Mutation | rs762618918 | c.227C>T | p.Ser76Leu | p.S76L | O60888 | protein_coding | tolerated(0.19) | benign(0.003) | TCGA-63-5131-01 | Lung | lung squamous cell carcinoma | Male | Unknown | I/II | Unknown | Unknown | SD |
| CUTA | SNV | Missense_Mutation | novel | c.410A>G | p.Glu137Gly | p.E137G | O60888 | protein_coding | deleterious(0) | probably_damaging(1) | TCGA-CQ-5326-01 | Oral cavity | head & neck squamous cell carcinoma | Male | >=65 | I/II | Unknown | Unknown | PD |
| Page: 1 2 |
Top |
Related drugs of malignant transformation related genes |
| Identification of chemicals and drugs interact with genes involved in malignant transfromation |
| (DGIdb 4.0) |
| Entrez ID | Symbol | Category | Interaction Types | Drug Claim Name | Drug Name | PMIDs |
| Page: 1 |

Copyright 2023-Present -The University of Texas Health Science Center at Houston |