| Tissue | Expression Dynamics | Abbreviation |
| Cervix | 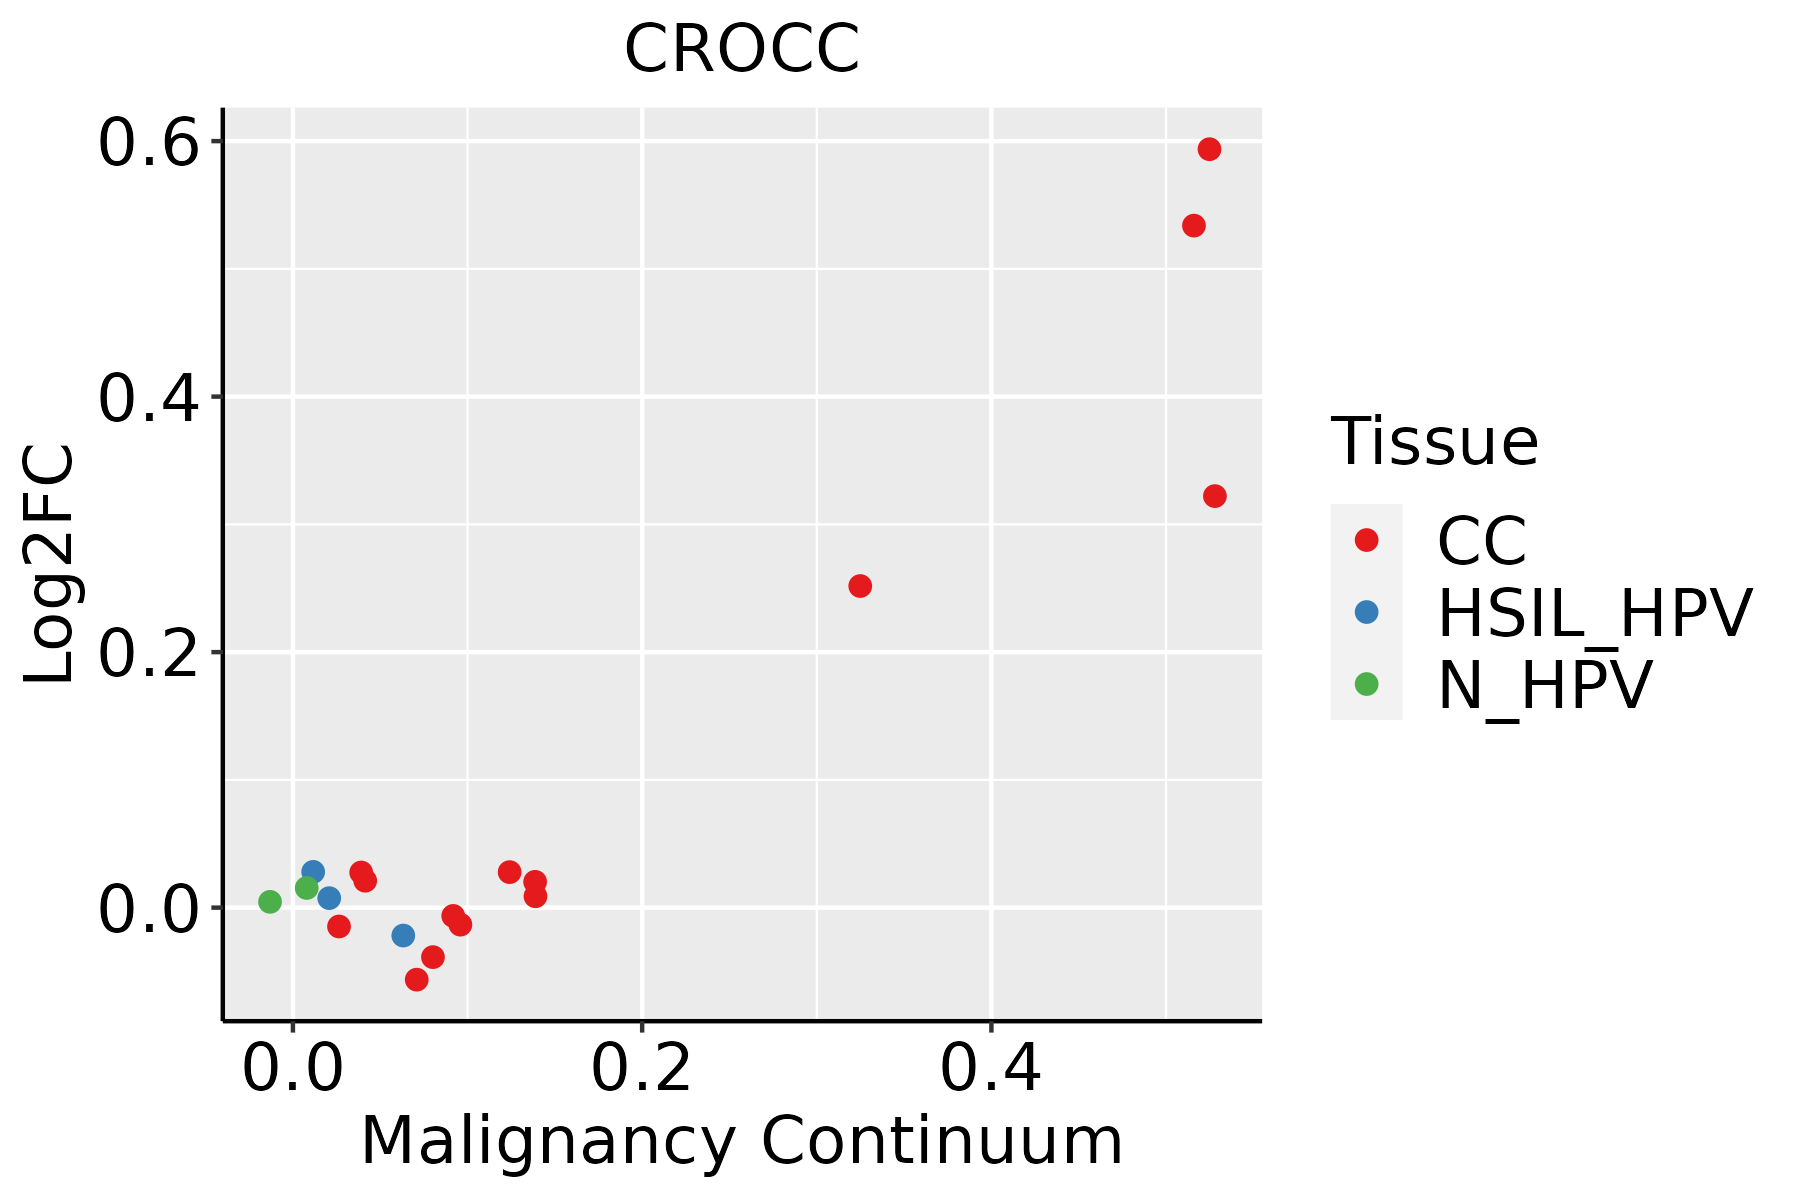 | CC: Cervix cancer |
| HSIL_HPV: HPV-infected high-grade squamous intraepithelial lesions |
| N_HPV: HPV-infected normal cervix |
| Colorectum (GSE201348) | 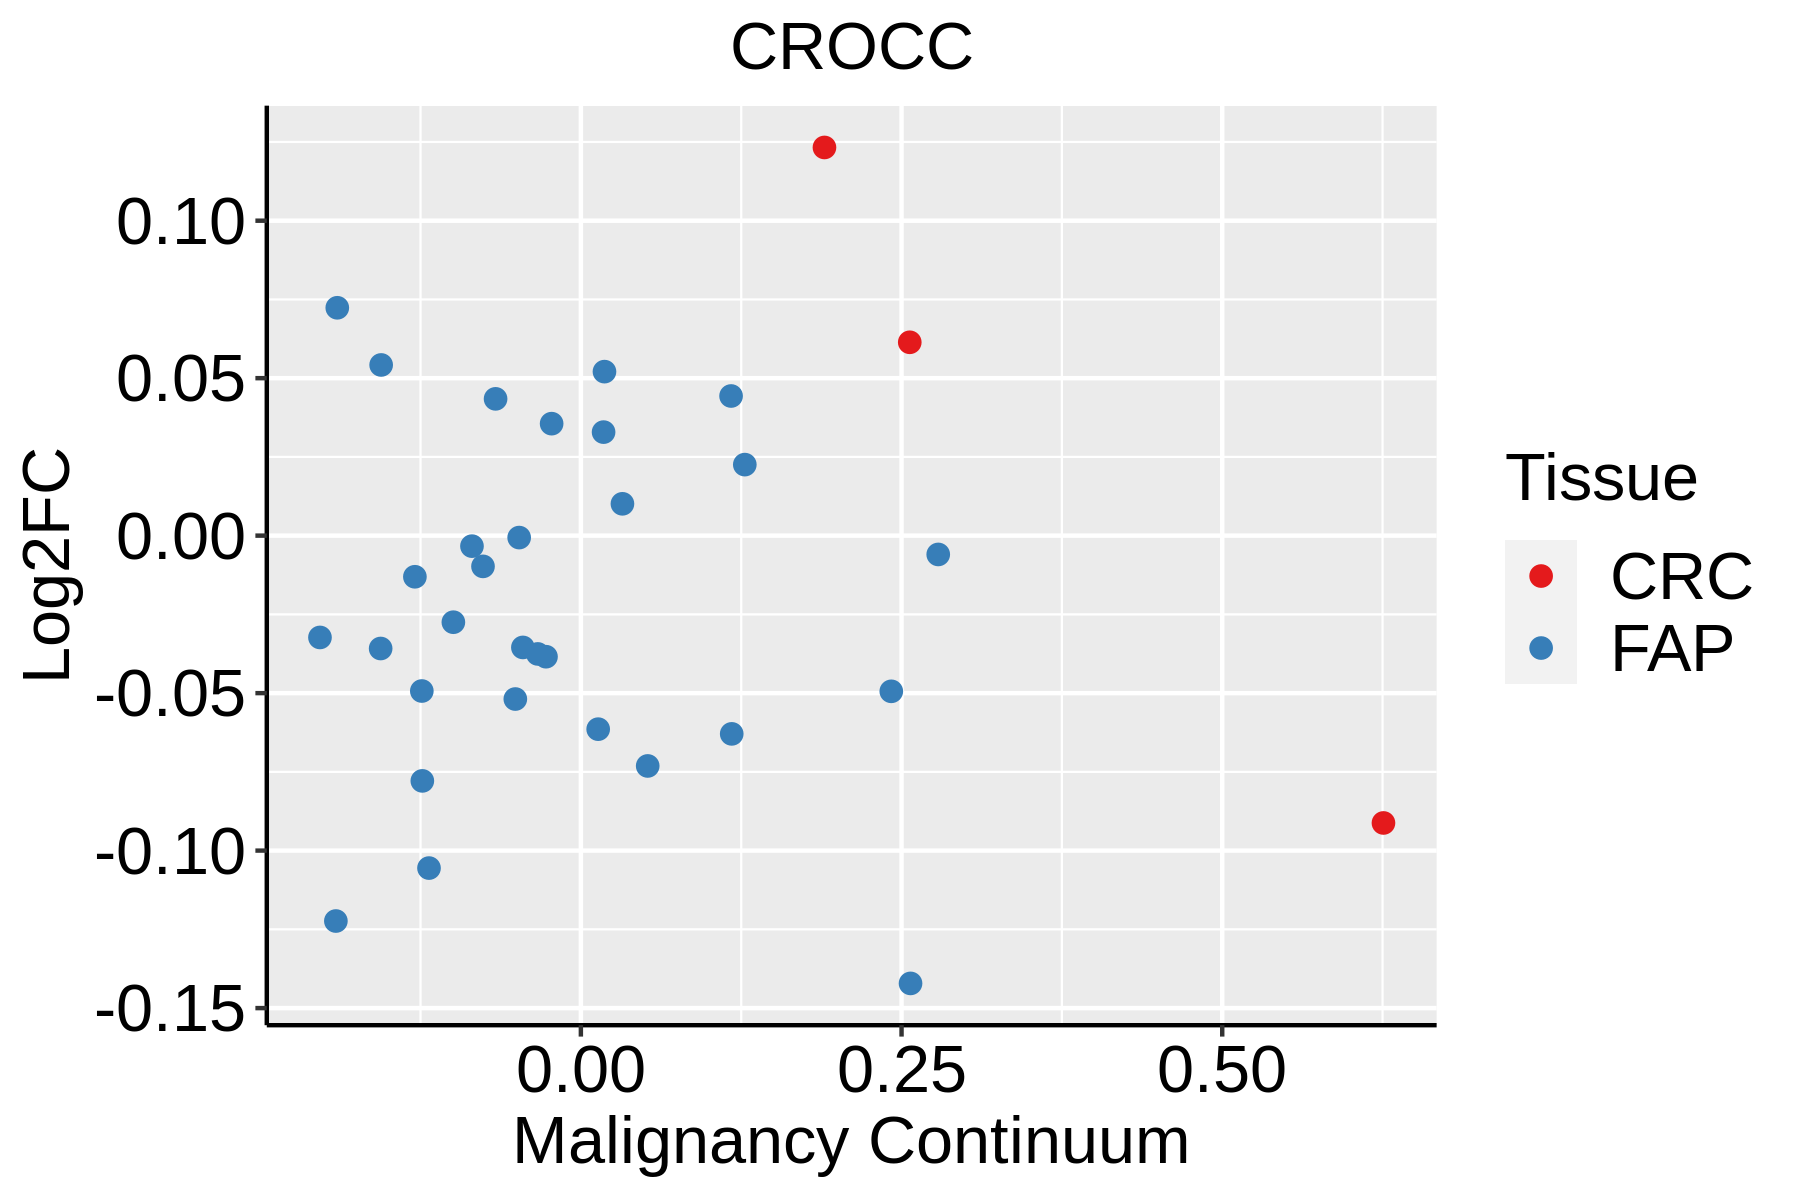 | FAP: Familial adenomatous polyposis |
| CRC: Colorectal cancer |
| Colorectum (HTA11) |  | AD: Adenomas |
| SER: Sessile serrated lesions |
| MSI-H: Microsatellite-high colorectal cancer |
| MSS: Microsatellite stable colorectal cancer |
| Esophagus | 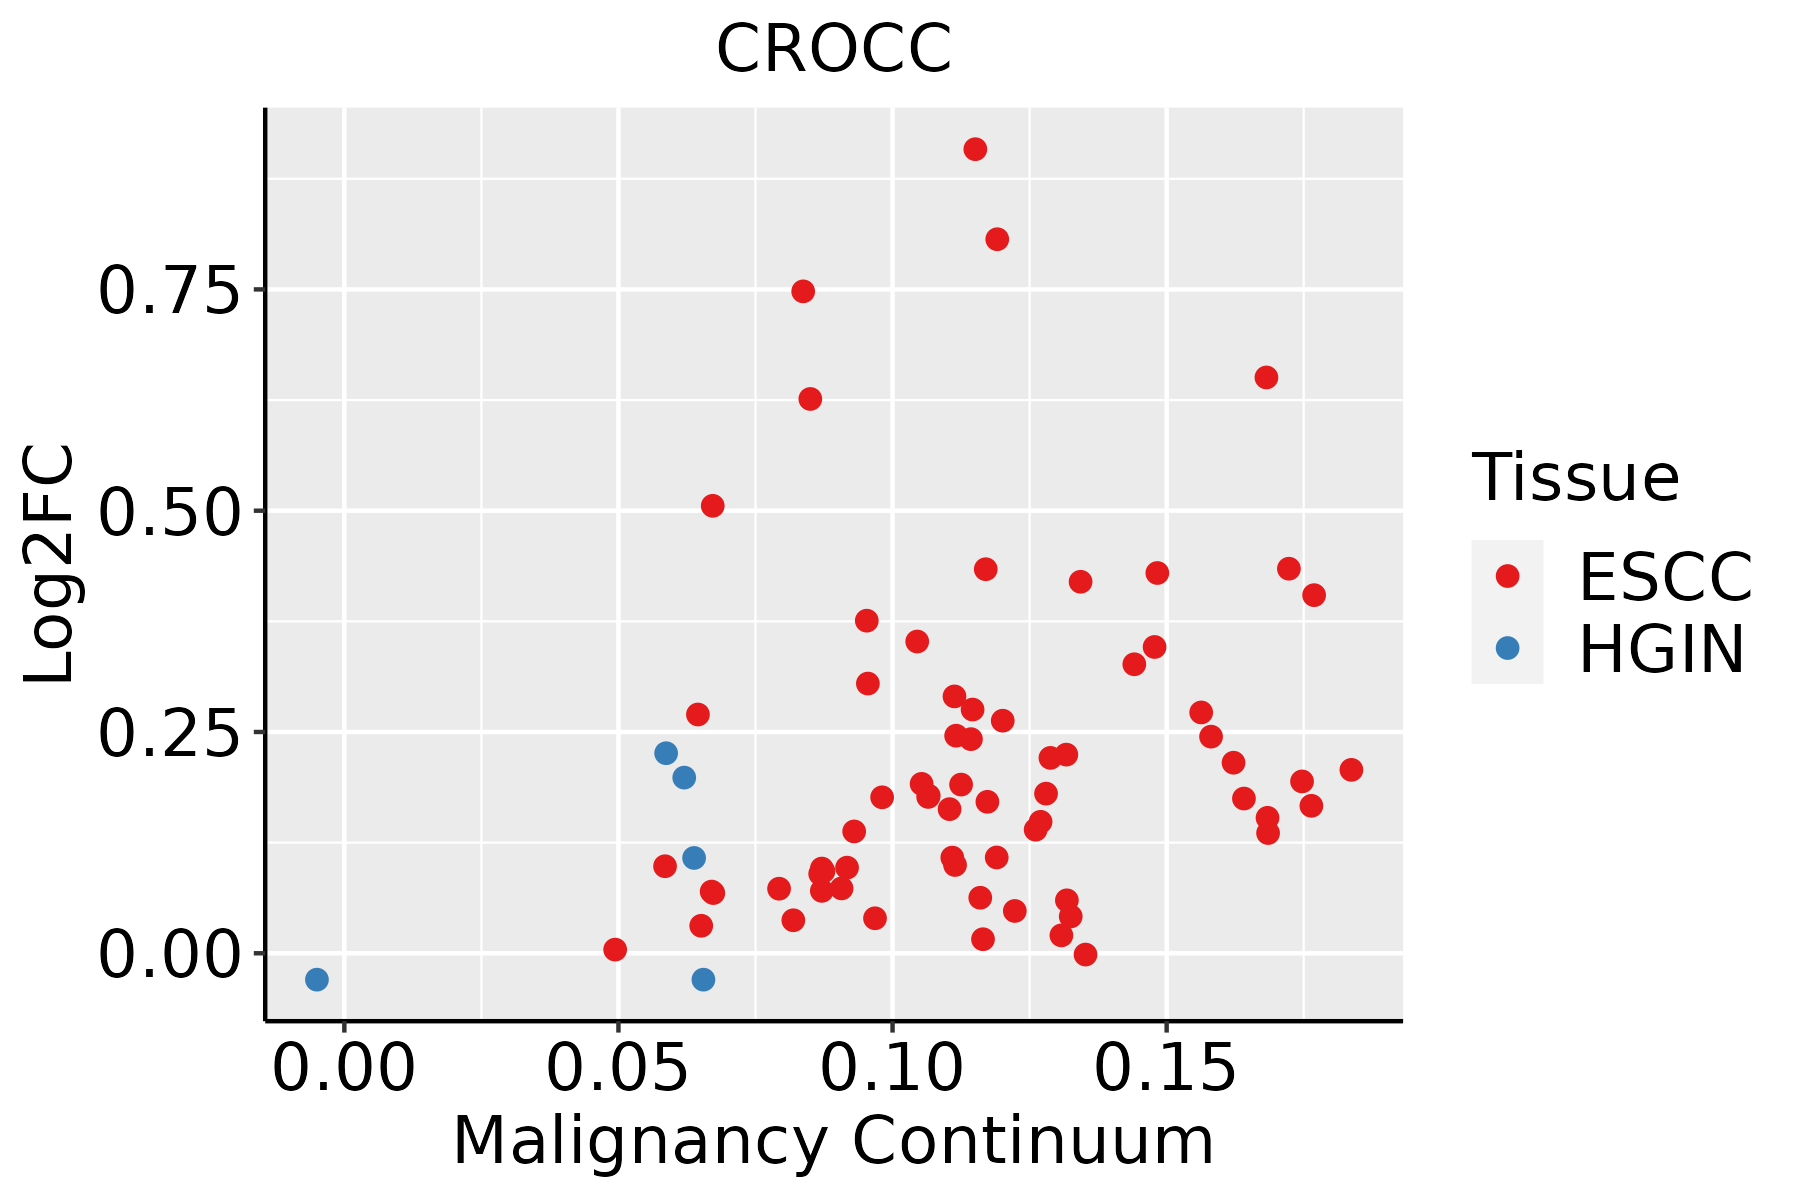 | ESCC: Esophageal squamous cell carcinoma |
| HGIN: High-grade intraepithelial neoplasias |
| LGIN: Low-grade intraepithelial neoplasias |
| Thyroid | 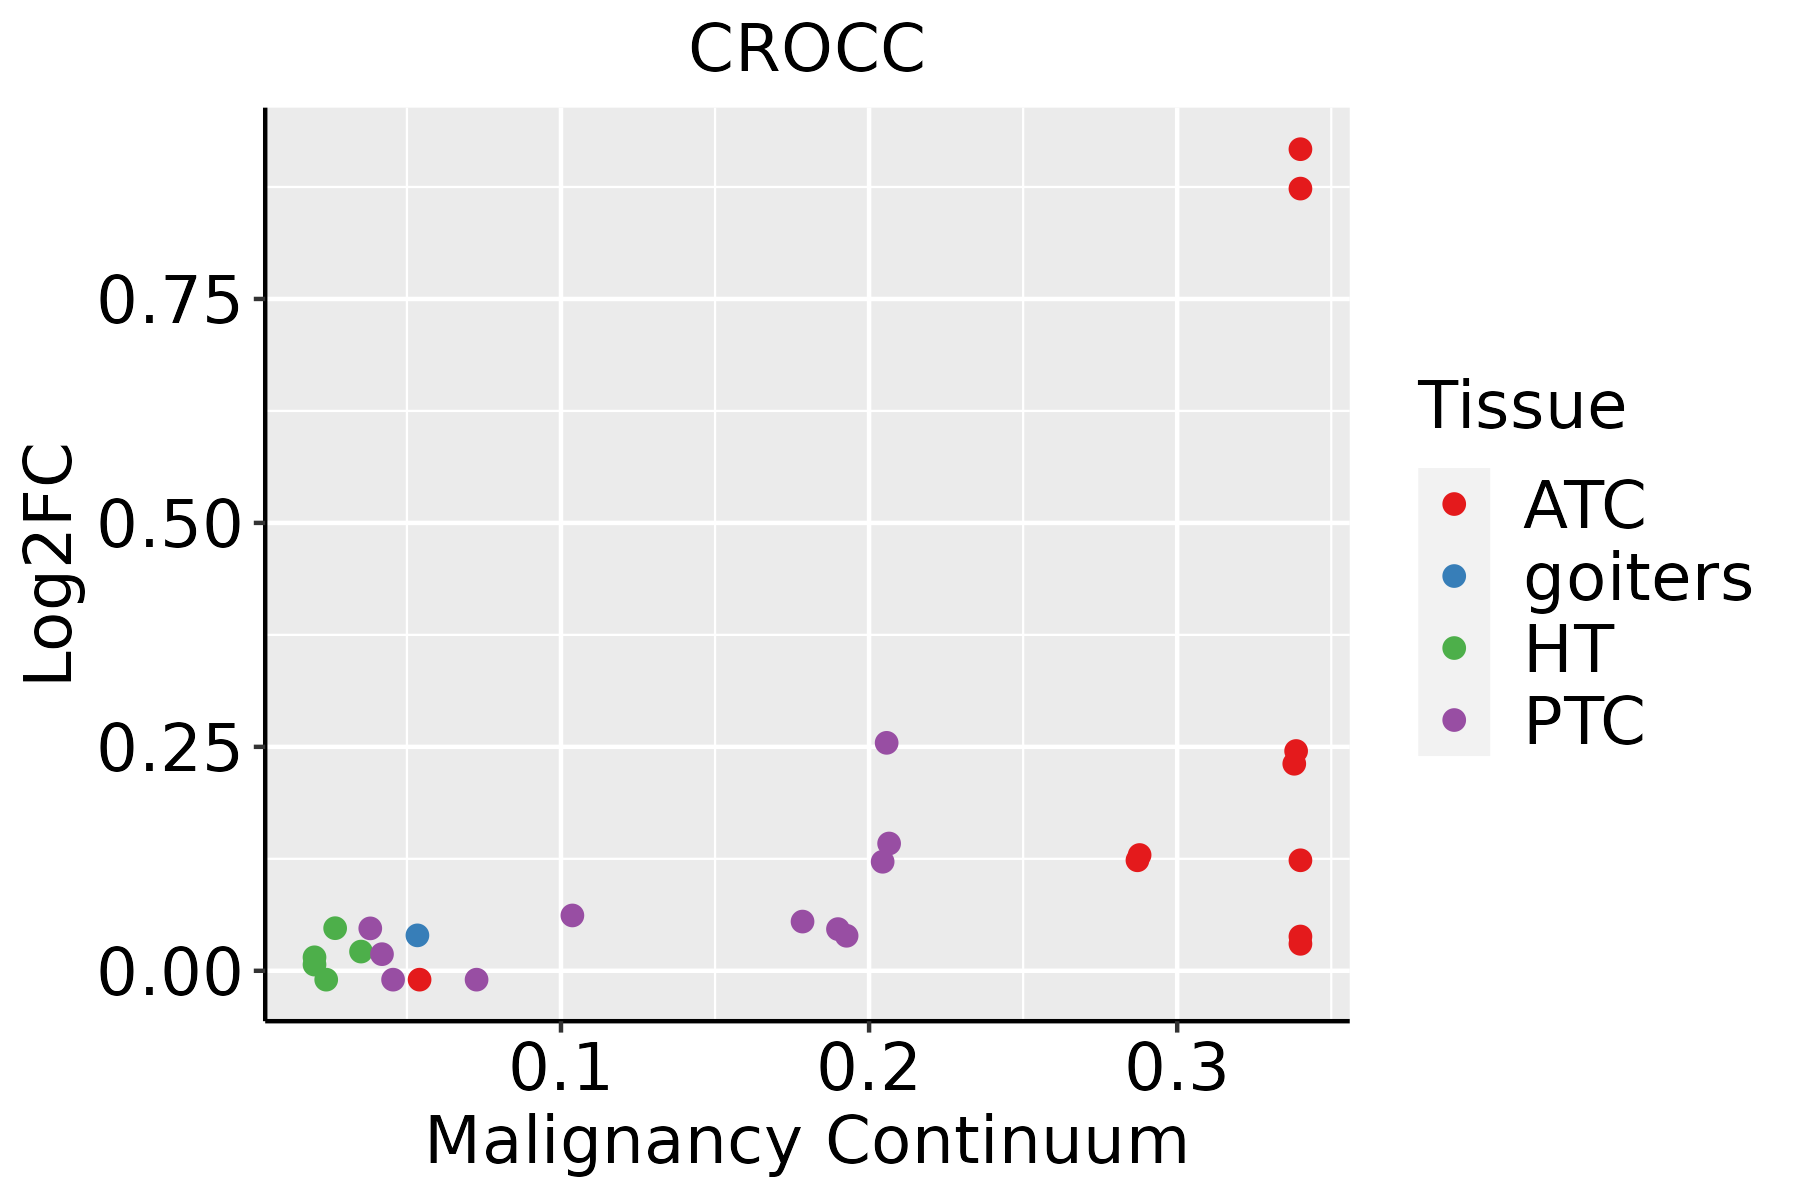 | ATC: Anaplastic thyroid cancer |
| HT: Hashimoto's thyroiditis |
| PTC: Papillary thyroid cancer |
| GO ID | Tissue | Disease Stage | Description | Gene Ratio | Bg Ratio | pvalue | p.adjust | Count |
| GO:190382910 | Cervix | CC | positive regulation of cellular protein localization | 72/2311 | 276/18723 | 3.20e-10 | 4.46e-08 | 72 |
| GO:00313467 | Cervix | CC | positive regulation of cell projection organization | 72/2311 | 353/18723 | 1.04e-05 | 2.32e-04 | 72 |
| GO:00018949 | Cervix | CC | tissue homeostasis | 57/2311 | 268/18723 | 2.43e-05 | 4.21e-04 | 57 |
| GO:00516567 | Cervix | CC | establishment of organelle localization | 76/2311 | 390/18723 | 3.17e-05 | 5.21e-04 | 76 |
| GO:00602498 | Cervix | CC | anatomical structure homeostasis | 63/2311 | 314/18723 | 6.03e-05 | 8.68e-04 | 63 |
| GO:19021153 | Cervix | CC | regulation of organelle assembly | 40/2311 | 186/18723 | 2.92e-04 | 3.15e-03 | 40 |
| GO:19021171 | Cervix | CC | positive regulation of organelle assembly | 19/2311 | 67/18723 | 3.42e-04 | 3.58e-03 | 19 |
| GO:01200328 | Cervix | CC | regulation of plasma membrane bounded cell projection assembly | 38/2311 | 186/18723 | 1.14e-03 | 9.35e-03 | 38 |
| GO:00604917 | Cervix | CC | regulation of cell projection assembly | 38/2311 | 188/18723 | 1.40e-03 | 1.10e-02 | 38 |
| GO:00018957 | Cervix | CC | retina homeostasis | 19/2311 | 79/18723 | 2.94e-03 | 1.94e-02 | 19 |
| GO:19038294 | Colorectum | FAP | positive regulation of cellular protein localization | 79/2622 | 276/18723 | 1.59e-10 | 4.38e-08 | 79 |
| GO:00516563 | Colorectum | FAP | establishment of organelle localization | 97/2622 | 390/18723 | 5.91e-09 | 9.48e-07 | 97 |
| GO:00313463 | Colorectum | FAP | positive regulation of cell projection organization | 82/2622 | 353/18723 | 1.78e-06 | 7.35e-05 | 82 |
| GO:00018944 | Colorectum | FAP | tissue homeostasis | 61/2622 | 268/18723 | 6.71e-05 | 1.28e-03 | 61 |
| GO:00602494 | Colorectum | FAP | anatomical structure homeostasis | 69/2622 | 314/18723 | 7.51e-05 | 1.37e-03 | 69 |
| GO:01200323 | Colorectum | FAP | regulation of plasma membrane bounded cell projection assembly | 39/2622 | 186/18723 | 5.84e-03 | 3.73e-02 | 39 |
| GO:0010669 | Colorectum | FAP | epithelial structure maintenance | 10/2622 | 30/18723 | 5.90e-03 | 3.75e-02 | 10 |
| GO:00604912 | Colorectum | FAP | regulation of cell projection assembly | 39/2622 | 188/18723 | 7.01e-03 | 4.29e-02 | 39 |
| GO:190382926 | Esophagus | HGIN | positive regulation of cellular protein localization | 75/2587 | 276/18723 | 3.19e-09 | 2.30e-07 | 75 |
| GO:005165616 | Esophagus | HGIN | establishment of organelle localization | 90/2587 | 390/18723 | 4.27e-07 | 1.94e-05 | 90 |
| Hugo Symbol | Variant Class | Variant Classification | dbSNP RS | HGVSc | HGVSp | HGVSp Short | SWISSPROT | BIOTYPE | SIFT | PolyPhen | Tumor Sample Barcode | Tissue | Histology | Sex | Age | Stage | Therapy Types | Drugs | Outcome |
| CROCC | SNV | Missense_Mutation | rs764904297 | c.1060N>A | p.Glu354Lys | p.E354K | Q5TZA2 | protein_coding | tolerated(0.7) | benign(0.09) | TCGA-A2-A4RX-01 | Breast | breast invasive carcinoma | Female | >=65 | I/II | Unknown | Unknown | SD |
| CROCC | SNV | Missense_Mutation | | c.3904G>A | p.Glu1302Lys | p.E1302K | Q5TZA2 | protein_coding | deleterious(0.01) | possibly_damaging(0.655) | TCGA-AC-A23H-01 | Breast | breast invasive carcinoma | Female | >=65 | I/II | Unknown | Unknown | PD |
| CROCC | SNV | Missense_Mutation | novel | c.1789N>A | p.Ala597Thr | p.A597T | Q5TZA2 | protein_coding | tolerated(0.35) | benign(0.003) | TCGA-AC-A8OP-01 | Breast | breast invasive carcinoma | Female | >=65 | I/II | Unknown | Unknown | SD |
| CROCC | SNV | Missense_Mutation | | c.3290G>C | p.Arg1097Pro | p.R1097P | Q5TZA2 | protein_coding | deleterious(0.01) | probably_damaging(0.998) | TCGA-AO-A12H-01 | Breast | breast invasive carcinoma | Female | >=65 | I/II | Hormone Therapy | arimidex | SD |
| CROCC | SNV | Missense_Mutation | rs745666217 | c.2320N>T | p.Arg774Trp | p.R774W | Q5TZA2 | protein_coding | deleterious(0) | possibly_damaging(0.799) | TCGA-AR-A24M-01 | Breast | breast invasive carcinoma | Female | <65 | III/IV | Hormone Therapy | tamoxiphen | SD |
| CROCC | SNV | Missense_Mutation | | c.3290G>C | p.Arg1097Pro | p.R1097P | Q5TZA2 | protein_coding | deleterious(0.01) | probably_damaging(0.998) | TCGA-B6-A1KC-01 | Breast | breast invasive carcinoma | Female | >=65 | I/II | Unknown | Unknown | SD |
| CROCC | SNV | Missense_Mutation | novel | c.3778N>A | p.Glu1260Lys | p.E1260K | Q5TZA2 | protein_coding | deleterious(0) | probably_damaging(0.996) | TCGA-BH-A0B6-01 | Breast | breast invasive carcinoma | Female | <65 | I/II | Unknown | Unknown | SD |
| CROCC | SNV | Missense_Mutation | | c.2371G>C | p.Glu791Gln | p.E791Q | Q5TZA2 | protein_coding | deleterious(0.02) | benign(0.097) | TCGA-BH-A0DX-01 | Breast | breast invasive carcinoma | Female | <65 | I/II | Chemotherapy | taxotere | CR |
| CROCC | SNV | Missense_Mutation | | c.4649N>A | p.Thr1550Asn | p.T1550N | Q5TZA2 | protein_coding | tolerated(0.72) | benign(0.037) | TCGA-BH-A0DZ-01 | Breast | breast invasive carcinoma | Female | <65 | I/II | Chemotherapy | docetaxel | SD |
| CROCC | SNV | Missense_Mutation | | c.3290N>C | p.Arg1097Pro | p.R1097P | Q5TZA2 | protein_coding | deleterious(0.01) | probably_damaging(0.998) | TCGA-BH-A0E9-01 | Breast | breast invasive carcinoma | Female | <65 | I/II | Chemotherapy | taxotere | CR |


