
|
|||||
|
 | |
| |
| |
| |
| |
| |
|
Gene: CPNE2 |
Gene summary for CPNE2 |
| Gene information | Species | Human | Gene symbol | CPNE2 | Gene ID | 221184 |
| Gene name | copine 2 | |
| Gene Alias | COPN2 | |
| Cytomap | 16q13 | |
| Gene Type | protein-coding | GO ID | GO:0008150 | UniProtAcc | Q96FN4 |
Top |
Malignant transformation analysis |
| Identification of the aberrant gene expression in precancerous and cancerous lesions by comparing the gene expression of stem-like cells in diseased tissues with normal stem cells |
| Entrez ID | Symbol | Replicates | Species | Organ | Tissue | Adj P-value | Log2FC | Malignancy |
| 221184 | CPNE2 | HTA11_99999971662_82457 | Human | Colorectum | MSS | 1.45e-07 | 3.02e-01 | 0.3859 |
| 221184 | CPNE2 | P1T-E | Human | Esophagus | ESCC | 1.21e-04 | 2.84e-01 | 0.0875 |
| 221184 | CPNE2 | P2T-E | Human | Esophagus | ESCC | 3.72e-04 | 8.74e-02 | 0.1177 |
| 221184 | CPNE2 | P4T-E | Human | Esophagus | ESCC | 1.51e-10 | 2.51e-01 | 0.1323 |
| 221184 | CPNE2 | P8T-E | Human | Esophagus | ESCC | 1.06e-19 | 3.87e-01 | 0.0889 |
| 221184 | CPNE2 | P9T-E | Human | Esophagus | ESCC | 5.04e-05 | 8.85e-02 | 0.1131 |
| 221184 | CPNE2 | P10T-E | Human | Esophagus | ESCC | 4.58e-11 | 2.39e-01 | 0.116 |
| 221184 | CPNE2 | P11T-E | Human | Esophagus | ESCC | 2.97e-09 | 3.68e-01 | 0.1426 |
| 221184 | CPNE2 | P12T-E | Human | Esophagus | ESCC | 2.34e-03 | 5.90e-02 | 0.1122 |
| 221184 | CPNE2 | P15T-E | Human | Esophagus | ESCC | 2.28e-13 | 3.82e-01 | 0.1149 |
| 221184 | CPNE2 | P16T-E | Human | Esophagus | ESCC | 3.69e-02 | 1.56e-02 | 0.1153 |
| 221184 | CPNE2 | P20T-E | Human | Esophagus | ESCC | 1.16e-05 | 1.25e-01 | 0.1124 |
| 221184 | CPNE2 | P21T-E | Human | Esophagus | ESCC | 3.33e-19 | 4.07e-01 | 0.1617 |
| 221184 | CPNE2 | P22T-E | Human | Esophagus | ESCC | 4.36e-14 | 1.14e-01 | 0.1236 |
| 221184 | CPNE2 | P23T-E | Human | Esophagus | ESCC | 3.96e-11 | 2.50e-01 | 0.108 |
| 221184 | CPNE2 | P24T-E | Human | Esophagus | ESCC | 3.56e-09 | 1.42e-01 | 0.1287 |
| 221184 | CPNE2 | P26T-E | Human | Esophagus | ESCC | 2.01e-06 | 1.38e-01 | 0.1276 |
| 221184 | CPNE2 | P27T-E | Human | Esophagus | ESCC | 1.03e-06 | 6.79e-02 | 0.1055 |
| 221184 | CPNE2 | P28T-E | Human | Esophagus | ESCC | 5.96e-11 | 2.59e-01 | 0.1149 |
| 221184 | CPNE2 | P30T-E | Human | Esophagus | ESCC | 1.94e-16 | 7.18e-01 | 0.137 |
| Page: 1 2 3 4 |
| Tissue | Expression Dynamics | Abbreviation |
| Colorectum (GSE201348) |  | FAP: Familial adenomatous polyposis |
| CRC: Colorectal cancer | ||
| Colorectum (HTA11) |  | AD: Adenomas |
| SER: Sessile serrated lesions | ||
| MSI-H: Microsatellite-high colorectal cancer | ||
| MSS: Microsatellite stable colorectal cancer | ||
| Esophagus | 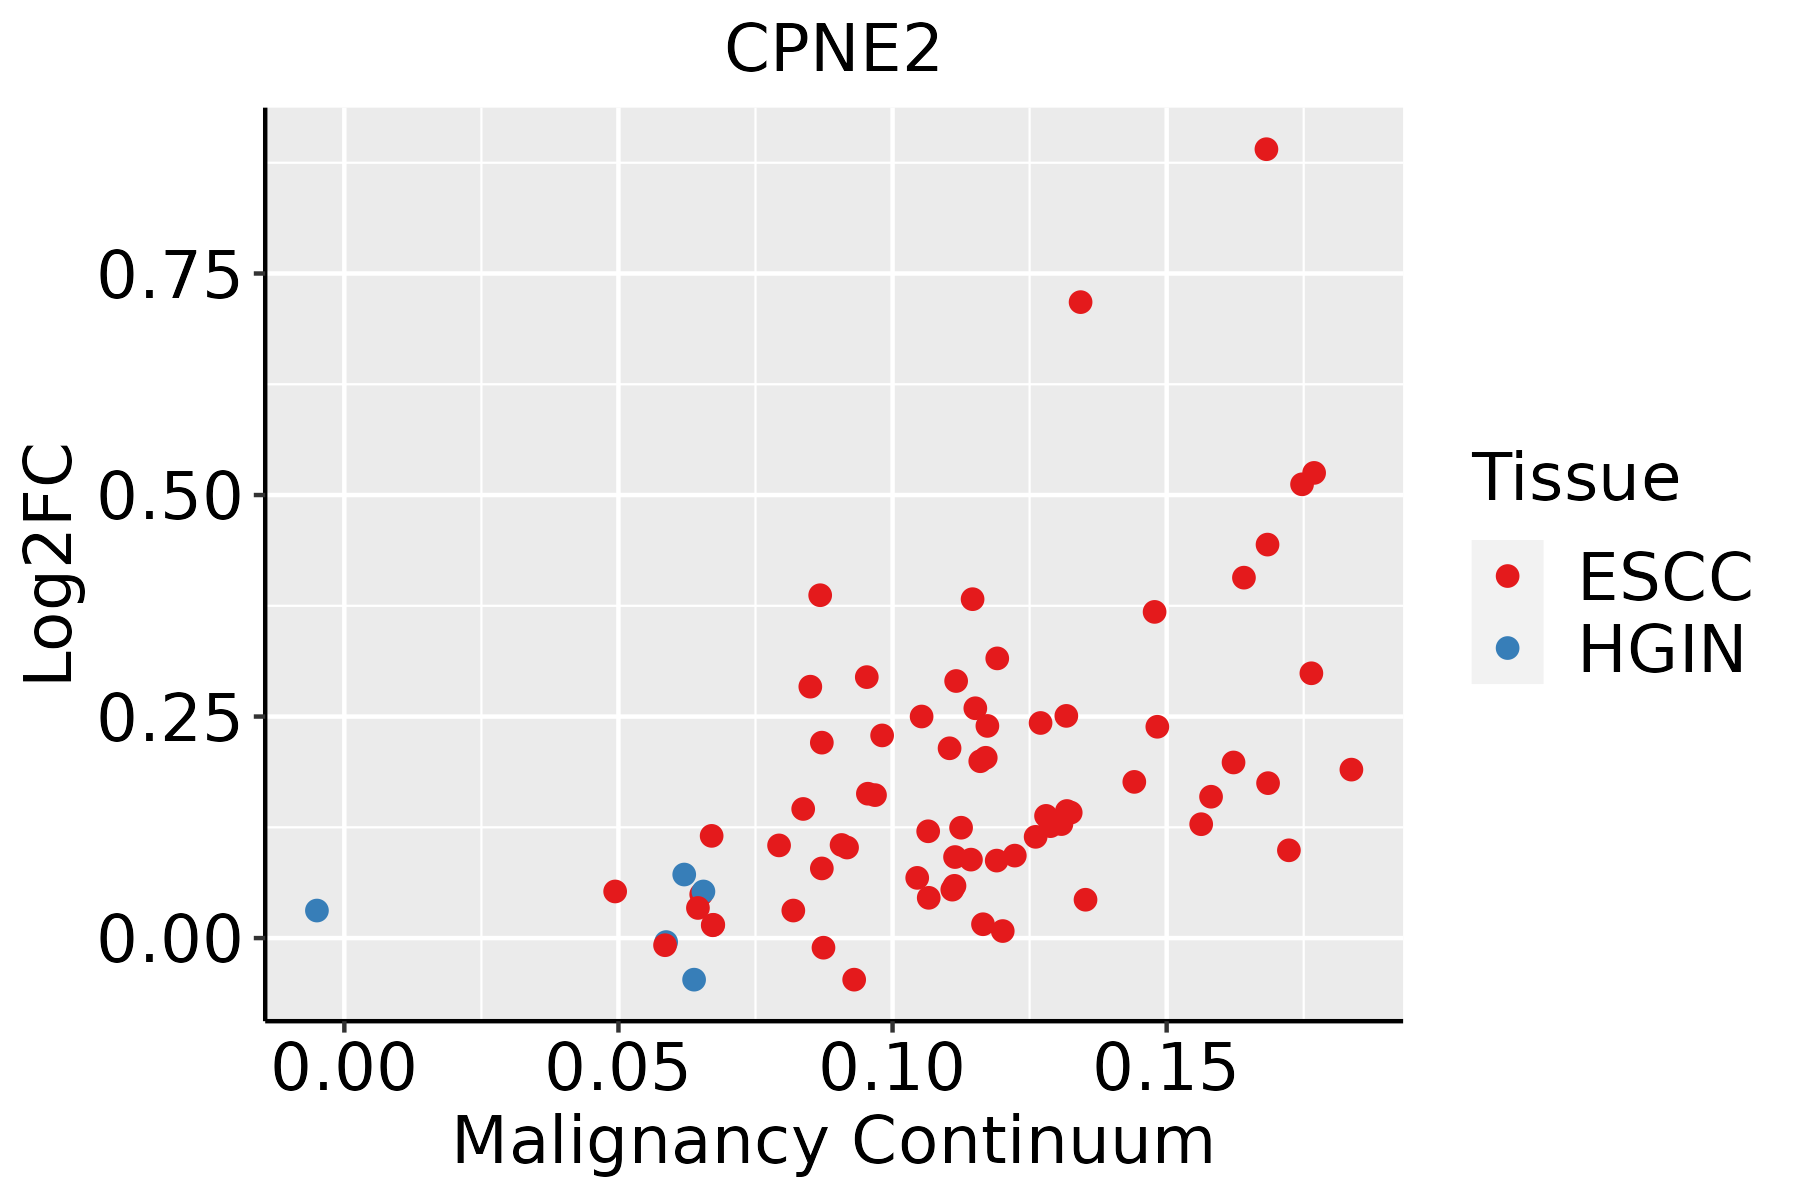 | ESCC: Esophageal squamous cell carcinoma |
| HGIN: High-grade intraepithelial neoplasias | ||
| LGIN: Low-grade intraepithelial neoplasias | ||
| Oral Cavity |  | EOLP: Erosive Oral lichen planus |
| LP: leukoplakia | ||
| NEOLP: Non-erosive oral lichen planus | ||
| OSCC: Oral squamous cell carcinoma |
| ∗log2FC in expression of this searched gene in stem-like cells from each diseased tissue sample relative to stem-like cells in normal samples in each tissue plotted against the malignancy continuum. Samples are colored based on if they are from different disease stage. |
Top |
Malignant transformation related pathway analysis |
| Find out the enriched GO biological processes and KEGG pathways involved in transition from healthy to precancer to cancer |
| Tissue | Disease Stage | Enriched GO biological Processes |
| Colorectum | AD |  |
| Colorectum | SER |  |
| Colorectum | MSS |  |
| Colorectum | MSI-H |  |
| Colorectum | FAP |  |
| ∗Top 15 enriched GO BP terms are showed in the bar plot of each disease state in each tissue. Each row represents a significant GO biological process which is colored according to the -log10(p.adjust). |
| Page: 1 2 3 4 5 6 7 8 9 |
| GO ID | Tissue | Disease Stage | Description | Gene Ratio | Bg Ratio | pvalue | p.adjust | Count |
| GO:0010038 | Colorectum | AD | response to metal ion | 106/3918 | 373/18723 | 3.22e-04 | 3.83e-03 | 106 |
| GO:0071248 | Colorectum | AD | cellular response to metal ion | 61/3918 | 197/18723 | 5.74e-04 | 6.09e-03 | 61 |
| GO:0071241 | Colorectum | AD | cellular response to inorganic substance | 68/3918 | 226/18723 | 6.98e-04 | 7.10e-03 | 68 |
| GO:00100381 | Colorectum | SER | response to metal ion | 84/2897 | 373/18723 | 1.87e-04 | 3.44e-03 | 84 |
| GO:00712411 | Colorectum | SER | cellular response to inorganic substance | 52/2897 | 226/18723 | 1.77e-03 | 1.82e-02 | 52 |
| GO:00712481 | Colorectum | SER | cellular response to metal ion | 46/2897 | 197/18723 | 2.31e-03 | 2.21e-02 | 46 |
| GO:00100382 | Colorectum | MSS | response to metal ion | 90/3467 | 373/18723 | 3.76e-03 | 2.76e-02 | 90 |
| GO:00712412 | Colorectum | MSS | cellular response to inorganic substance | 57/3467 | 226/18723 | 7.27e-03 | 4.64e-02 | 57 |
| GO:001003827 | Esophagus | ESCC | response to metal ion | 208/8552 | 373/18723 | 5.02e-05 | 3.90e-04 | 208 |
| GO:007124117 | Esophagus | ESCC | cellular response to inorganic substance | 125/8552 | 226/18723 | 2.17e-03 | 9.67e-03 | 125 |
| GO:001003820 | Oral cavity | OSCC | response to metal ion | 188/7305 | 373/18723 | 4.34e-06 | 5.00e-05 | 188 |
| GO:007124115 | Oral cavity | OSCC | cellular response to inorganic substance | 111/7305 | 226/18723 | 1.22e-03 | 6.10e-03 | 111 |
| GO:007124816 | Oral cavity | OSCC | cellular response to metal ion | 93/7305 | 197/18723 | 1.14e-02 | 3.85e-02 | 93 |
| Page: 1 |
| Pathway ID | Tissue | Disease Stage | Description | Gene Ratio | Bg Ratio | pvalue | p.adjust | qvalue | Count |
| Page: 1 |
Top |
Cell-cell communication analysis |
| Identification of potential cell-cell interactions between two cell types and their ligand-receptor pairs for different disease states |
| Ligand | Receptor | LRpair | Pathway | Tissue | Disease Stage |
| Page: 1 |
Top |
Single-cell gene regulatory network inference analysis |
| Find out the significant the regulons (TFs) and the target genes of each regulon across cell types for different disease states |
| TF | Cell Type | Tissue | Disease Stage | Target Gene | RSS | Regulon Activity |
| ∗The dot plots of a searched regulon are shown for all cell subpopulations in each disease state of each tissue based on the regulon specific score inferred using pySCENIC and by calculating the average expression. |
| Page: 1 |
Top |
Somatic mutation of malignant transformation related genes |
| Annotation of somatic variants for genes involved in malignant transformation |
| Hugo Symbol | Variant Class | Variant Classification | dbSNP RS | HGVSc | HGVSp | HGVSp Short | SWISSPROT | BIOTYPE | SIFT | PolyPhen | Tumor Sample Barcode | Tissue | Histology | Sex | Age | Stage | Therapy Types | Drugs | Outcome |
| CPNE2 | SNV | Missense_Mutation | c.1394T>C | p.Met465Thr | p.M465T | Q96FN4 | protein_coding | deleterious(0.01) | possibly_damaging(0.893) | TCGA-AR-A1AV-01 | Breast | breast invasive carcinoma | Male | >=65 | I/II | Chemotherapy | cytoxan | SD | |
| CPNE2 | SNV | Missense_Mutation | c.526N>C | p.Asp176His | p.D176H | Q96FN4 | protein_coding | deleterious(0) | probably_damaging(0.994) | TCGA-BH-A0BZ-01 | Breast | breast invasive carcinoma | Female | <65 | III/IV | Chemotherapy | doxorubicin | CR | |
| CPNE2 | insertion | Frame_Shift_Ins | novel | c.204_205insTGGATCTCATTTGTTTCTTTCTT | p.Asn69TrpfsTer74 | p.N69Wfs*74 | Q96FN4 | protein_coding | TCGA-A8-A09C-01 | Breast | breast invasive carcinoma | Female | >=65 | I/II | Unknown | Unknown | SD | ||
| CPNE2 | deletion | Frame_Shift_Del | novel | c.48delC | p.Met17TrpfsTer14 | p.M17Wfs*14 | Q96FN4 | protein_coding | TCGA-EW-A2FV-01 | Breast | breast invasive carcinoma | Female | <65 | III/IV | Chemotherapy | docetaxel | SD | ||
| CPNE2 | SNV | Missense_Mutation | novel | c.99G>C | p.Gln33His | p.Q33H | Q96FN4 | protein_coding | tolerated(0.08) | possibly_damaging(0.699) | TCGA-VS-A9U6-01 | Cervix | cervical & endocervical cancer | Female | <65 | I/II | Chemotherapy | cisplatin | PD |
| CPNE2 | SNV | Missense_Mutation | rs748317019 | c.1295N>T | p.Thr432Met | p.T432M | Q96FN4 | protein_coding | tolerated(0.11) | possibly_damaging(0.631) | TCGA-AA-3864-01 | Colorectum | colon adenocarcinoma | Male | >=65 | I/II | Unknown | Unknown | SD |
| CPNE2 | SNV | Missense_Mutation | rs760327598 | c.1463N>A | p.Arg488His | p.R488H | Q96FN4 | protein_coding | tolerated(0.06) | benign(0) | TCGA-AU-6004-01 | Colorectum | colon adenocarcinoma | Female | >=65 | I/II | Unknown | Unknown | SD |
| CPNE2 | SNV | Missense_Mutation | c.1202G>A | p.Cys401Tyr | p.C401Y | Q96FN4 | protein_coding | deleterious(0) | probably_damaging(0.916) | TCGA-AY-6196-01 | Colorectum | colon adenocarcinoma | Male | <65 | III/IV | Unknown | Unknown | SD | |
| CPNE2 | SNV | Missense_Mutation | rs768137060 | c.220N>A | p.Ala74Thr | p.A74T | Q96FN4 | protein_coding | tolerated(0.5) | benign(0.013) | TCGA-AZ-4315-01 | Colorectum | colon adenocarcinoma | Male | <65 | I/II | Unknown | Unknown | SD |
| CPNE2 | SNV | Missense_Mutation | rs757386451 | c.466G>A | p.Val156Ile | p.V156I | Q96FN4 | protein_coding | tolerated(0.35) | benign(0.001) | TCGA-AZ-6601-01 | Colorectum | colon adenocarcinoma | Male | >=65 | I/II | Unknown | Unknown | PD |
| Page: 1 2 3 4 5 6 |
Top |
Related drugs of malignant transformation related genes |
| Identification of chemicals and drugs interact with genes involved in malignant transfromation |
| (DGIdb 4.0) |
| Entrez ID | Symbol | Category | Interaction Types | Drug Claim Name | Drug Name | PMIDs |
| Page: 1 |

Copyright 2023-Present -The University of Texas Health Science Center at Houston |