
|
|||||
|
 | |
| |
| |
| |
| |
| |
|
Gene: COPS6 |
Gene summary for COPS6 |
| Gene information | Species | Human | Gene symbol | COPS6 | Gene ID | 10980 |
| Gene name | COP9 signalosome subunit 6 | |
| Gene Alias | CSN6 | |
| Cytomap | 7q22.1 | |
| Gene Type | protein-coding | GO ID | GO:0000338 | UniProtAcc | Q7L5N1 |
Top |
Malignant transformation analysis |
| Identification of the aberrant gene expression in precancerous and cancerous lesions by comparing the gene expression of stem-like cells in diseased tissues with normal stem cells |
| Entrez ID | Symbol | Replicates | Species | Organ | Tissue | Adj P-value | Log2FC | Malignancy |
| 10980 | COPS6 | AEH-subject3 | Human | Endometrium | AEH | 7.59e-15 | -3.71e-01 | -0.2576 |
| 10980 | COPS6 | AEH-subject4 | Human | Endometrium | AEH | 4.45e-19 | -5.59e-01 | -0.2657 |
| 10980 | COPS6 | AEH-subject5 | Human | Endometrium | AEH | 2.60e-17 | -5.01e-01 | -0.2953 |
| 10980 | COPS6 | EEC-subject1 | Human | Endometrium | EEC | 7.47e-26 | -5.22e-01 | -0.2682 |
| 10980 | COPS6 | EEC-subject2 | Human | Endometrium | EEC | 1.18e-22 | -4.99e-01 | -0.2607 |
| 10980 | COPS6 | EEC-subject3 | Human | Endometrium | EEC | 9.59e-45 | -5.09e-01 | -0.2525 |
| 10980 | COPS6 | EEC-subject4 | Human | Endometrium | EEC | 3.82e-13 | -3.70e-01 | -0.2571 |
| 10980 | COPS6 | EEC-subject5 | Human | Endometrium | EEC | 1.02e-07 | -3.23e-01 | -0.249 |
| 10980 | COPS6 | GSM5276934 | Human | Endometrium | EEC | 7.38e-09 | -3.21e-01 | -0.0913 |
| 10980 | COPS6 | GSM5276935 | Human | Endometrium | EEC | 2.48e-03 | -2.76e-01 | -0.123 |
| 10980 | COPS6 | GSM5276937 | Human | Endometrium | EEC | 4.52e-04 | -3.20e-01 | -0.0897 |
| 10980 | COPS6 | GSM6177620_NYU_UCEC1_lib1_lib1 | Human | Endometrium | EEC | 1.97e-38 | -5.55e-01 | -0.1869 |
| 10980 | COPS6 | GSM6177620_NYU_UCEC1_lib2_lib2 | Human | Endometrium | EEC | 3.30e-38 | -5.17e-01 | -0.1875 |
| 10980 | COPS6 | GSM6177620_NYU_UCEC1_lib3_lib3 | Human | Endometrium | EEC | 1.45e-36 | -5.09e-01 | -0.1883 |
| 10980 | COPS6 | GSM6177621_NYU_UCEC2_lib1_lib1 | Human | Endometrium | EEC | 6.72e-36 | -4.68e-01 | -0.1934 |
| 10980 | COPS6 | GSM6177622_NYU_UCEC3_lib1_lib1 | Human | Endometrium | EEC | 1.61e-66 | -4.61e-01 | -0.1917 |
| 10980 | COPS6 | GSM6177622_NYU_UCEC3_lib2_lib2 | Human | Endometrium | EEC | 4.16e-54 | -5.08e-01 | -0.1916 |
| 10980 | COPS6 | GSM6177623_NYU_UCEC3_Vis | Human | Endometrium | EEC | 2.80e-15 | -2.75e-01 | -0.1269 |
| 10980 | COPS6 | LZE4T | Human | Esophagus | ESCC | 1.84e-11 | 5.67e-01 | 0.0811 |
| 10980 | COPS6 | LZE7T | Human | Esophagus | ESCC | 3.45e-08 | 7.47e-01 | 0.0667 |
| Page: 1 2 3 4 5 6 7 8 9 |
| Tissue | Expression Dynamics | Abbreviation |
| Colorectum (GSE201348) |  | FAP: Familial adenomatous polyposis |
| CRC: Colorectal cancer | ||
| Colorectum (HTA11) |  | AD: Adenomas |
| SER: Sessile serrated lesions | ||
| MSI-H: Microsatellite-high colorectal cancer | ||
| MSS: Microsatellite stable colorectal cancer | ||
| Endometrium |  | AEH: Atypical endometrial hyperplasia |
| EEC: Endometrioid Cancer | ||
| Esophagus | 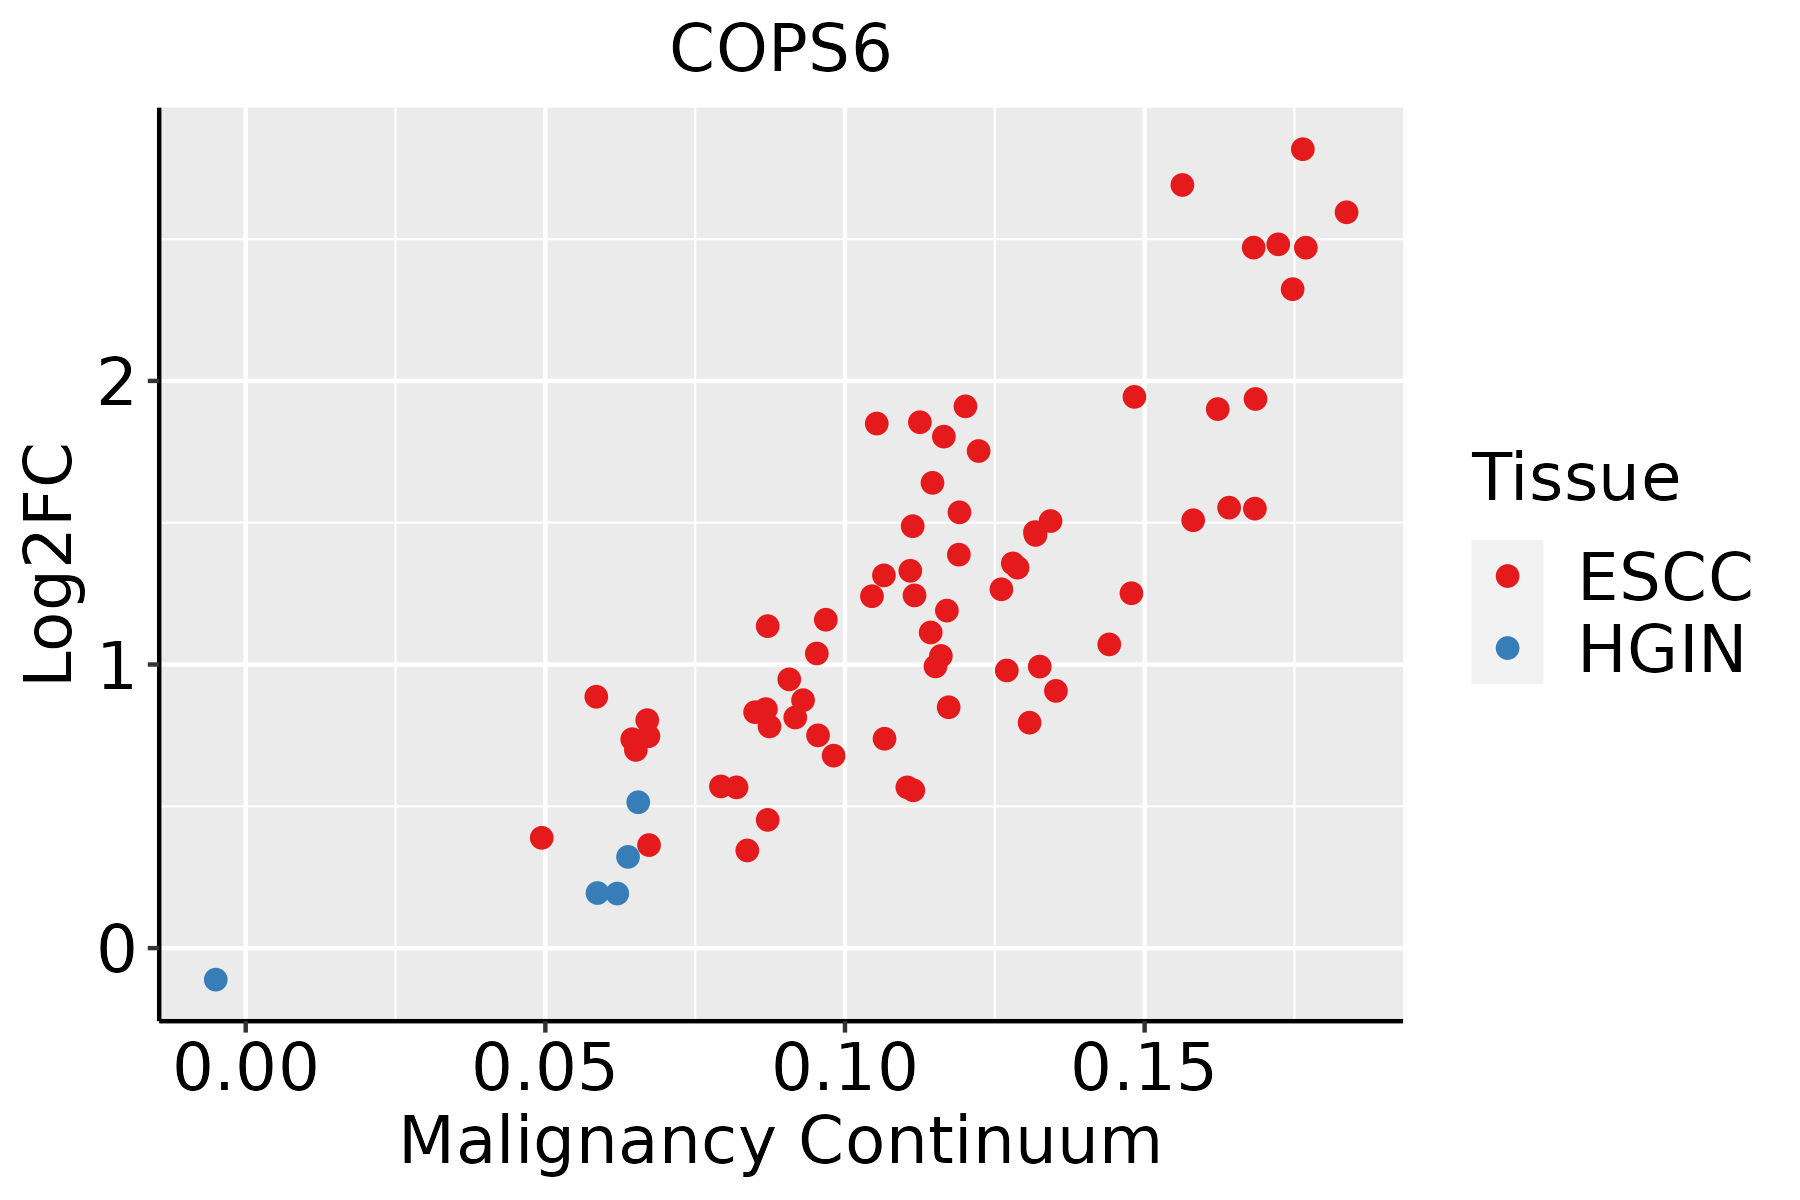 | ESCC: Esophageal squamous cell carcinoma |
| HGIN: High-grade intraepithelial neoplasias | ||
| LGIN: Low-grade intraepithelial neoplasias | ||
| Liver | 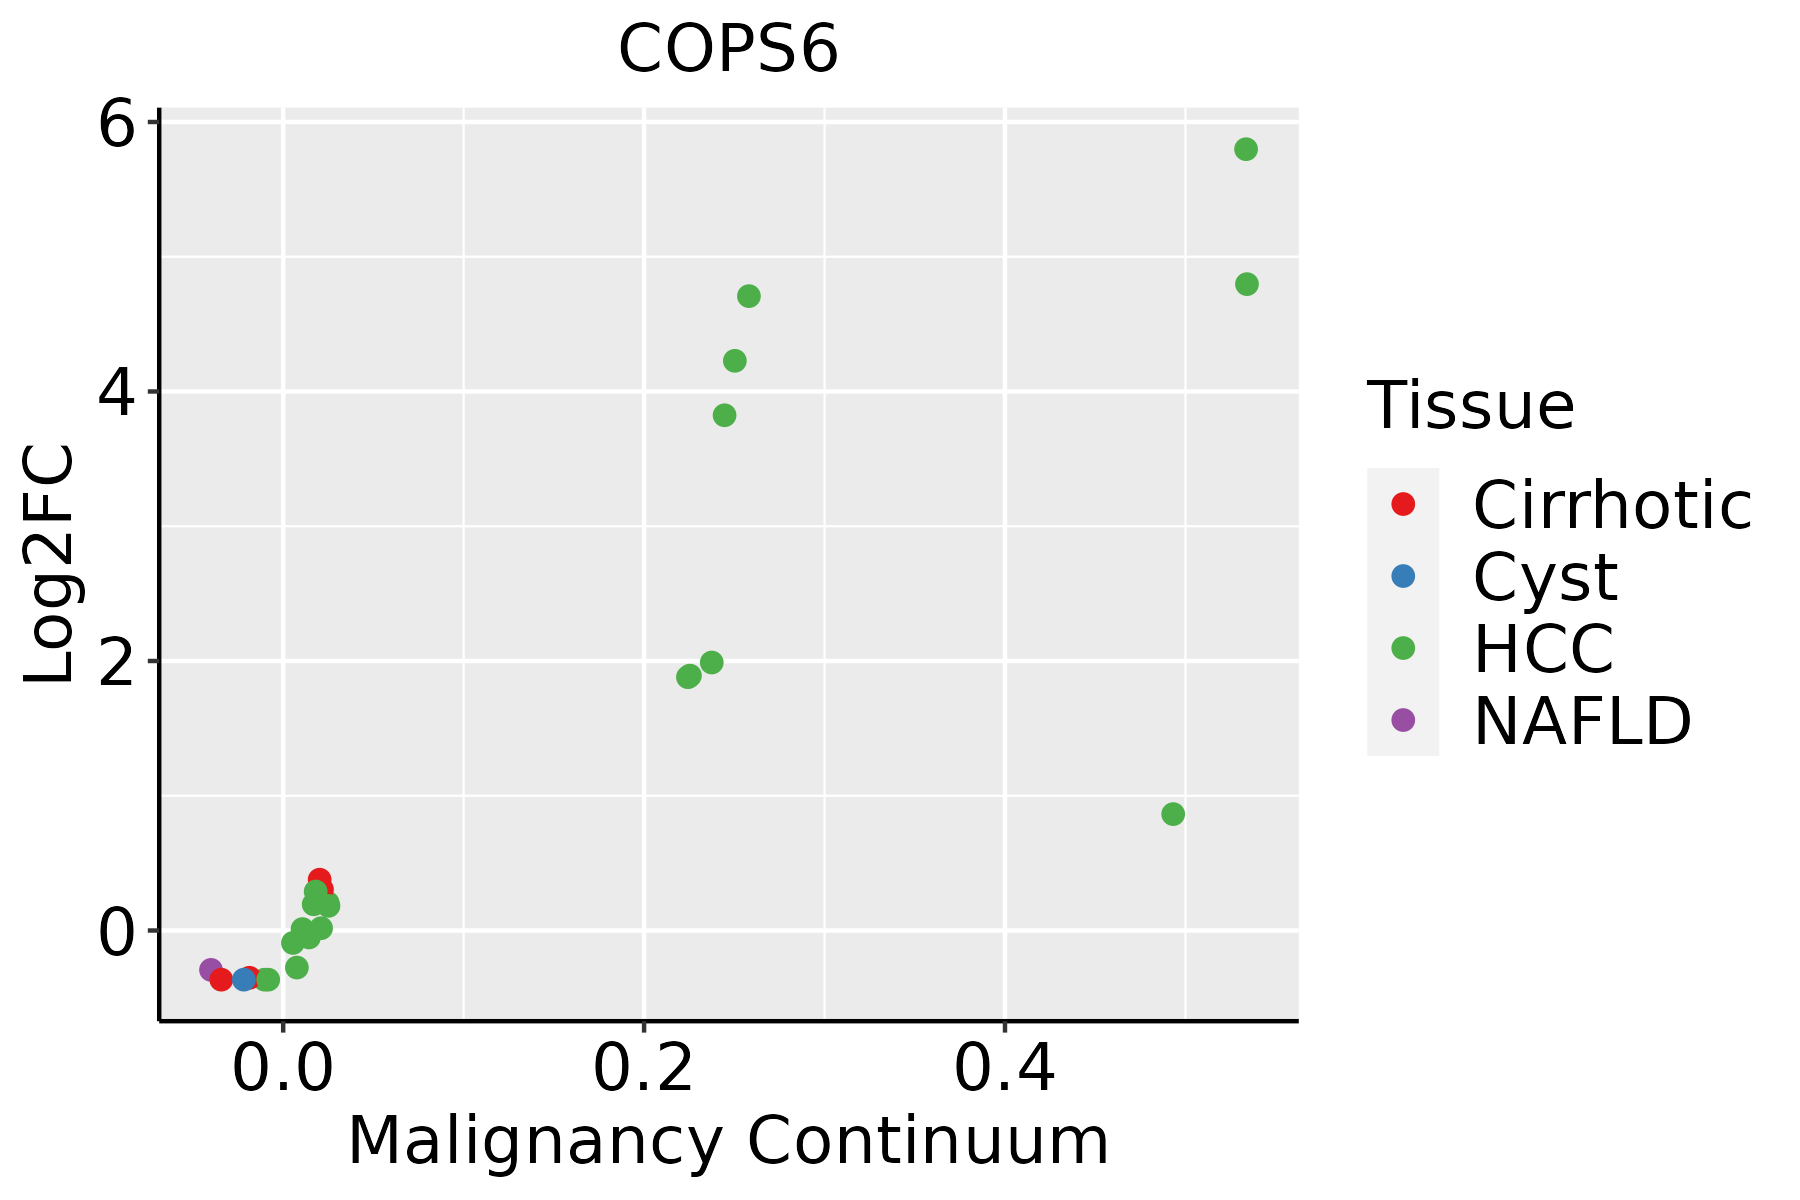 | HCC: Hepatocellular carcinoma |
| NAFLD: Non-alcoholic fatty liver disease | ||
| Oral Cavity | 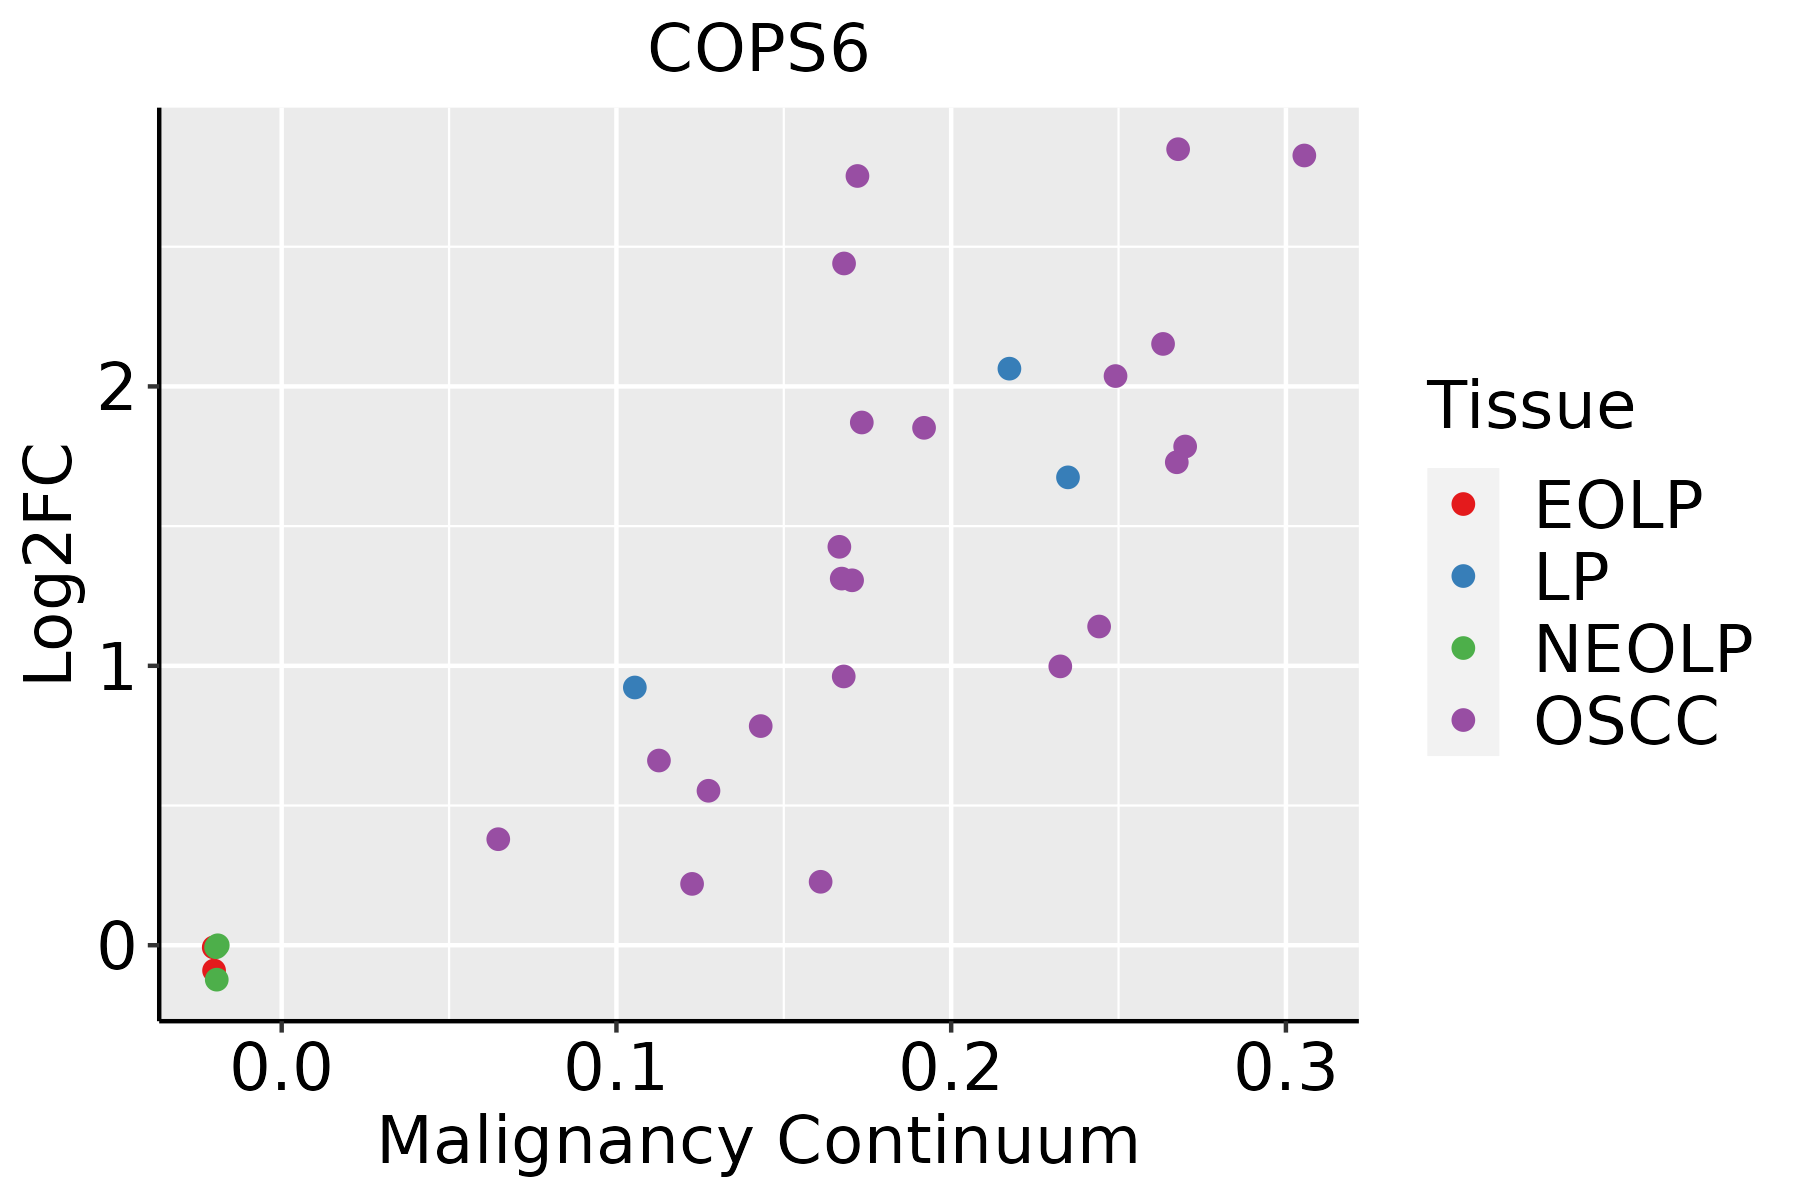 | EOLP: Erosive Oral lichen planus |
| LP: leukoplakia | ||
| NEOLP: Non-erosive oral lichen planus | ||
| OSCC: Oral squamous cell carcinoma | ||
| Prostate |  | BPH: Benign Prostatic Hyperplasia |
| Skin |  | AK: Actinic keratosis |
| cSCC: Cutaneous squamous cell carcinoma | ||
| SCCIS:squamous cell carcinoma in situ | ||
| Thyroid | 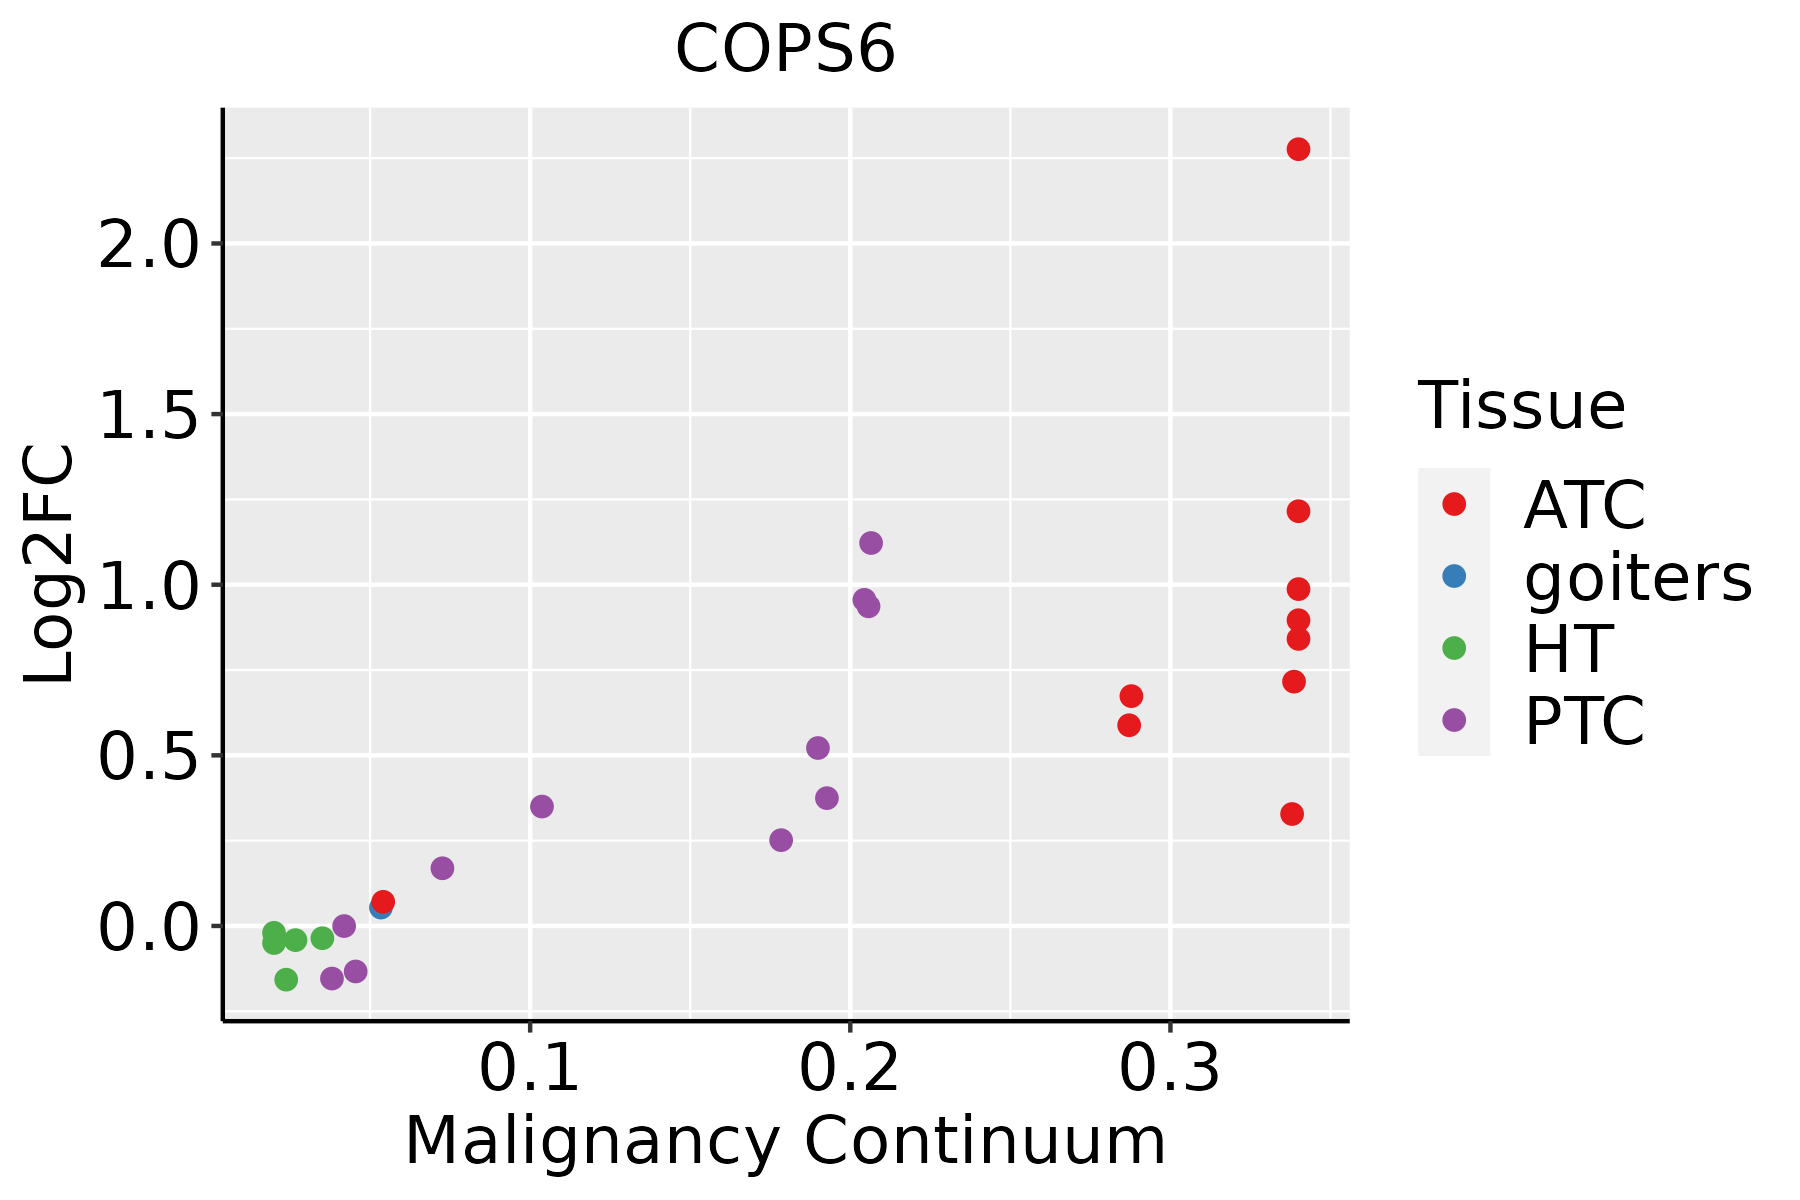 | ATC: Anaplastic thyroid cancer |
| HT: Hashimoto's thyroiditis | ||
| PTC: Papillary thyroid cancer |
| ∗log2FC in expression of this searched gene in stem-like cells from each diseased tissue sample relative to stem-like cells in normal samples in each tissue plotted against the malignancy continuum. Samples are colored based on if they are from different disease stage. |
Top |
Malignant transformation related pathway analysis |
| Find out the enriched GO biological processes and KEGG pathways involved in transition from healthy to precancer to cancer |
| Tissue | Disease Stage | Enriched GO biological Processes |
| Colorectum | AD |  |
| Colorectum | SER |  |
| Colorectum | MSS |  |
| Colorectum | MSI-H |  |
| Colorectum | FAP |  |
| ∗Top 15 enriched GO BP terms are showed in the bar plot of each disease state in each tissue. Each row represents a significant GO biological process which is colored according to the -log10(p.adjust). |
| Page: 1 2 3 4 5 6 7 8 9 |
| GO ID | Tissue | Disease Stage | Description | Gene Ratio | Bg Ratio | pvalue | p.adjust | Count |
| GO:00003383 | Esophagus | HGIN | protein deneddylation | 6/2587 | 10/18723 | 8.81e-04 | 1.13e-02 | 6 |
| GO:00706463 | Esophagus | HGIN | protein modification by small protein removal | 34/2587 | 157/18723 | 4.68e-03 | 4.02e-02 | 34 |
| GO:007064612 | Esophagus | ESCC | protein modification by small protein removal | 95/8552 | 157/18723 | 1.25e-04 | 8.56e-04 | 95 |
| GO:000033812 | Esophagus | ESCC | protein deneddylation | 10/8552 | 10/18723 | 3.94e-04 | 2.26e-03 | 10 |
| GO:0000338 | Liver | Cirrhotic | protein deneddylation | 7/4634 | 10/18723 | 3.29e-03 | 1.83e-02 | 7 |
| GO:00706461 | Liver | HCC | protein modification by small protein removal | 91/7958 | 157/18723 | 6.50e-05 | 5.92e-04 | 91 |
| GO:00003381 | Liver | HCC | protein deneddylation | 9/7958 | 10/18723 | 2.79e-03 | 1.31e-02 | 9 |
| GO:00003382 | Oral cavity | OSCC | protein deneddylation | 10/7305 | 10/18723 | 8.14e-05 | 6.26e-04 | 10 |
| GO:00706462 | Oral cavity | OSCC | protein modification by small protein removal | 77/7305 | 157/18723 | 6.55e-03 | 2.43e-02 | 77 |
| GO:000033811 | Oral cavity | LP | protein deneddylation | 9/4623 | 10/18723 | 2.64e-05 | 4.21e-04 | 9 |
| GO:00003384 | Skin | cSCC | protein deneddylation | 10/4864 | 10/18723 | 1.39e-06 | 2.40e-05 | 10 |
| GO:00706464 | Skin | cSCC | protein modification by small protein removal | 55/4864 | 157/18723 | 7.29e-03 | 3.46e-02 | 55 |
| GO:00706465 | Thyroid | PTC | protein modification by small protein removal | 71/5968 | 157/18723 | 3.03e-04 | 2.12e-03 | 71 |
| GO:007064613 | Thyroid | ATC | protein modification by small protein removal | 71/6293 | 157/18723 | 1.59e-03 | 7.99e-03 | 71 |
| Page: 1 |
| Pathway ID | Tissue | Disease Stage | Description | Gene Ratio | Bg Ratio | pvalue | p.adjust | qvalue | Count |
| Page: 1 |
Top |
Cell-cell communication analysis |
| Identification of potential cell-cell interactions between two cell types and their ligand-receptor pairs for different disease states |
| Ligand | Receptor | LRpair | Pathway | Tissue | Disease Stage |
| Page: 1 |
Top |
Single-cell gene regulatory network inference analysis |
| Find out the significant the regulons (TFs) and the target genes of each regulon across cell types for different disease states |
| TF | Cell Type | Tissue | Disease Stage | Target Gene | RSS | Regulon Activity |
| ∗The dot plots of a searched regulon are shown for all cell subpopulations in each disease state of each tissue based on the regulon specific score inferred using pySCENIC and by calculating the average expression. |
| Page: 1 |
Top |
Somatic mutation of malignant transformation related genes |
| Annotation of somatic variants for genes involved in malignant transformation |
| Hugo Symbol | Variant Class | Variant Classification | dbSNP RS | HGVSc | HGVSp | HGVSp Short | SWISSPROT | BIOTYPE | SIFT | PolyPhen | Tumor Sample Barcode | Tissue | Histology | Sex | Age | Stage | Therapy Types | Drugs | Outcome |
| COPS6 | SNV | Missense_Mutation | c.793N>T | p.His265Tyr | p.H265Y | Q7L5N1 | protein_coding | tolerated(0.16) | possibly_damaging(0.836) | TCGA-D8-A27G-01 | Breast | breast invasive carcinoma | Female | >=65 | I/II | Unknown | Unknown | SD | |
| COPS6 | insertion | Nonsense_Mutation | novel | c.170_171insTGGTCTCTTCCTTGTTCTATAATTGGGAAGATAAGCTTGTAATCAA | p.Met58GlyfsTer7 | p.M58Gfs*7 | Q7L5N1 | protein_coding | TCGA-A2-A04Y-01 | Breast | breast invasive carcinoma | Female | <65 | I/II | Chemotherapy | cytoxan | SD | ||
| COPS6 | insertion | Nonsense_Mutation | novel | c.547_548insAAGAAAGCAAAGGATGAGAGGAGACAGGATAGAAGGGAGTAGTTA | p.Phe183delinsTer | p.F183delins* | Q7L5N1 | protein_coding | TCGA-BH-A0E2-01 | Breast | breast invasive carcinoma | Female | <65 | III/IV | Chemotherapy | doxorubicin | SD | ||
| COPS6 | SNV | Missense_Mutation | c.439G>A | p.Glu147Lys | p.E147K | Q7L5N1 | protein_coding | deleterious(0) | probably_damaging(0.99) | TCGA-AA-3655-01 | Colorectum | colon adenocarcinoma | Male | >=65 | I/II | Unknown | Unknown | SD | |
| COPS6 | SNV | Missense_Mutation | novel | c.664N>T | p.Ile222Leu | p.I222L | Q7L5N1 | protein_coding | tolerated(0.77) | benign(0.003) | TCGA-AA-3697-01 | Colorectum | colon adenocarcinoma | Male | >=65 | I/II | Unknown | Unknown | SD |
| COPS6 | SNV | Missense_Mutation | c.472A>C | p.Thr158Pro | p.T158P | Q7L5N1 | protein_coding | tolerated(0.24) | benign(0.001) | TCGA-AA-3977-01 | Colorectum | colon adenocarcinoma | Male | >=65 | I/II | Unknown | Unknown | SD | |
| COPS6 | SNV | Missense_Mutation | c.313N>C | p.Tyr105His | p.Y105H | Q7L5N1 | protein_coding | deleterious(0) | probably_damaging(0.982) | TCGA-AA-A010-01 | Colorectum | colon adenocarcinoma | Female | <65 | I/II | Chemotherapy | folinic | CR | |
| COPS6 | SNV | Missense_Mutation | c.179N>T | p.Ser60Phe | p.S60F | Q7L5N1 | protein_coding | deleterious(0) | possibly_damaging(0.638) | TCGA-AZ-6599-01 | Colorectum | colon adenocarcinoma | Male | >=65 | I/II | Unknown | Unknown | SD | |
| COPS6 | SNV | Missense_Mutation | c.592N>T | p.Ile198Phe | p.I198F | Q7L5N1 | protein_coding | deleterious(0) | probably_damaging(0.998) | TCGA-CK-4951-01 | Colorectum | colon adenocarcinoma | Female | >=65 | I/II | Unknown | Unknown | PD | |
| COPS6 | SNV | Missense_Mutation | c.722N>T | p.Tyr241Phe | p.Y241F | Q7L5N1 | protein_coding | deleterious(0.04) | possibly_damaging(0.888) | TCGA-CK-4951-01 | Colorectum | colon adenocarcinoma | Female | >=65 | I/II | Unknown | Unknown | PD |
| Page: 1 2 3 4 |
Top |
Related drugs of malignant transformation related genes |
| Identification of chemicals and drugs interact with genes involved in malignant transfromation |
| (DGIdb 4.0) |
| Entrez ID | Symbol | Category | Interaction Types | Drug Claim Name | Drug Name | PMIDs |
| Page: 1 |

Copyright 2023-Present -The University of Texas Health Science Center at Houston |