
|
|||||
|
 | |
| |
| |
| |
| |
| |
|
Gene: COMMD3 |
Gene summary for COMMD3 |
| Gene information | Species | Human | Gene symbol | COMMD3 | Gene ID | 23412 |
| Gene name | COMM domain containing 3 | |
| Gene Alias | BUP | |
| Cytomap | 10p12.2 | |
| Gene Type | protein-coding | GO ID | GO:0006810 | UniProtAcc | Q9UBI1 |
Top |
Malignant transformation analysis |
| Identification of the aberrant gene expression in precancerous and cancerous lesions by comparing the gene expression of stem-like cells in diseased tissues with normal stem cells |
| Entrez ID | Symbol | Replicates | Species | Organ | Tissue | Adj P-value | Log2FC | Malignancy |
| 23412 | COMMD3 | HTA11_2487_2000001011 | Human | Colorectum | SER | 8.42e-05 | 1.71e-01 | -0.1808 |
| 23412 | COMMD3 | HTA11_1938_2000001011 | Human | Colorectum | AD | 8.45e-11 | 3.40e-01 | -0.0811 |
| 23412 | COMMD3 | HTA11_78_2000001011 | Human | Colorectum | AD | 7.65e-07 | 2.34e-01 | -0.1088 |
| 23412 | COMMD3 | HTA11_347_2000001011 | Human | Colorectum | AD | 1.02e-14 | 2.91e-01 | -0.1954 |
| 23412 | COMMD3 | HTA11_411_2000001011 | Human | Colorectum | SER | 5.61e-03 | 3.31e-01 | -0.2602 |
| 23412 | COMMD3 | HTA11_3361_2000001011 | Human | Colorectum | AD | 4.57e-06 | 2.46e-01 | -0.1207 |
| 23412 | COMMD3 | HTA11_696_2000001011 | Human | Colorectum | AD | 9.04e-05 | 1.23e-01 | -0.1464 |
| 23412 | COMMD3 | HTA11_866_2000001011 | Human | Colorectum | AD | 9.04e-05 | 1.23e-01 | -0.1001 |
| 23412 | COMMD3 | HTA11_1391_2000001011 | Human | Colorectum | AD | 2.86e-09 | 2.56e-01 | -0.059 |
| 23412 | COMMD3 | HTA11_5212_2000001011 | Human | Colorectum | AD | 2.28e-02 | 1.70e-01 | -0.2061 |
| 23412 | COMMD3 | HTA11_5216_2000001011 | Human | Colorectum | SER | 3.40e-03 | 3.08e-01 | -0.1462 |
| 23412 | COMMD3 | HTA11_7862_2000001011 | Human | Colorectum | AD | 3.08e-04 | 2.34e-01 | -0.0179 |
| 23412 | COMMD3 | HTA11_866_3004761011 | Human | Colorectum | AD | 5.92e-06 | 1.66e-01 | 0.096 |
| 23412 | COMMD3 | HTA11_4255_2000001011 | Human | Colorectum | SER | 3.40e-02 | 1.93e-01 | 0.0446 |
| 23412 | COMMD3 | HTA11_8622_2000001021 | Human | Colorectum | SER | 3.19e-02 | 1.83e-01 | 0.0528 |
| 23412 | COMMD3 | HTA11_7663_2000001011 | Human | Colorectum | SER | 7.76e-07 | 3.34e-01 | 0.0131 |
| 23412 | COMMD3 | HTA11_10623_2000001011 | Human | Colorectum | AD | 2.05e-04 | 2.63e-01 | -0.0177 |
| 23412 | COMMD3 | HTA11_6801_2000001011 | Human | Colorectum | SER | 1.19e-07 | 3.58e-01 | 0.0171 |
| 23412 | COMMD3 | HTA11_7696_3000711011 | Human | Colorectum | AD | 8.62e-04 | 1.18e-01 | 0.0674 |
| 23412 | COMMD3 | HTA11_6818_2000001011 | Human | Colorectum | AD | 1.74e-03 | 1.82e-01 | 0.0112 |
| Page: 1 2 3 4 5 6 7 8 9 |
| Tissue | Expression Dynamics | Abbreviation |
| Breast | 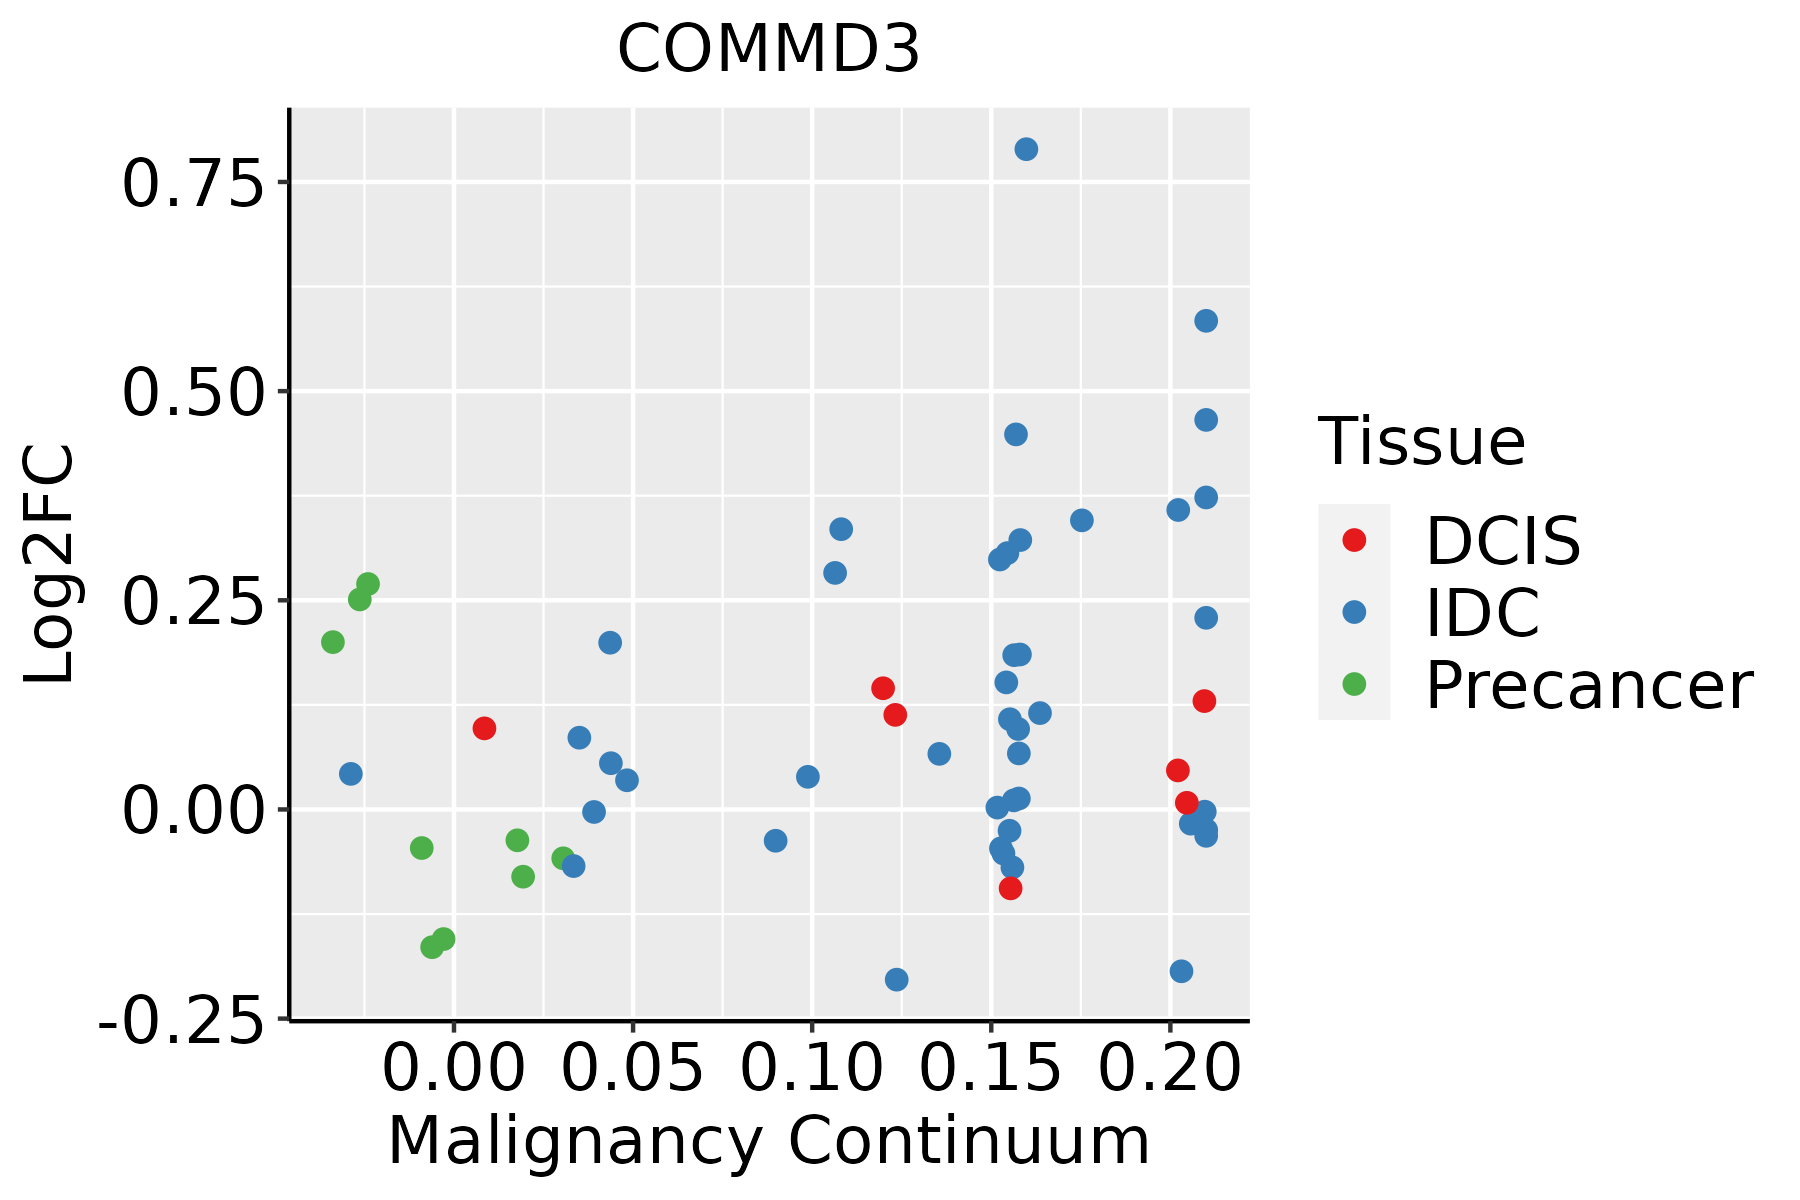 | IDC: Invasive ductal carcinoma |
| DCIS: Ductal carcinoma in situ | ||
| Precancer(BRCA1-mut): Precancerous lesion from BRCA1 mutation carriers | ||
| Colorectum (GSE201348) | 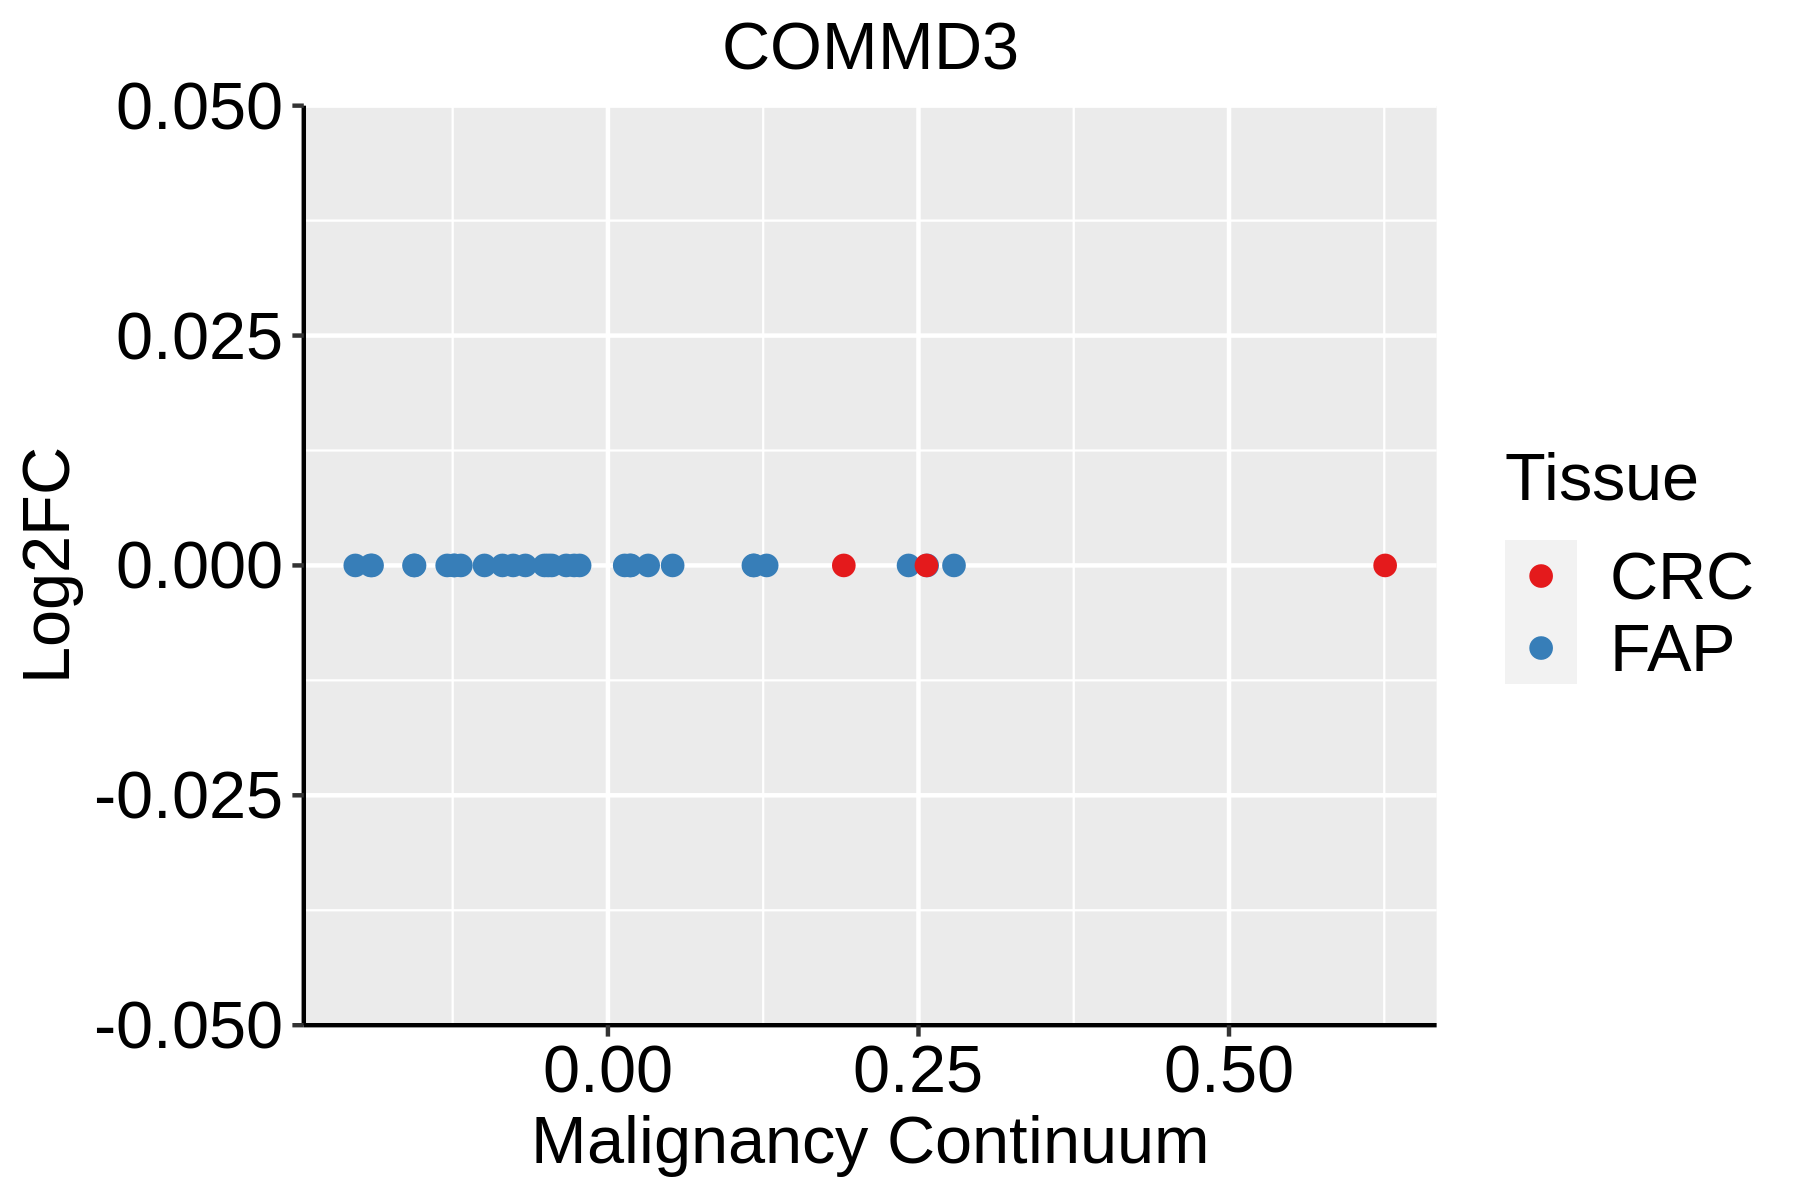 | FAP: Familial adenomatous polyposis |
| CRC: Colorectal cancer | ||
| Colorectum (HTA11) |  | AD: Adenomas |
| SER: Sessile serrated lesions | ||
| MSI-H: Microsatellite-high colorectal cancer | ||
| MSS: Microsatellite stable colorectal cancer | ||
| Esophagus | 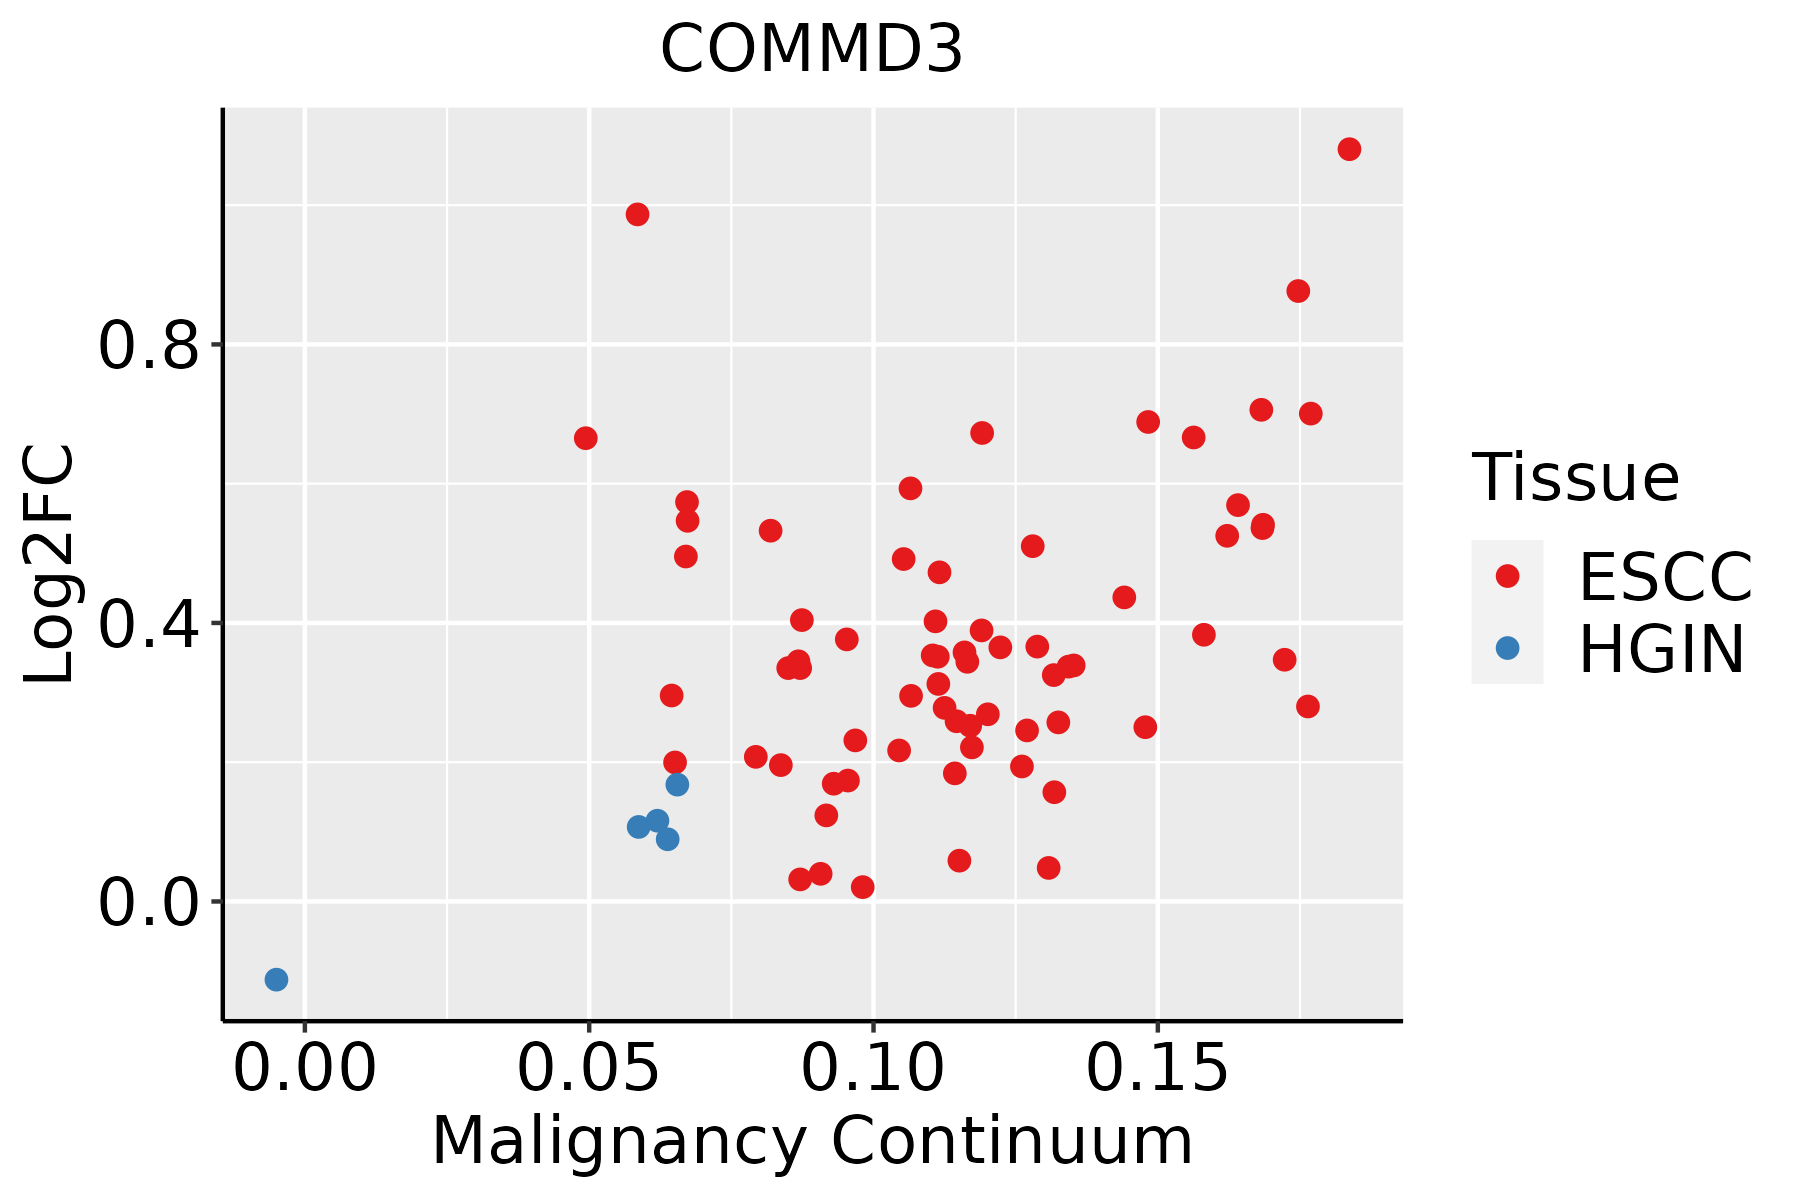 | ESCC: Esophageal squamous cell carcinoma |
| HGIN: High-grade intraepithelial neoplasias | ||
| LGIN: Low-grade intraepithelial neoplasias | ||
| Liver |  | HCC: Hepatocellular carcinoma |
| NAFLD: Non-alcoholic fatty liver disease | ||
| Oral Cavity | 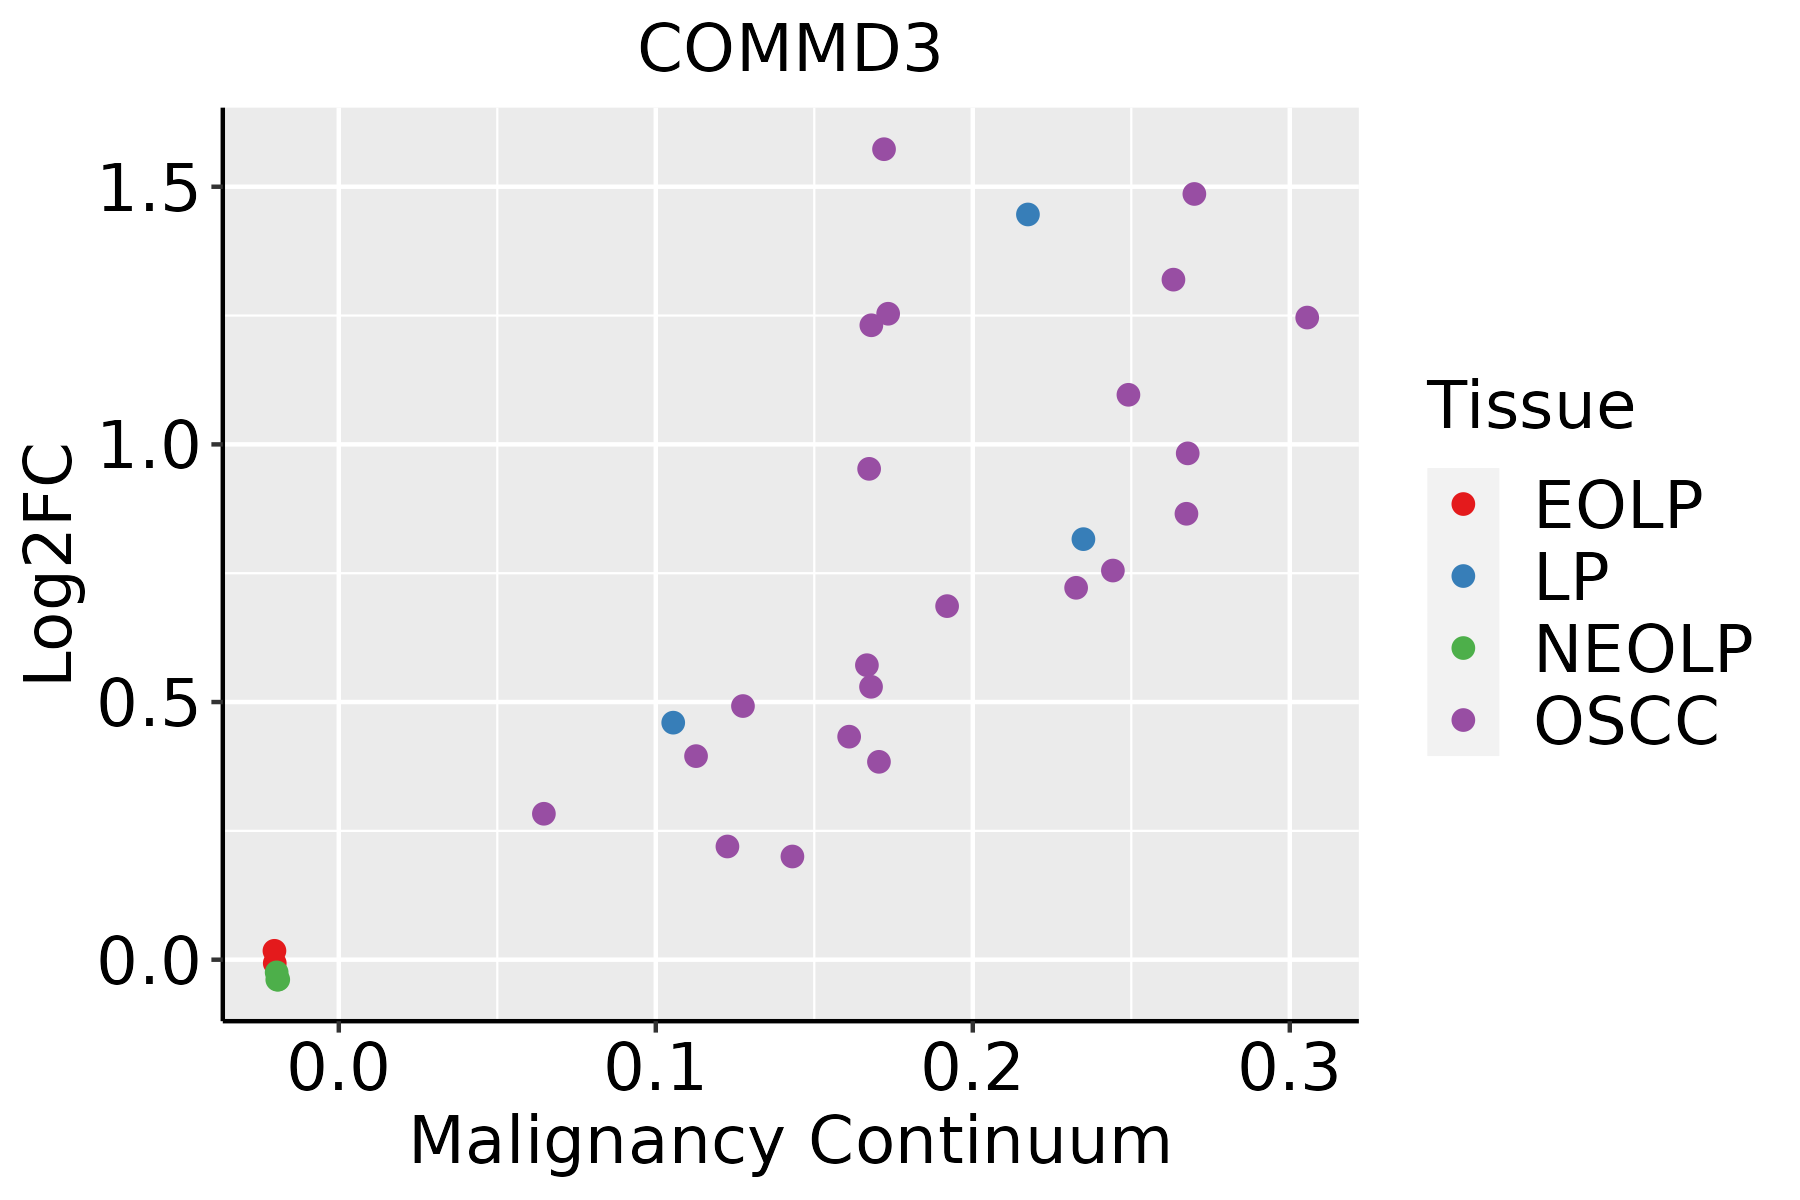 | EOLP: Erosive Oral lichen planus |
| LP: leukoplakia | ||
| NEOLP: Non-erosive oral lichen planus | ||
| OSCC: Oral squamous cell carcinoma | ||
| Prostate | 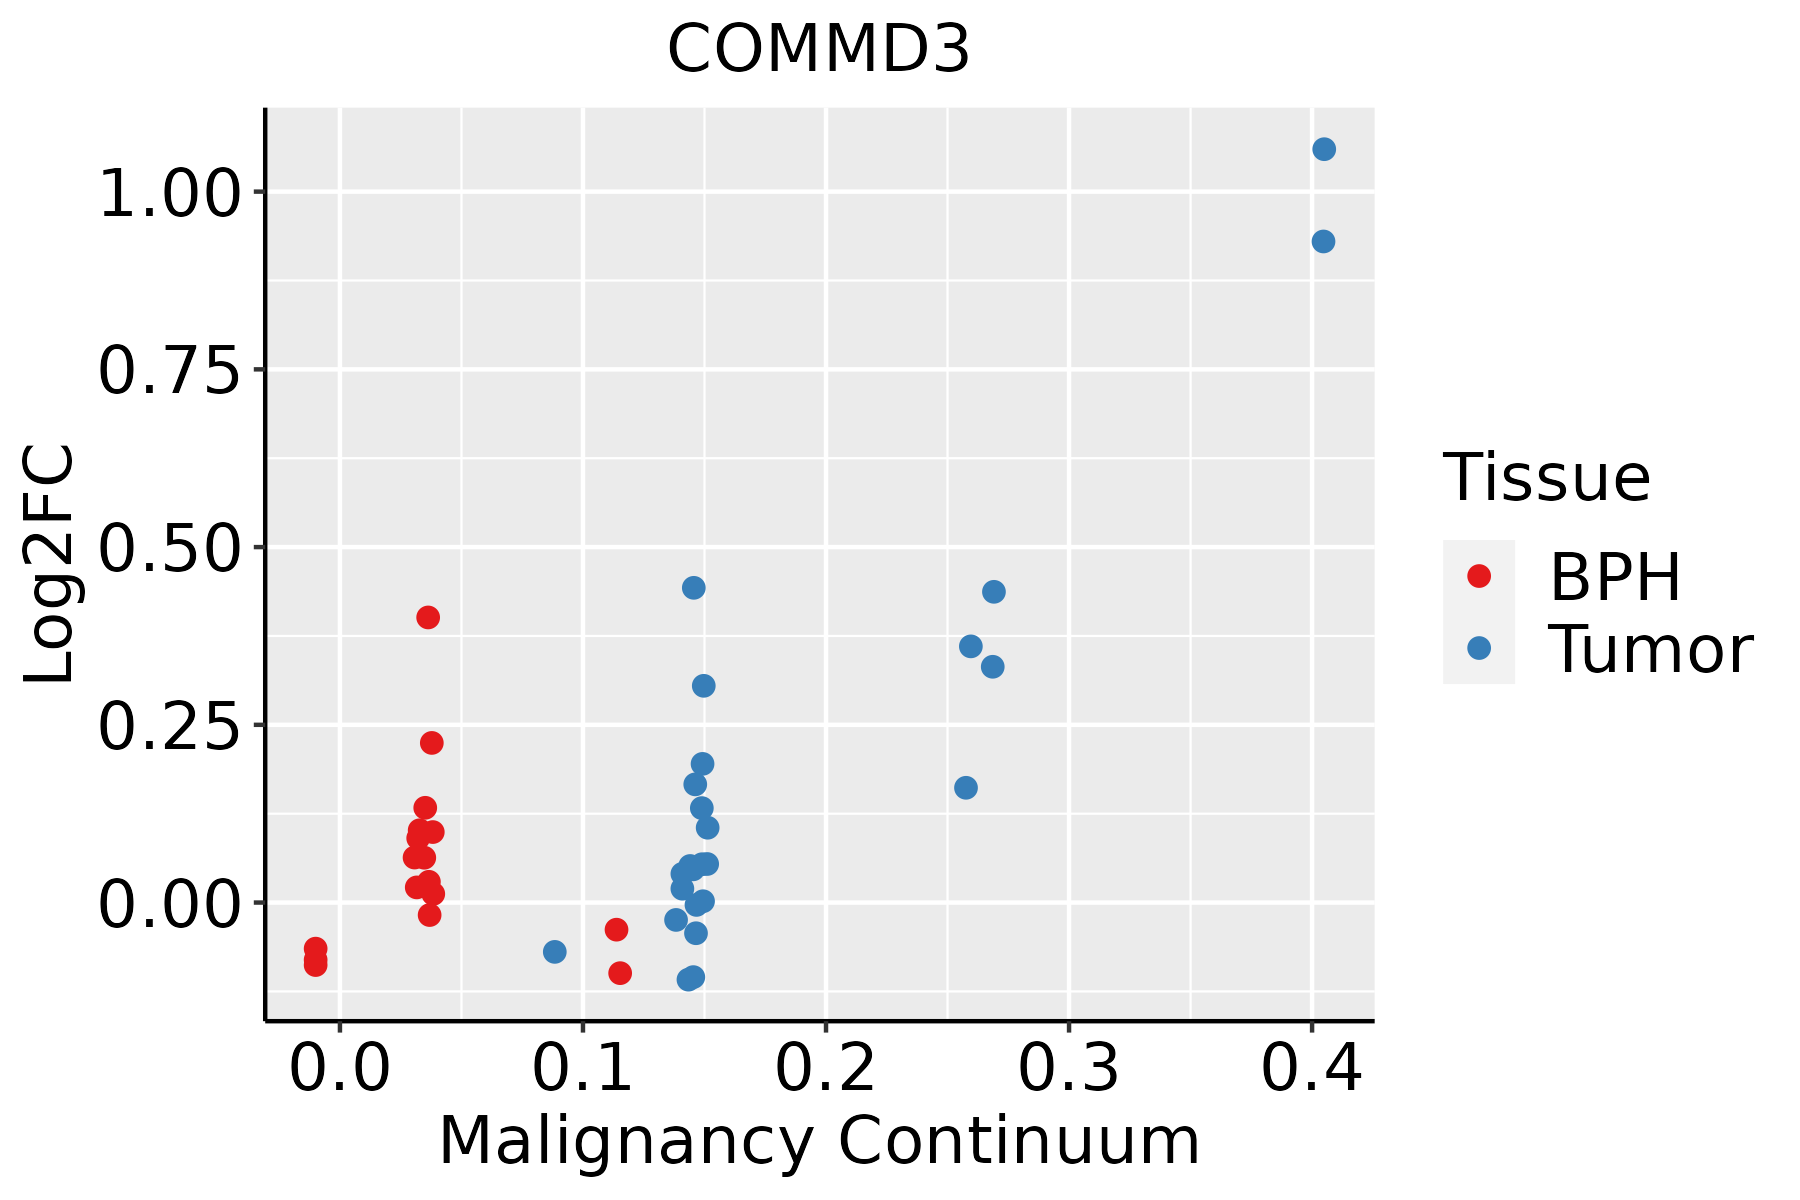 | BPH: Benign Prostatic Hyperplasia |
| Skin | 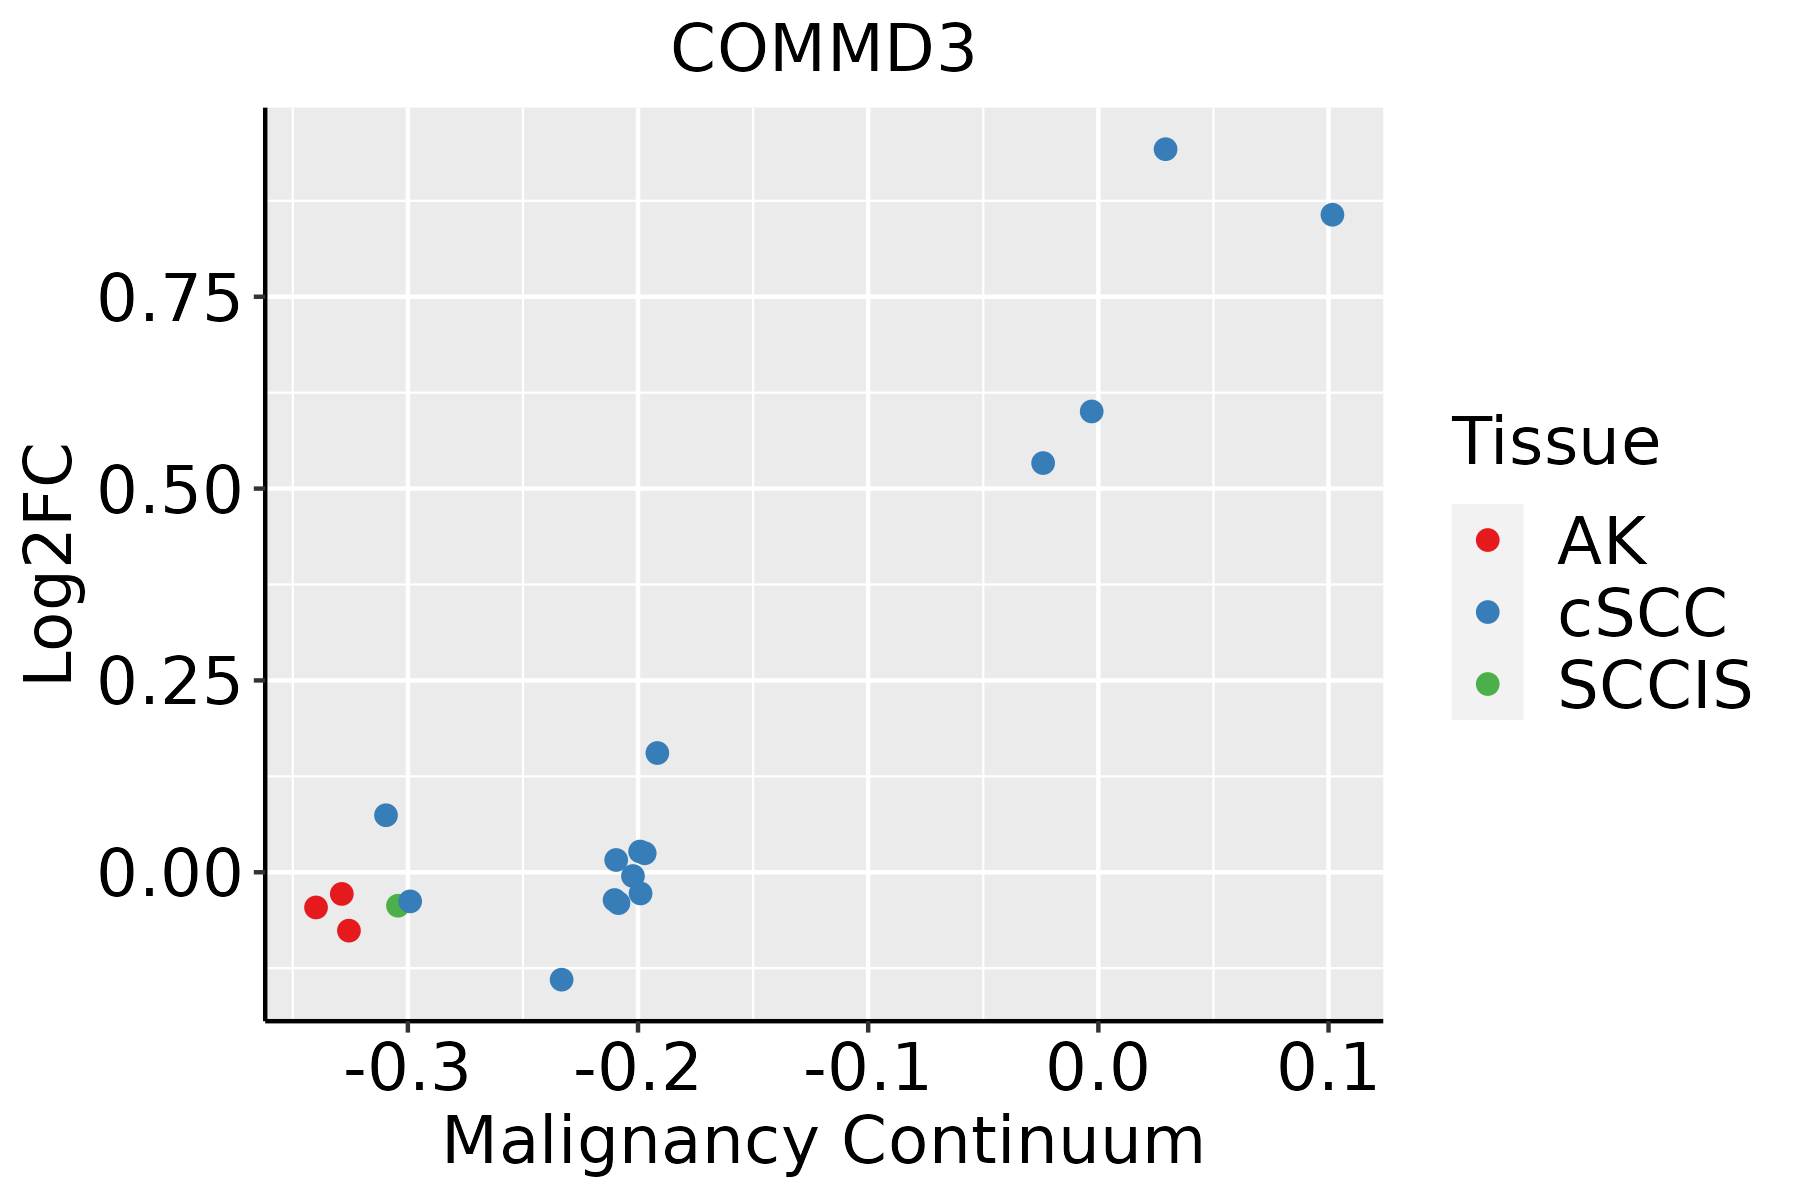 | AK: Actinic keratosis |
| cSCC: Cutaneous squamous cell carcinoma | ||
| SCCIS:squamous cell carcinoma in situ | ||
| Thyroid | 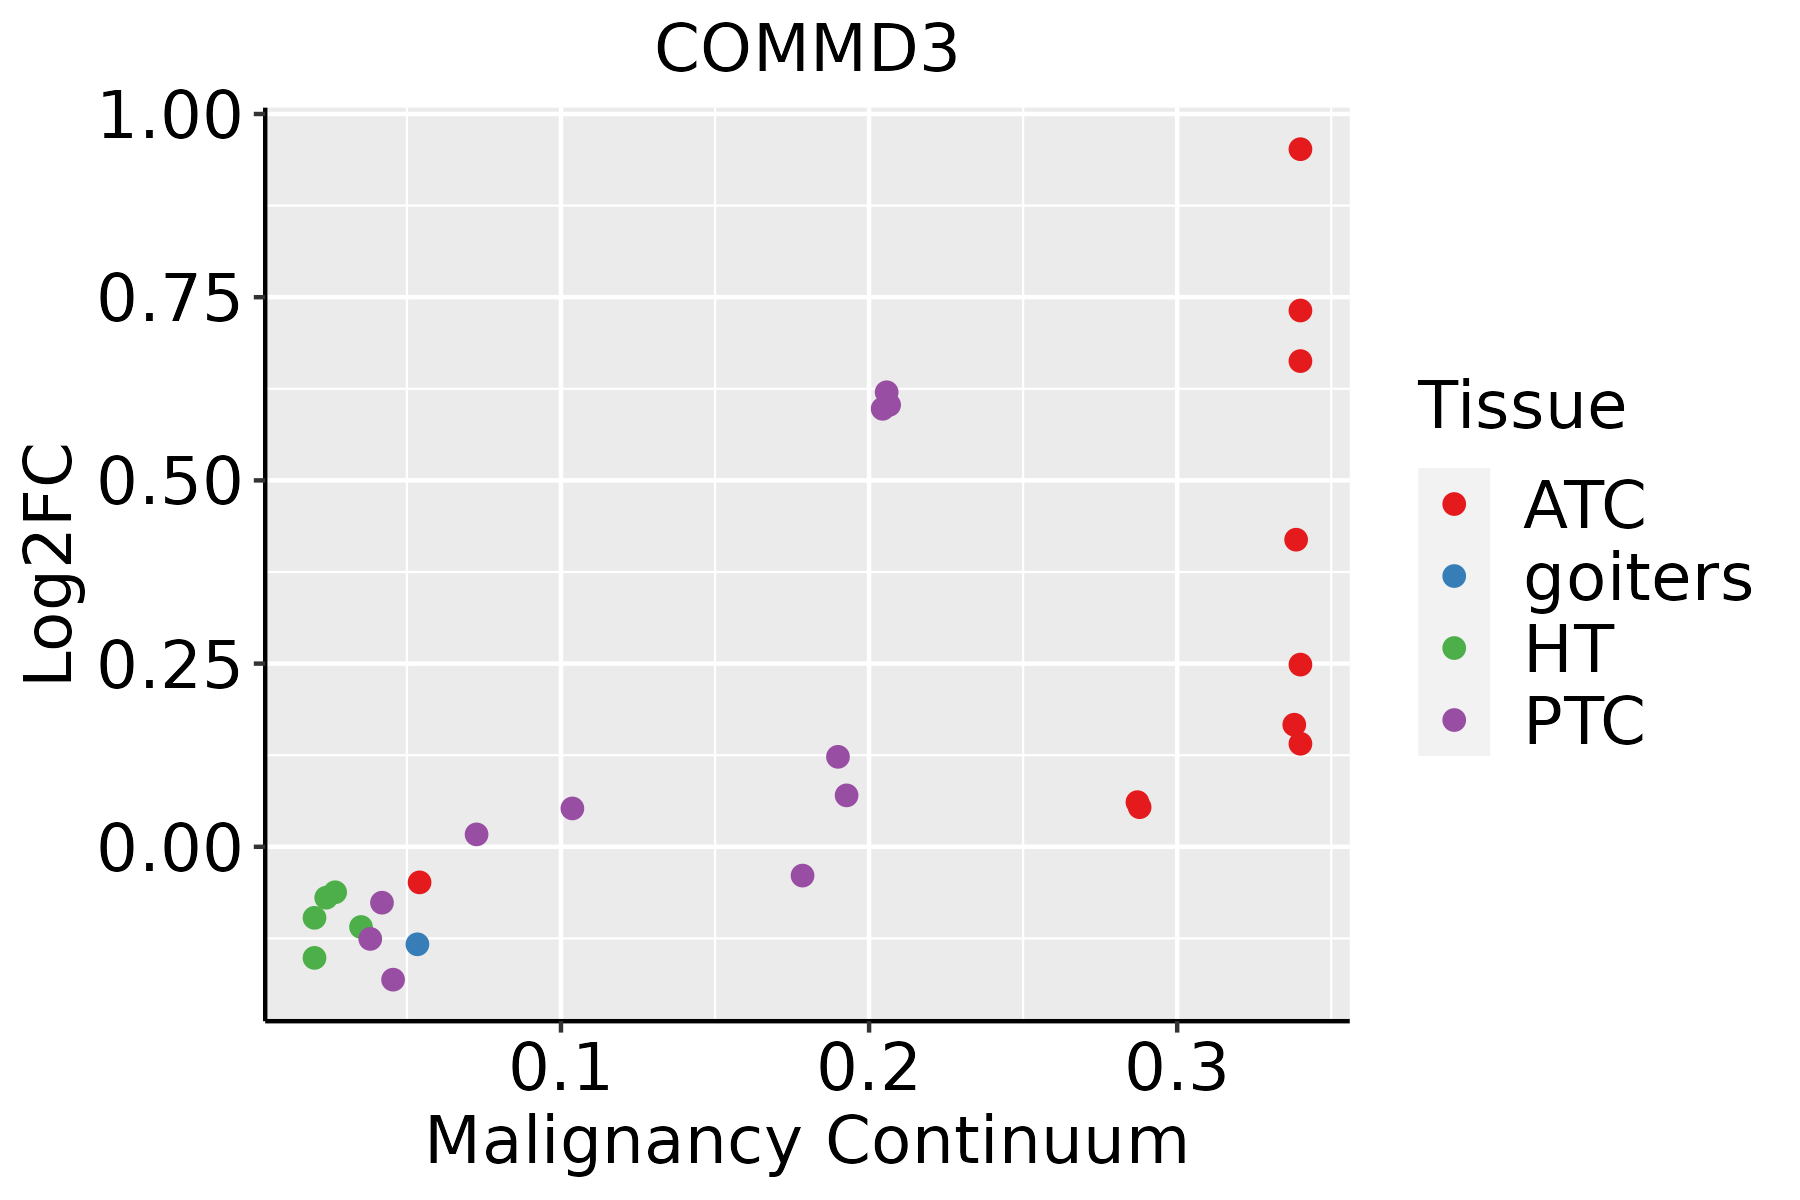 | ATC: Anaplastic thyroid cancer |
| HT: Hashimoto's thyroiditis | ||
| PTC: Papillary thyroid cancer |
| ∗log2FC in expression of this searched gene in stem-like cells from each diseased tissue sample relative to stem-like cells in normal samples in each tissue plotted against the malignancy continuum. Samples are colored based on if they are from different disease stage. |
Top |
Malignant transformation related pathway analysis |
| Find out the enriched GO biological processes and KEGG pathways involved in transition from healthy to precancer to cancer |
| Tissue | Disease Stage | Enriched GO biological Processes |
| Colorectum | AD |  |
| Colorectum | SER |  |
| Colorectum | MSS |  |
| Colorectum | MSI-H |  |
| Colorectum | FAP |  |
| ∗Top 15 enriched GO BP terms are showed in the bar plot of each disease state in each tissue. Each row represents a significant GO biological process which is colored according to the -log10(p.adjust). |
| Page: 1 2 3 4 5 6 7 8 9 |
| GO ID | Tissue | Disease Stage | Description | Gene Ratio | Bg Ratio | pvalue | p.adjust | Count |
| Page: 1 |
| Pathway ID | Tissue | Disease Stage | Description | Gene Ratio | Bg Ratio | pvalue | p.adjust | qvalue | Count |
| Page: 1 |
Top |
Cell-cell communication analysis |
| Identification of potential cell-cell interactions between two cell types and their ligand-receptor pairs for different disease states |
| Ligand | Receptor | LRpair | Pathway | Tissue | Disease Stage |
| Page: 1 |
Top |
Single-cell gene regulatory network inference analysis |
| Find out the significant the regulons (TFs) and the target genes of each regulon across cell types for different disease states |
| TF | Cell Type | Tissue | Disease Stage | Target Gene | RSS | Regulon Activity |
| ∗The dot plots of a searched regulon are shown for all cell subpopulations in each disease state of each tissue based on the regulon specific score inferred using pySCENIC and by calculating the average expression. |
| Page: 1 |
Top |
Somatic mutation of malignant transformation related genes |
| Annotation of somatic variants for genes involved in malignant transformation |
| Hugo Symbol | Variant Class | Variant Classification | dbSNP RS | HGVSc | HGVSp | HGVSp Short | SWISSPROT | BIOTYPE | SIFT | PolyPhen | Tumor Sample Barcode | Tissue | Histology | Sex | Age | Stage | Therapy Types | Drugs | Outcome |
| COMMD3 | SNV | Missense_Mutation | novel | c.557N>T | p.Ser186Leu | p.S186L | Q9UBI1 | protein_coding | deleterious(0.01) | benign(0.14) | TCGA-AN-A046-01 | Breast | breast invasive carcinoma | Female | >=65 | I/II | Unknown | Unknown | SD |
| COMMD3 | SNV | Missense_Mutation | rs143840494 | c.391C>T | p.Arg131Cys | p.R131C | Q9UBI1 | protein_coding | deleterious(0.05) | benign(0.007) | TCGA-2W-A8YY-01 | Cervix | cervical & endocervical cancer | Female | <65 | I/II | Chemotherapy | cisplatin | CR |
| COMMD3 | deletion | Frame_Shift_Del | c.298delN | p.Cys101AlafsTer11 | p.C101Afs*11 | Q9UBI1 | protein_coding | TCGA-NH-A5IV-01 | Colorectum | colon adenocarcinoma | Female | >=65 | I/II | Unknown | Unknown | SD | |||
| COMMD3 | SNV | Missense_Mutation | novel | c.479N>T | p.Ser160Phe | p.S160F | Q9UBI1 | protein_coding | deleterious(0.01) | possibly_damaging(0.58) | TCGA-A5-A0G2-01 | Endometrium | uterine corpus endometrioid carcinoma | Female | <65 | III/IV | Unknown | Unknown | SD |
| COMMD3 | SNV | Missense_Mutation | novel | c.131N>T | p.Ala44Val | p.A44V | Q9UBI1 | protein_coding | tolerated(0.05) | benign(0.305) | TCGA-A5-A1OF-01 | Endometrium | uterine corpus endometrioid carcinoma | Female | <65 | I/II | Unknown | Unknown | SD |
| COMMD3 | SNV | Missense_Mutation | rs143840494 | c.391C>T | p.Arg131Cys | p.R131C | Q9UBI1 | protein_coding | deleterious(0.05) | benign(0.007) | TCGA-AP-A1DV-01 | Endometrium | uterine corpus endometrioid carcinoma | Female | <65 | I/II | Unknown | Unknown | SD |
| COMMD3 | SNV | Missense_Mutation | c.498N>G | p.Ile166Met | p.I166M | Q9UBI1 | protein_coding | deleterious(0) | benign(0.347) | TCGA-AX-A0J0-01 | Endometrium | uterine corpus endometrioid carcinoma | Female | <65 | I/II | Unknown | Unknown | SD | |
| COMMD3 | SNV | Missense_Mutation | novel | c.379G>A | p.Asp127Asn | p.D127N | Q9UBI1 | protein_coding | deleterious(0) | probably_damaging(1) | TCGA-B5-A1MX-01 | Endometrium | uterine corpus endometrioid carcinoma | Female | <65 | I/II | Hormone Therapy | megace | SD |
| COMMD3 | SNV | Missense_Mutation | novel | c.326N>G | p.Asn109Ser | p.N109S | Q9UBI1 | protein_coding | tolerated(0.78) | benign(0.138) | TCGA-EO-A22U-01 | Endometrium | uterine corpus endometrioid carcinoma | Female | >=65 | I/II | Unknown | Unknown | SD |
| COMMD3 | SNV | Missense_Mutation | c.182N>G | p.His61Arg | p.H61R | Q9UBI1 | protein_coding | tolerated(0.12) | benign(0.417) | TCGA-DD-A39V-01 | Liver | liver hepatocellular carcinoma | Male | >=65 | I/II | Unknown | Unknown | PD |
| Page: 1 2 |
Top |
Related drugs of malignant transformation related genes |
| Identification of chemicals and drugs interact with genes involved in malignant transfromation |
| (DGIdb 4.0) |
| Entrez ID | Symbol | Category | Interaction Types | Drug Claim Name | Drug Name | PMIDs |
| Page: 1 |

Copyright 2023-Present -The University of Texas Health Science Center at Houston |