
|
|||||
|
 | |
| |
| |
| |
| |
| |
|
Gene: CNTNAP2 |
Gene summary for CNTNAP2 |
| Gene information | Species | Human | Gene symbol | CNTNAP2 | Gene ID | 26047 |
| Gene name | contactin associated protein 2 | |
| Gene Alias | AUTS15 | |
| Cytomap | 7q35-q36.1 | |
| Gene Type | protein-coding | GO ID | GO:0000902 | UniProtAcc | A0A090N7T7 |
Top |
Malignant transformation analysis |
| Identification of the aberrant gene expression in precancerous and cancerous lesions by comparing the gene expression of stem-like cells in diseased tissues with normal stem cells |
| Entrez ID | Symbol | Replicates | Species | Organ | Tissue | Adj P-value | Log2FC | Malignancy |
| 26047 | CNTNAP2 | P9T-E | Human | Esophagus | ESCC | 3.05e-03 | 2.34e-01 | 0.1131 |
| 26047 | CNTNAP2 | P10T-E | Human | Esophagus | ESCC | 5.68e-24 | 5.25e-01 | 0.116 |
| 26047 | CNTNAP2 | P12T-E | Human | Esophagus | ESCC | 1.77e-86 | 1.85e+00 | 0.1122 |
| 26047 | CNTNAP2 | P15T-E | Human | Esophagus | ESCC | 8.38e-13 | 4.90e-01 | 0.1149 |
| 26047 | CNTNAP2 | P26T-E | Human | Esophagus | ESCC | 2.06e-59 | 1.19e+00 | 0.1276 |
| 26047 | CNTNAP2 | P28T-E | Human | Esophagus | ESCC | 1.30e-15 | 5.05e-01 | 0.1149 |
| 26047 | CNTNAP2 | P30T-E | Human | Esophagus | ESCC | 3.85e-06 | 3.06e-01 | 0.137 |
| 26047 | CNTNAP2 | P32T-E | Human | Esophagus | ESCC | 6.36e-33 | 1.01e+00 | 0.1666 |
| 26047 | CNTNAP2 | P36T-E | Human | Esophagus | ESCC | 1.12e-05 | 2.27e-01 | 0.1187 |
| 26047 | CNTNAP2 | P42T-E | Human | Esophagus | ESCC | 9.46e-03 | 1.43e-01 | 0.1175 |
| 26047 | CNTNAP2 | P49T-E | Human | Esophagus | ESCC | 1.13e-17 | 2.03e+00 | 0.1768 |
| 26047 | CNTNAP2 | P52T-E | Human | Esophagus | ESCC | 9.02e-11 | 2.95e-01 | 0.1555 |
| 26047 | CNTNAP2 | P74T-E | Human | Esophagus | ESCC | 2.69e-06 | 2.19e-01 | 0.1479 |
| 26047 | CNTNAP2 | P79T-E | Human | Esophagus | ESCC | 1.78e-03 | 1.74e-01 | 0.1154 |
| 26047 | CNTNAP2 | P83T-E | Human | Esophagus | ESCC | 1.82e-04 | 1.95e-01 | 0.1738 |
| 26047 | CNTNAP2 | P107T-E | Human | Esophagus | ESCC | 8.98e-03 | 1.46e-01 | 0.171 |
| 26047 | CNTNAP2 | P130T-E | Human | Esophagus | ESCC | 2.39e-24 | 5.71e-01 | 0.1676 |
| 26047 | CNTNAP2 | HCC1 | Human | Liver | HCC | 1.22e-06 | 2.88e+00 | 0.5336 |
| 26047 | CNTNAP2 | S014 | Human | Liver | HCC | 1.69e-09 | 4.08e-01 | 0.2254 |
| 26047 | CNTNAP2 | S027 | Human | Liver | HCC | 1.20e-12 | 7.89e-01 | 0.2446 |
| Page: 1 2 3 |
| Tissue | Expression Dynamics | Abbreviation |
| Breast | 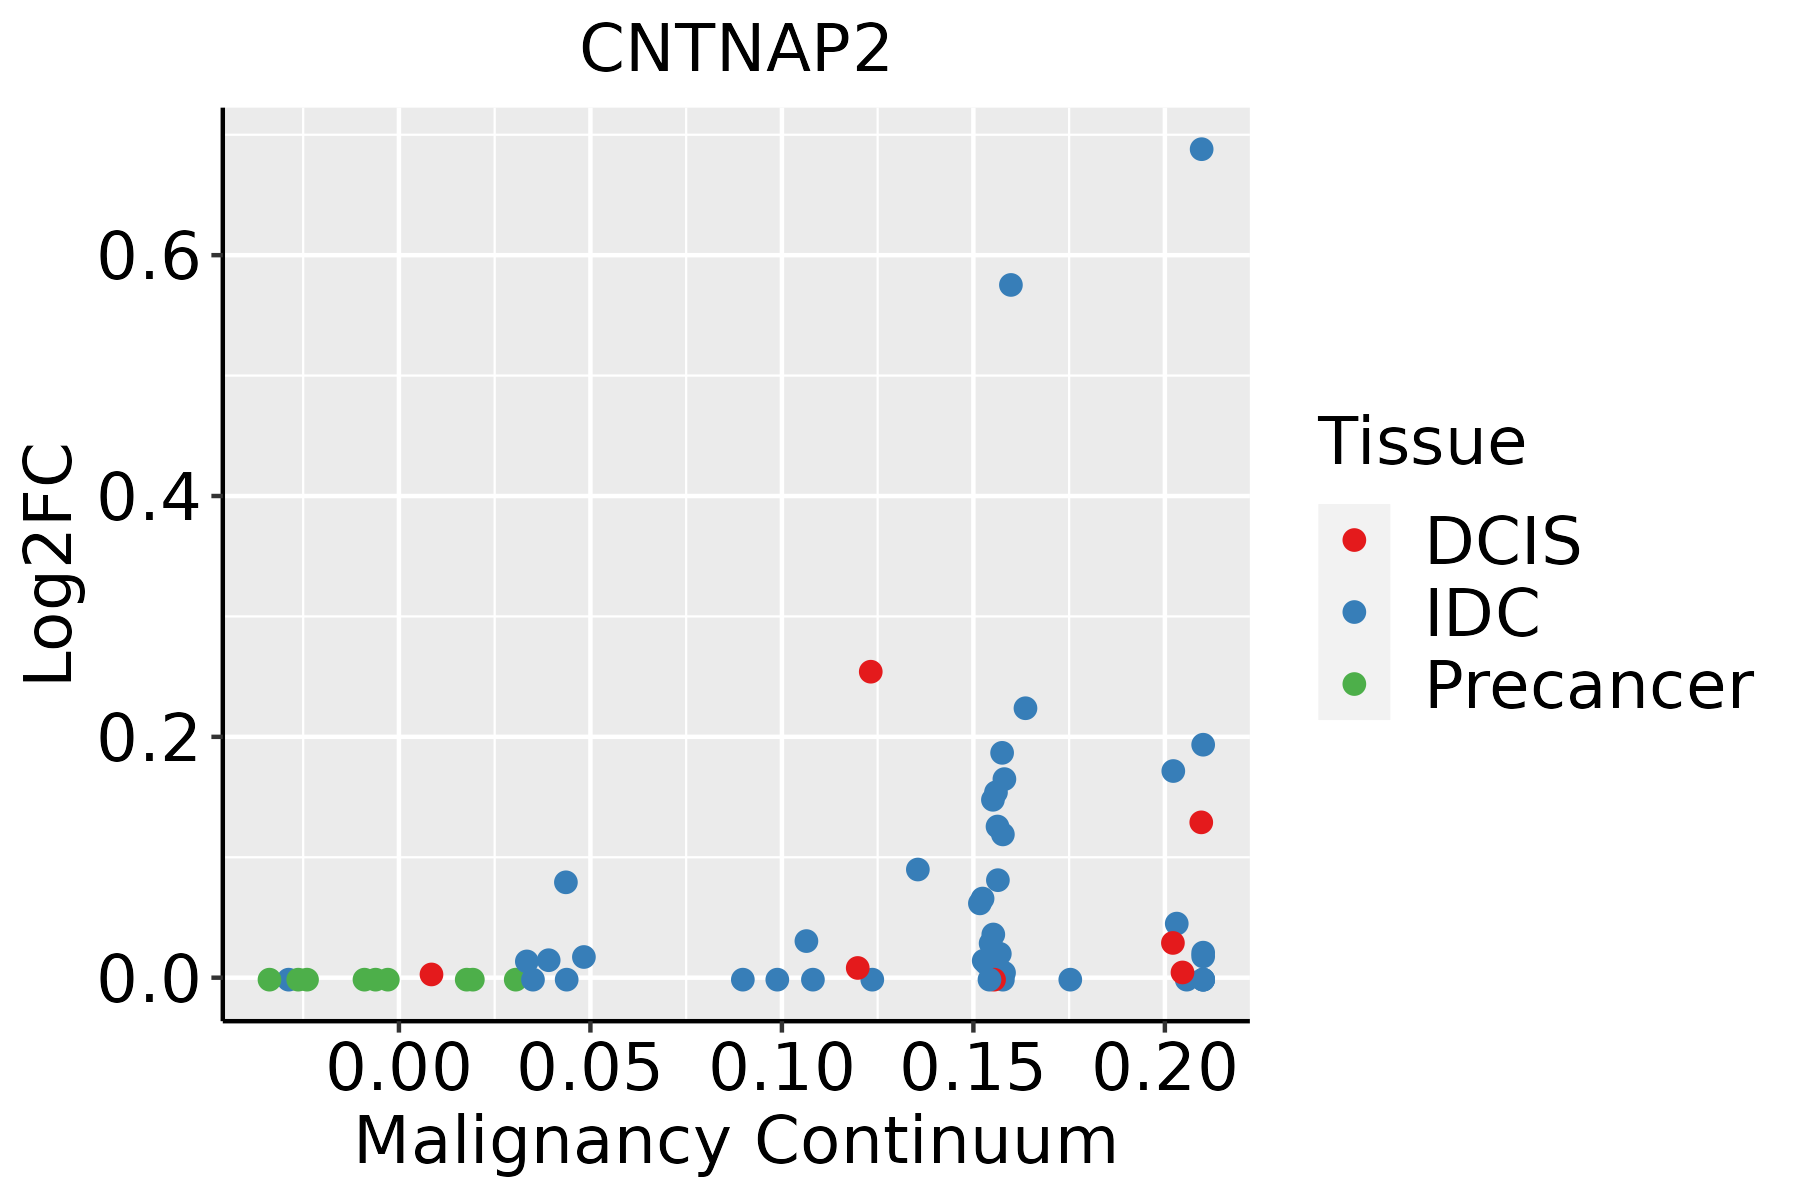 | IDC: Invasive ductal carcinoma |
| DCIS: Ductal carcinoma in situ | ||
| Precancer(BRCA1-mut): Precancerous lesion from BRCA1 mutation carriers | ||
| Colorectum (GSE201348) |  | FAP: Familial adenomatous polyposis |
| CRC: Colorectal cancer | ||
| Colorectum (HTA11) |  | AD: Adenomas |
| SER: Sessile serrated lesions | ||
| MSI-H: Microsatellite-high colorectal cancer | ||
| MSS: Microsatellite stable colorectal cancer | ||
| Esophagus |  | ESCC: Esophageal squamous cell carcinoma |
| HGIN: High-grade intraepithelial neoplasias | ||
| LGIN: Low-grade intraepithelial neoplasias | ||
| Liver | 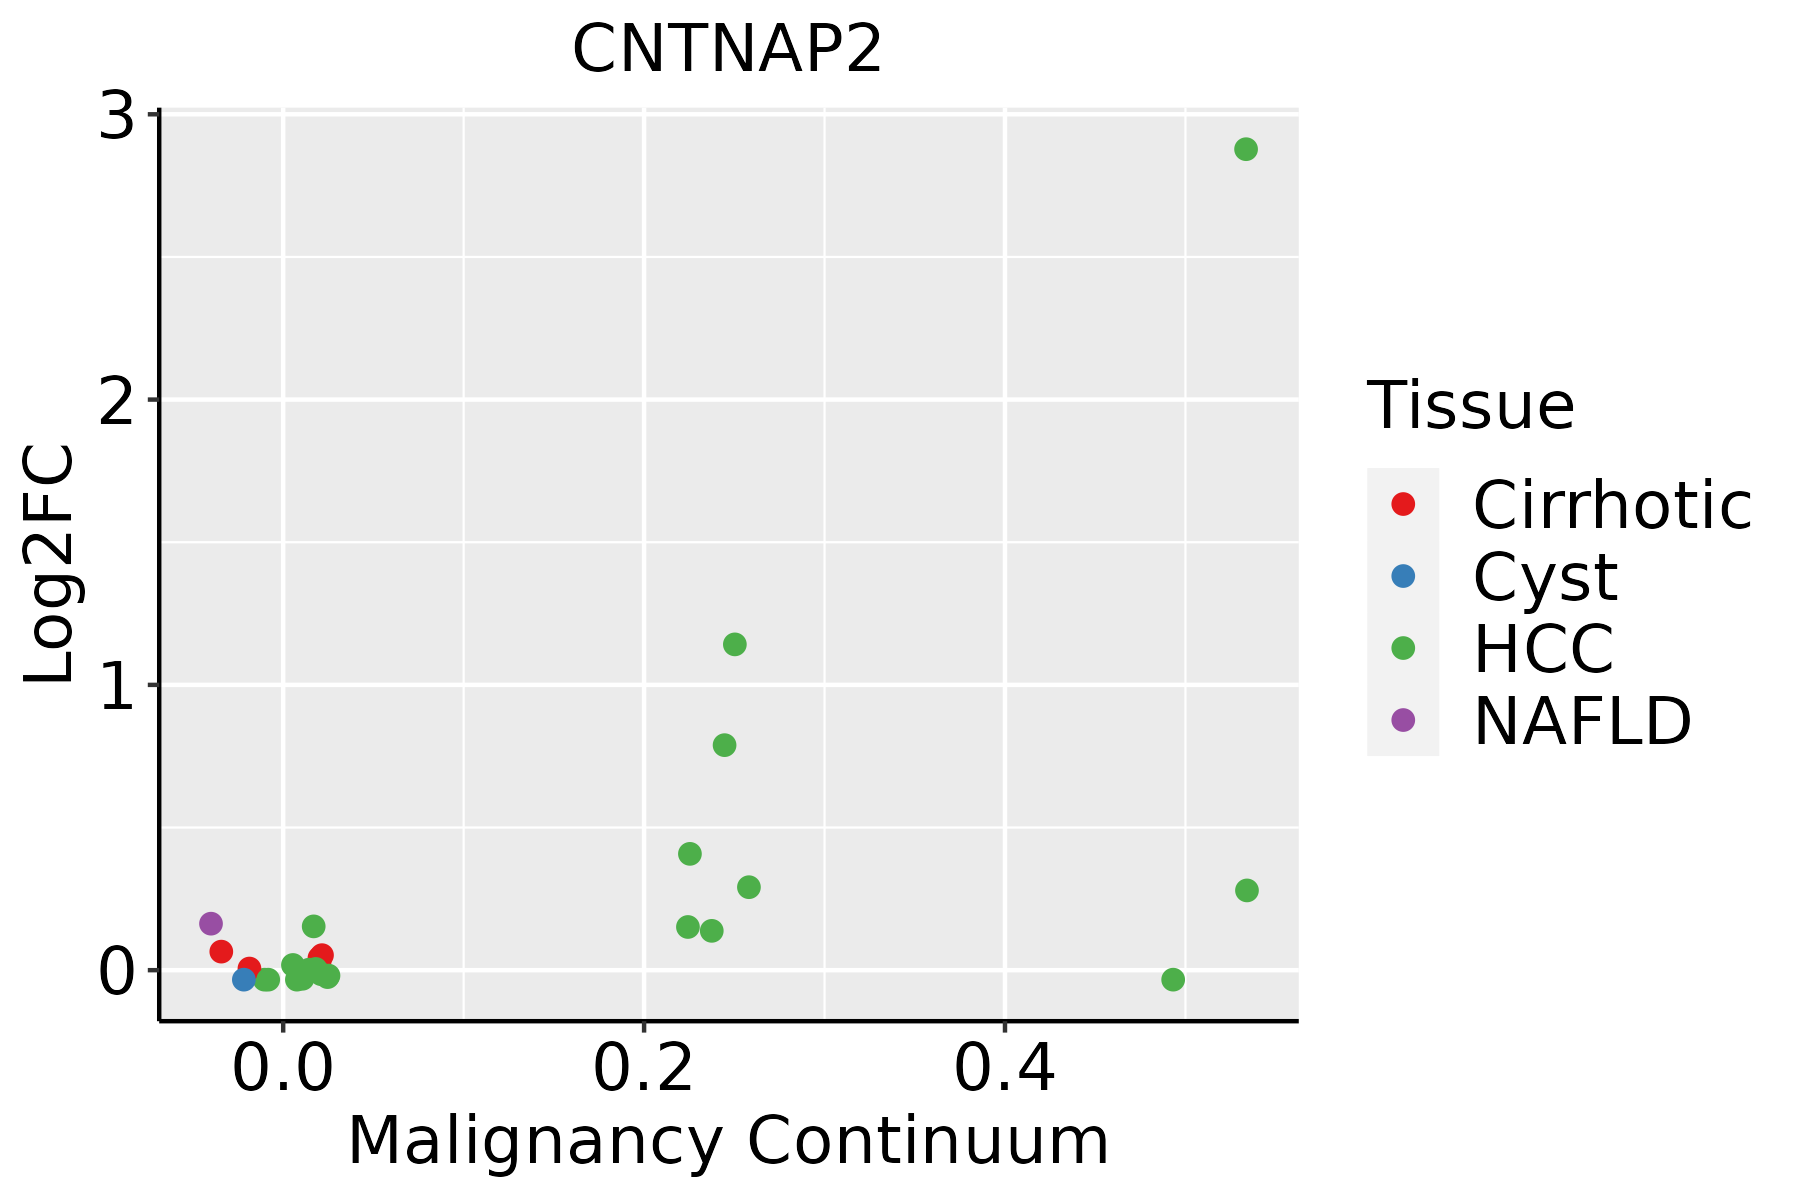 | HCC: Hepatocellular carcinoma |
| NAFLD: Non-alcoholic fatty liver disease |
| ∗log2FC in expression of this searched gene in stem-like cells from each diseased tissue sample relative to stem-like cells in normal samples in each tissue plotted against the malignancy continuum. Samples are colored based on if they are from different disease stage. |
Top |
Malignant transformation related pathway analysis |
| Find out the enriched GO biological processes and KEGG pathways involved in transition from healthy to precancer to cancer |
| Tissue | Disease Stage | Enriched GO biological Processes |
| Colorectum | AD |  |
| Colorectum | SER |  |
| Colorectum | MSS |  |
| Colorectum | MSI-H |  |
| Colorectum | FAP |  |
| ∗Top 15 enriched GO BP terms are showed in the bar plot of each disease state in each tissue. Each row represents a significant GO biological process which is colored according to the -log10(p.adjust). |
| Page: 1 2 3 4 5 6 7 8 9 |
| GO ID | Tissue | Disease Stage | Description | Gene Ratio | Bg Ratio | pvalue | p.adjust | Count |
| GO:000961211 | Breast | IDC | response to mechanical stimulus | 34/1434 | 216/18723 | 4.59e-05 | 1.03e-03 | 34 |
| GO:000961221 | Breast | DCIS | response to mechanical stimulus | 32/1390 | 216/18723 | 1.36e-04 | 2.33e-03 | 32 |
| GO:0045216 | Colorectum | AD | cell-cell junction organization | 80/3918 | 200/18723 | 5.57e-10 | 4.58e-08 | 80 |
| GO:0034329 | Colorectum | AD | cell junction assembly | 136/3918 | 420/18723 | 2.02e-08 | 1.15e-06 | 136 |
| GO:0007043 | Colorectum | AD | cell-cell junction assembly | 57/3918 | 146/18723 | 4.18e-07 | 1.61e-05 | 57 |
| GO:1901888 | Colorectum | AD | regulation of cell junction assembly | 61/3918 | 204/18723 | 1.50e-03 | 1.27e-02 | 61 |
| GO:00452161 | Colorectum | SER | cell-cell junction organization | 63/2897 | 200/18723 | 9.15e-09 | 7.80e-07 | 63 |
| GO:00070431 | Colorectum | SER | cell-cell junction assembly | 45/2897 | 146/18723 | 2.23e-06 | 9.31e-05 | 45 |
| GO:00343291 | Colorectum | SER | cell junction assembly | 100/2897 | 420/18723 | 4.23e-06 | 1.61e-04 | 100 |
| GO:19018881 | Colorectum | SER | regulation of cell junction assembly | 46/2897 | 204/18723 | 4.70e-03 | 3.70e-02 | 46 |
| GO:00452162 | Colorectum | MSS | cell-cell junction organization | 69/3467 | 200/18723 | 5.07e-08 | 2.70e-06 | 69 |
| GO:00343292 | Colorectum | MSS | cell junction assembly | 120/3467 | 420/18723 | 2.51e-07 | 1.07e-05 | 120 |
| GO:00070432 | Colorectum | MSS | cell-cell junction assembly | 50/3467 | 146/18723 | 4.24e-06 | 1.21e-04 | 50 |
| GO:003432918 | Esophagus | ESCC | cell junction assembly | 227/8552 | 420/18723 | 3.06e-04 | 1.83e-03 | 227 |
| GO:000961216 | Esophagus | ESCC | response to mechanical stimulus | 124/8552 | 216/18723 | 3.30e-04 | 1.94e-03 | 124 |
| GO:004521620 | Esophagus | ESCC | cell-cell junction organization | 114/8552 | 200/18723 | 8.04e-04 | 4.16e-03 | 114 |
| GO:00215436 | Esophagus | ESCC | pallium development | 94/8552 | 169/18723 | 5.79e-03 | 2.14e-02 | 94 |
| GO:190188810 | Esophagus | ESCC | regulation of cell junction assembly | 109/8552 | 204/18723 | 1.53e-02 | 4.96e-02 | 109 |
| GO:004521622 | Liver | HCC | cell-cell junction organization | 107/7958 | 200/18723 | 1.06e-03 | 6.11e-03 | 107 |
| GO:00096124 | Liver | HCC | response to mechanical stimulus | 113/7958 | 216/18723 | 2.20e-03 | 1.10e-02 | 113 |
| Page: 1 2 |
| Pathway ID | Tissue | Disease Stage | Description | Gene Ratio | Bg Ratio | pvalue | p.adjust | qvalue | Count |
| Page: 1 |
Top |
Cell-cell communication analysis |
| Identification of potential cell-cell interactions between two cell types and their ligand-receptor pairs for different disease states |
| Ligand | Receptor | LRpair | Pathway | Tissue | Disease Stage |
| Page: 1 |
Top |
Single-cell gene regulatory network inference analysis |
| Find out the significant the regulons (TFs) and the target genes of each regulon across cell types for different disease states |
| TF | Cell Type | Tissue | Disease Stage | Target Gene | RSS | Regulon Activity |
| ∗The dot plots of a searched regulon are shown for all cell subpopulations in each disease state of each tissue based on the regulon specific score inferred using pySCENIC and by calculating the average expression. |
| Page: 1 |
Top |
Somatic mutation of malignant transformation related genes |
| Annotation of somatic variants for genes involved in malignant transformation |
| Hugo Symbol | Variant Class | Variant Classification | dbSNP RS | HGVSc | HGVSp | HGVSp Short | SWISSPROT | BIOTYPE | SIFT | PolyPhen | Tumor Sample Barcode | Tissue | Histology | Sex | Age | Stage | Therapy Types | Drugs | Outcome |
| CNTNAP2 | SNV | Missense_Mutation | rs750079255 | c.615N>A | p.Met205Ile | p.M205I | Q9UHC6 | protein_coding | tolerated(0.16) | benign(0.01) | TCGA-AC-A23H-01 | Breast | breast invasive carcinoma | Female | >=65 | I/II | Unknown | Unknown | PD |
| CNTNAP2 | SNV | Missense_Mutation | c.2068N>C | p.Cys690Arg | p.C690R | Q9UHC6 | protein_coding | deleterious(0) | probably_damaging(1) | TCGA-AN-A0AK-01 | Breast | breast invasive carcinoma | Female | >=65 | I/II | Unknown | Unknown | SD | |
| CNTNAP2 | SNV | Missense_Mutation | rs763809167 | c.3850N>T | p.Arg1284Trp | p.R1284W | Q9UHC6 | protein_coding | deleterious(0) | probably_damaging(0.987) | TCGA-AO-A0J4-01 | Breast | breast invasive carcinoma | Female | <65 | I/II | Chemotherapy | doxorubicin | SD |
| CNTNAP2 | SNV | Missense_Mutation | rs764902194 | c.1681A>C | p.Asn561His | p.N561H | Q9UHC6 | protein_coding | deleterious(0) | probably_damaging(0.999) | TCGA-BH-A1FJ-01 | Breast | breast invasive carcinoma | Female | >=65 | III/IV | Unknown | Unknown | SD |
| CNTNAP2 | SNV | Missense_Mutation | rs756029588 | c.2318N>C | p.Gly773Ala | p.G773A | Q9UHC6 | protein_coding | tolerated(0.66) | possibly_damaging(0.642) | TCGA-D8-A147-01 | Breast | breast invasive carcinoma | Female | <65 | I/II | Chemotherapy | doxorubicine | SD |
| CNTNAP2 | SNV | Missense_Mutation | c.1849N>A | p.Asp617Asn | p.D617N | Q9UHC6 | protein_coding | deleterious(0) | probably_damaging(0.999) | TCGA-D8-A27G-01 | Breast | breast invasive carcinoma | Female | >=65 | I/II | Unknown | Unknown | SD | |
| CNTNAP2 | SNV | Missense_Mutation | novel | c.3245C>A | p.Thr1082Asn | p.T1082N | Q9UHC6 | protein_coding | tolerated(1) | benign(0) | TCGA-E2-A573-01 | Breast | breast invasive carcinoma | Female | <65 | I/II | Chemotherapy | taxotere | CR |
| CNTNAP2 | SNV | Missense_Mutation | rs145832489 | c.1033N>A | p.Val345Ile | p.V345I | Q9UHC6 | protein_coding | tolerated(0.34) | benign(0.003) | TCGA-E9-A248-01 | Breast | breast invasive carcinoma | Female | <65 | I/II | Chemotherapy | cyclophosphamide | SD |
| CNTNAP2 | SNV | Missense_Mutation | rs768389541 | c.3631G>A | p.Glu1211Lys | p.E1211K | Q9UHC6 | protein_coding | deleterious(0.02) | possibly_damaging(0.787) | TCGA-EW-A1J5-01 | Breast | breast invasive carcinoma | Female | <65 | I/II | Chemotherapy | adriamycin | SD |
| CNTNAP2 | deletion | Frame_Shift_Del | c.3515delN | p.Pro1173GlnfsTer22 | p.P1173Qfs*22 | Q9UHC6 | protein_coding | TCGA-D8-A27V-01 | Breast | breast invasive carcinoma | Female | <65 | I/II | Hormone Therapy | tamoxiphen | SD |
| Page: 1 2 3 4 5 6 7 8 9 10 11 12 13 14 15 16 17 18 19 20 21 22 23 24 25 26 27 28 29 30 31 32 33 34 35 36 37 |
Top |
Related drugs of malignant transformation related genes |
| Identification of chemicals and drugs interact with genes involved in malignant transfromation |
| (DGIdb 4.0) |
| Entrez ID | Symbol | Category | Interaction Types | Drug Claim Name | Drug Name | PMIDs |
| Page: 1 |

Copyright 2023-Present -The University of Texas Health Science Center at Houston |