
|
|||||
|
 | |
| |
| |
| |
| |
| |
|
Gene: CNTN4 |
Gene summary for CNTN4 |
| Gene information | Species | Human | Gene symbol | CNTN4 | Gene ID | 152330 |
| Gene name | contactin 4 | |
| Gene Alias | AXCAM | |
| Cytomap | 3p26.3-p26.2 | |
| Gene Type | protein-coding | GO ID | GO:0000902 | UniProtAcc | A0A024R2E5 |
Top |
Malignant transformation analysis |
| Identification of the aberrant gene expression in precancerous and cancerous lesions by comparing the gene expression of stem-like cells in diseased tissues with normal stem cells |
| Entrez ID | Symbol | Replicates | Species | Organ | Tissue | Adj P-value | Log2FC | Malignancy |
| 152330 | CNTN4 | HTA11_6818_2000001011 | Human | Colorectum | AD | 3.36e-10 | -9.45e-01 | 0.0112 |
| 152330 | CNTN4 | HTA11_11156_2000001011 | Human | Colorectum | AD | 1.68e-03 | -1.06e+00 | 0.0397 |
| 152330 | CNTN4 | HTA11_6818_2000001021 | Human | Colorectum | AD | 7.33e-24 | -1.19e+00 | 0.0588 |
| 152330 | CNTN4 | HTA11_99999970781_79442 | Human | Colorectum | MSS | 2.00e-61 | -1.14e+00 | 0.294 |
| 152330 | CNTN4 | HTA11_99999965104_69814 | Human | Colorectum | MSS | 2.20e-24 | -1.03e+00 | 0.281 |
| 152330 | CNTN4 | HTA11_99999971662_82457 | Human | Colorectum | MSS | 6.74e-77 | -1.27e+00 | 0.3859 |
| 152330 | CNTN4 | HTA11_99999973899_84307 | Human | Colorectum | MSS | 5.35e-23 | -1.27e+00 | 0.2585 |
| 152330 | CNTN4 | HTA11_99999974143_84620 | Human | Colorectum | MSS | 5.35e-71 | -1.26e+00 | 0.3005 |
| 152330 | CNTN4 | F007 | Human | Colorectum | FAP | 5.49e-34 | -1.25e+00 | 0.1176 |
| 152330 | CNTN4 | A002-C-010 | Human | Colorectum | FAP | 8.32e-74 | -1.22e+00 | 0.242 |
| 152330 | CNTN4 | A001-C-207 | Human | Colorectum | FAP | 7.01e-46 | -1.26e+00 | 0.1278 |
| 152330 | CNTN4 | A015-C-203 | Human | Colorectum | FAP | 3.11e-45 | -8.77e-01 | -0.1294 |
| 152330 | CNTN4 | A015-C-204 | Human | Colorectum | FAP | 3.21e-24 | -9.15e-01 | -0.0228 |
| 152330 | CNTN4 | A014-C-040 | Human | Colorectum | FAP | 5.28e-16 | -1.14e+00 | -0.1184 |
| 152330 | CNTN4 | A002-C-201 | Human | Colorectum | FAP | 1.71e-56 | -1.22e+00 | 0.0324 |
| 152330 | CNTN4 | A002-C-203 | Human | Colorectum | FAP | 3.41e-73 | -1.27e+00 | 0.2786 |
| 152330 | CNTN4 | A001-C-119 | Human | Colorectum | FAP | 1.61e-27 | -1.09e+00 | -0.1557 |
| 152330 | CNTN4 | A001-C-108 | Human | Colorectum | FAP | 1.08e-67 | -1.19e+00 | -0.0272 |
| 152330 | CNTN4 | A002-C-021 | Human | Colorectum | FAP | 6.59e-19 | -6.69e-01 | 0.1171 |
| 152330 | CNTN4 | A002-C-205 | Human | Colorectum | FAP | 1.23e-50 | -1.15e+00 | -0.1236 |
| Page: 1 2 3 4 |
| Tissue | Expression Dynamics | Abbreviation |
| Colorectum (GSE201348) |  | FAP: Familial adenomatous polyposis |
| CRC: Colorectal cancer | ||
| Colorectum (HTA11) |  | AD: Adenomas |
| SER: Sessile serrated lesions | ||
| MSI-H: Microsatellite-high colorectal cancer | ||
| MSS: Microsatellite stable colorectal cancer | ||
| Lung | 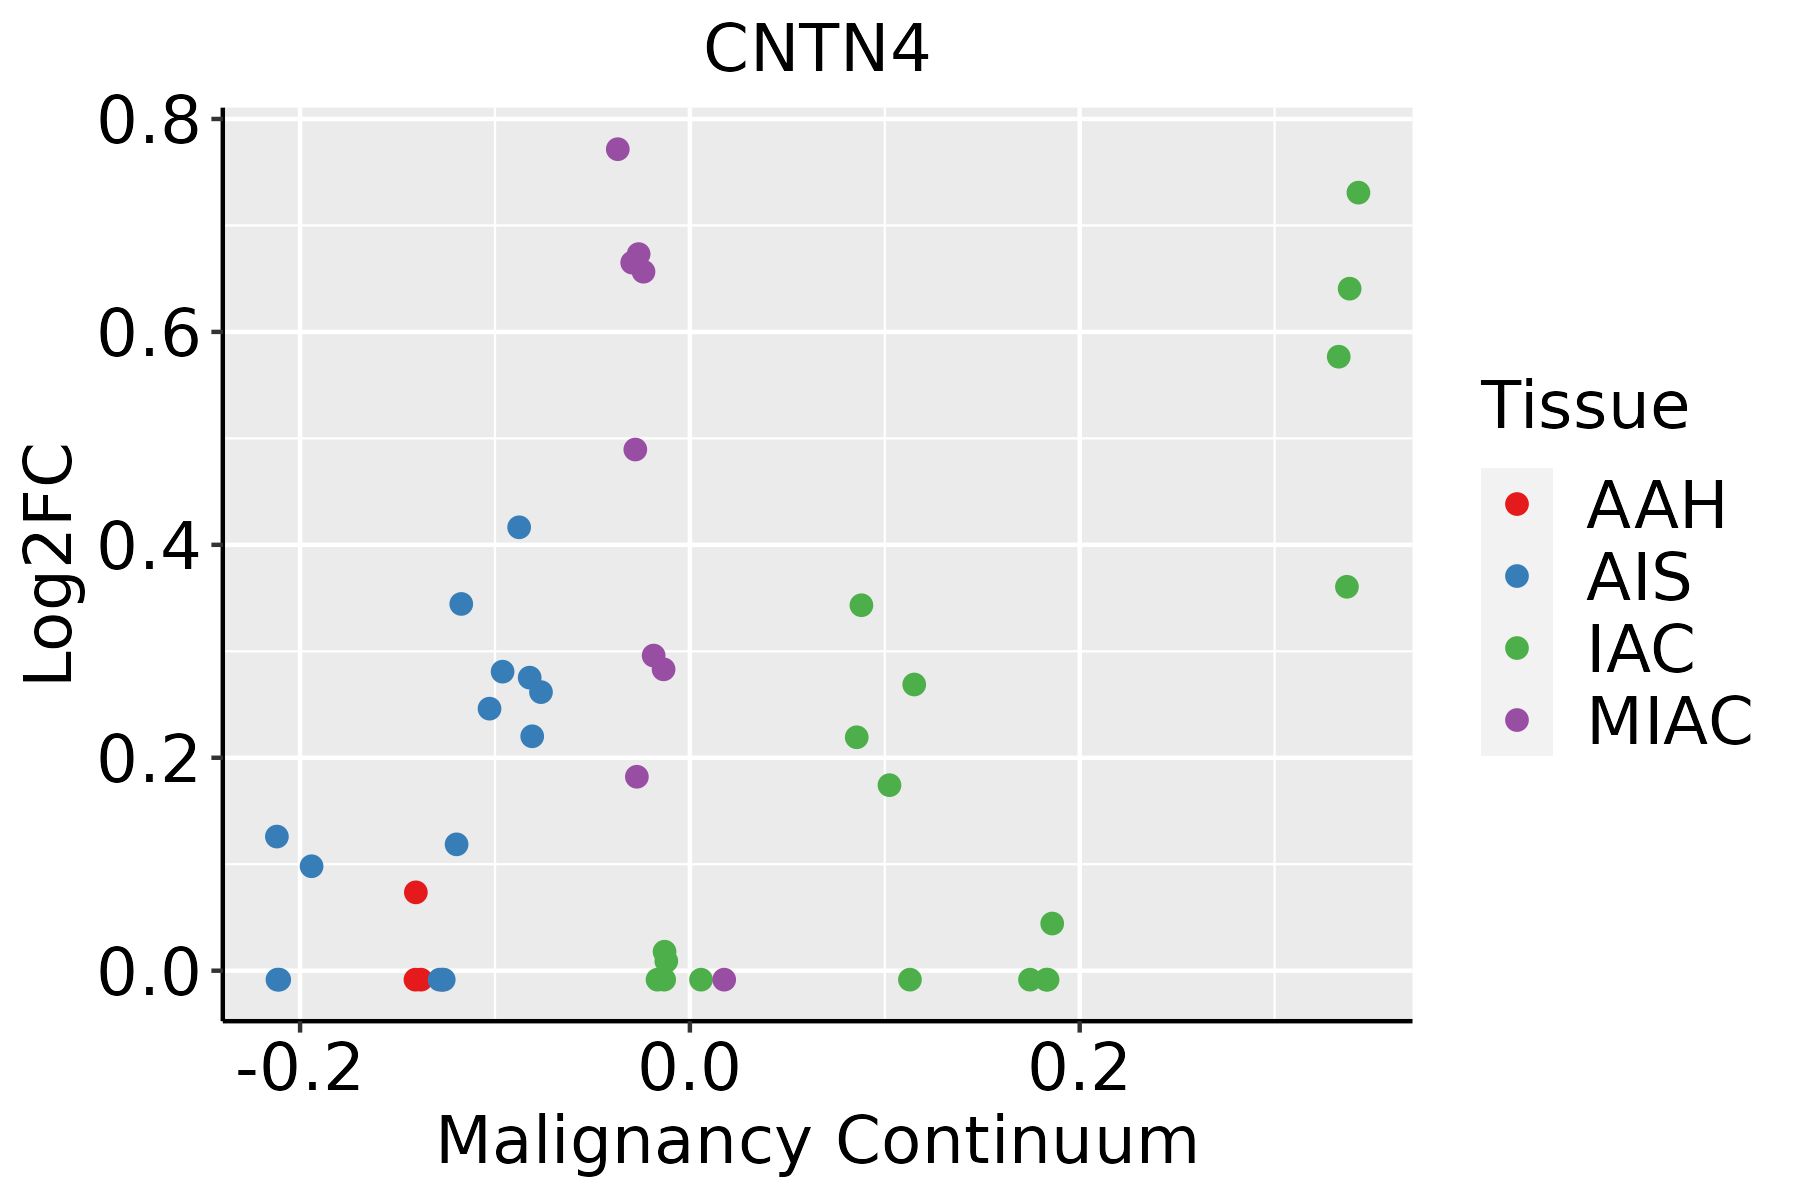 | AAH: Atypical adenomatous hyperplasia |
| AIS: Adenocarcinoma in situ | ||
| IAC: Invasive lung adenocarcinoma | ||
| MIA: Minimally invasive adenocarcinoma |
| ∗log2FC in expression of this searched gene in stem-like cells from each diseased tissue sample relative to stem-like cells in normal samples in each tissue plotted against the malignancy continuum. Samples are colored based on if they are from different disease stage. |
Top |
Malignant transformation related pathway analysis |
| Find out the enriched GO biological processes and KEGG pathways involved in transition from healthy to precancer to cancer |
| Tissue | Disease Stage | Enriched GO biological Processes |
| Colorectum | AD |  |
| Colorectum | SER |  |
| Colorectum | MSS |  |
| Colorectum | MSI-H |  |
| Colorectum | FAP |  |
| ∗Top 15 enriched GO BP terms are showed in the bar plot of each disease state in each tissue. Each row represents a significant GO biological process which is colored according to the -log10(p.adjust). |
| Page: 1 2 3 4 5 6 7 8 9 |
| GO ID | Tissue | Disease Stage | Description | Gene Ratio | Bg Ratio | pvalue | p.adjust | Count |
| GO:0007409 | Colorectum | AD | axonogenesis | 122/3918 | 418/18723 | 3.36e-05 | 6.15e-04 | 122 |
| GO:0061564 | Colorectum | AD | axon development | 132/3918 | 467/18723 | 8.40e-05 | 1.31e-03 | 132 |
| GO:0007411 | Colorectum | AD | axon guidance | 64/3918 | 227/18723 | 5.41e-03 | 3.55e-02 | 64 |
| GO:0097485 | Colorectum | AD | neuron projection guidance | 64/3918 | 228/18723 | 6.02e-03 | 3.78e-02 | 64 |
| GO:00074111 | Colorectum | SER | axon guidance | 51/2897 | 227/18723 | 3.29e-03 | 2.82e-02 | 51 |
| GO:00974851 | Colorectum | SER | neuron projection guidance | 51/2897 | 228/18723 | 3.61e-03 | 3.03e-02 | 51 |
| GO:00615641 | Colorectum | SER | axon development | 94/2897 | 467/18723 | 3.78e-03 | 3.13e-02 | 94 |
| GO:00074091 | Colorectum | SER | axonogenesis | 84/2897 | 418/18723 | 6.20e-03 | 4.49e-02 | 84 |
| GO:00074092 | Colorectum | MSS | axonogenesis | 105/3467 | 418/18723 | 4.32e-04 | 5.23e-03 | 105 |
| GO:00615642 | Colorectum | MSS | axon development | 115/3467 | 467/18723 | 5.33e-04 | 6.00e-03 | 115 |
| GO:00615643 | Colorectum | FAP | axon development | 106/2622 | 467/18723 | 1.98e-07 | 1.21e-05 | 106 |
| GO:00074093 | Colorectum | FAP | axonogenesis | 97/2622 | 418/18723 | 2.20e-07 | 1.30e-05 | 97 |
| GO:00074094 | Colorectum | CRC | axonogenesis | 81/2078 | 418/18723 | 3.60e-07 | 2.99e-05 | 81 |
| GO:00615644 | Colorectum | CRC | axon development | 86/2078 | 467/18723 | 1.48e-06 | 8.12e-05 | 86 |
| GO:0050804 | Colorectum | CRC | modulation of chemical synaptic transmission | 70/2078 | 439/18723 | 1.15e-03 | 1.33e-02 | 70 |
| GO:0099177 | Colorectum | CRC | regulation of trans-synaptic signaling | 70/2078 | 440/18723 | 1.23e-03 | 1.38e-02 | 70 |
| GO:00615646 | Lung | IAC | axon development | 78/2061 | 467/18723 | 1.12e-04 | 2.15e-03 | 78 |
| GO:00074096 | Lung | IAC | axonogenesis | 71/2061 | 418/18723 | 1.33e-04 | 2.48e-03 | 71 |
| Page: 1 |
| Pathway ID | Tissue | Disease Stage | Description | Gene Ratio | Bg Ratio | pvalue | p.adjust | qvalue | Count |
| Page: 1 |
Top |
Cell-cell communication analysis |
| Identification of potential cell-cell interactions between two cell types and their ligand-receptor pairs for different disease states |
| Ligand | Receptor | LRpair | Pathway | Tissue | Disease Stage |
| Page: 1 |
Top |
Single-cell gene regulatory network inference analysis |
| Find out the significant the regulons (TFs) and the target genes of each regulon across cell types for different disease states |
| TF | Cell Type | Tissue | Disease Stage | Target Gene | RSS | Regulon Activity |
| ∗The dot plots of a searched regulon are shown for all cell subpopulations in each disease state of each tissue based on the regulon specific score inferred using pySCENIC and by calculating the average expression. |
| Page: 1 |
Top |
Somatic mutation of malignant transformation related genes |
| Annotation of somatic variants for genes involved in malignant transformation |
| Hugo Symbol | Variant Class | Variant Classification | dbSNP RS | HGVSc | HGVSp | HGVSp Short | SWISSPROT | BIOTYPE | SIFT | PolyPhen | Tumor Sample Barcode | Tissue | Histology | Sex | Age | Stage | Therapy Types | Drugs | Outcome |
| CNTN4 | SNV | Missense_Mutation | c.2011N>C | p.Glu671Gln | p.E671Q | Q8IWV2 | protein_coding | deleterious(0.01) | probably_damaging(0.998) | TCGA-A1-A0SH-01 | Breast | breast invasive carcinoma | Female | <65 | I/II | Chemotherapy | tc | SD | |
| CNTN4 | SNV | Missense_Mutation | novel | c.2036N>C | p.Val679Ala | p.V679A | Q8IWV2 | protein_coding | tolerated(0.65) | benign(0) | TCGA-A8-A06X-01 | Breast | breast invasive carcinoma | Female | >=65 | I/II | Unknown | Unknown | SD |
| CNTN4 | SNV | Missense_Mutation | rs866550466 | c.2126N>A | p.Gly709Asp | p.G709D | Q8IWV2 | protein_coding | deleterious(0.01) | probably_damaging(1) | TCGA-A8-A09A-01 | Breast | breast invasive carcinoma | Female | <65 | I/II | Hormone Therapy | tamoxiphen | SD |
| CNTN4 | SNV | Missense_Mutation | c.586G>T | p.Val196Phe | p.V196F | Q8IWV2 | protein_coding | deleterious(0) | probably_damaging(1) | TCGA-A8-A09Z-01 | Breast | breast invasive carcinoma | Female | >=65 | I/II | Unknown | Unknown | SD | |
| CNTN4 | SNV | Missense_Mutation | rs759724901 | c.314N>T | p.Ser105Leu | p.S105L | Q8IWV2 | protein_coding | tolerated(0.14) | benign(0.151) | TCGA-AN-A046-01 | Breast | breast invasive carcinoma | Female | >=65 | I/II | Unknown | Unknown | SD |
| CNTN4 | SNV | Missense_Mutation | novel | c.1303N>T | p.Pro435Ser | p.P435S | Q8IWV2 | protein_coding | deleterious(0.01) | probably_damaging(0.986) | TCGA-AN-A046-01 | Breast | breast invasive carcinoma | Female | >=65 | I/II | Unknown | Unknown | SD |
| CNTN4 | SNV | Missense_Mutation | c.1793N>T | p.Gly598Val | p.G598V | Q8IWV2 | protein_coding | deleterious(0) | probably_damaging(0.996) | TCGA-AN-A04C-01 | Breast | breast invasive carcinoma | Female | <65 | I/II | Unknown | Unknown | SD | |
| CNTN4 | SNV | Missense_Mutation | c.2699N>T | p.Pro900Leu | p.P900L | Q8IWV2 | protein_coding | deleterious(0.01) | probably_damaging(0.989) | TCGA-BH-A0EB-01 | Breast | breast invasive carcinoma | Female | >=65 | I/II | Hormone Therapy | arimidex | SD | |
| CNTN4 | SNV | Missense_Mutation | novel | c.545N>T | p.Ala182Val | p.A182V | Q8IWV2 | protein_coding | deleterious(0) | probably_damaging(0.989) | TCGA-BH-A18G-01 | Breast | breast invasive carcinoma | Female | >=65 | I/II | Unknown | Unknown | SD |
| CNTN4 | SNV | Missense_Mutation | c.2788N>C | p.Glu930Gln | p.E930Q | Q8IWV2 | protein_coding | deleterious(0) | probably_damaging(0.999) | TCGA-D8-A1JA-01 | Breast | breast invasive carcinoma | Female | <65 | III/IV | Chemotherapy | adriamycin | PD |
| Page: 1 2 3 4 5 6 7 8 9 10 11 12 13 14 15 16 17 18 |
Top |
Related drugs of malignant transformation related genes |
| Identification of chemicals and drugs interact with genes involved in malignant transfromation |
| (DGIdb 4.0) |
| Entrez ID | Symbol | Category | Interaction Types | Drug Claim Name | Drug Name | PMIDs |
| Page: 1 |

Copyright 2023-Present -The University of Texas Health Science Center at Houston |