
|
|||||
|
 | |
| |
| |
| |
| |
| |
|
Gene: CLUAP1 |
Gene summary for CLUAP1 |
| Gene information | Species | Human | Gene symbol | CLUAP1 | Gene ID | 23059 |
| Gene name | clusterin associated protein 1 | |
| Gene Alias | CFAP22 | |
| Cytomap | 16p13.3 | |
| Gene Type | protein-coding | GO ID | GO:0006996 | UniProtAcc | J3KNW5 |
Top |
Malignant transformation analysis |
| Identification of the aberrant gene expression in precancerous and cancerous lesions by comparing the gene expression of stem-like cells in diseased tissues with normal stem cells |
| Entrez ID | Symbol | Replicates | Species | Organ | Tissue | Adj P-value | Log2FC | Malignancy |
| 23059 | CLUAP1 | P22T-E | Human | Esophagus | ESCC | 2.96e-48 | 7.86e-01 | 0.1236 |
| 23059 | CLUAP1 | P23T-E | Human | Esophagus | ESCC | 3.30e-13 | 3.22e-01 | 0.108 |
| 23059 | CLUAP1 | P24T-E | Human | Esophagus | ESCC | 2.56e-08 | 2.63e-01 | 0.1287 |
| 23059 | CLUAP1 | P26T-E | Human | Esophagus | ESCC | 4.71e-33 | 5.95e-01 | 0.1276 |
| 23059 | CLUAP1 | P27T-E | Human | Esophagus | ESCC | 1.16e-37 | 6.30e-01 | 0.1055 |
| 23059 | CLUAP1 | P28T-E | Human | Esophagus | ESCC | 7.31e-35 | 6.11e-01 | 0.1149 |
| 23059 | CLUAP1 | P30T-E | Human | Esophagus | ESCC | 1.05e-28 | 1.06e+00 | 0.137 |
| 23059 | CLUAP1 | P31T-E | Human | Esophagus | ESCC | 4.62e-62 | 8.89e-01 | 0.1251 |
| 23059 | CLUAP1 | P32T-E | Human | Esophagus | ESCC | 2.65e-20 | 4.21e-01 | 0.1666 |
| 23059 | CLUAP1 | P36T-E | Human | Esophagus | ESCC | 1.87e-09 | 3.54e-01 | 0.1187 |
| 23059 | CLUAP1 | P37T-E | Human | Esophagus | ESCC | 4.26e-20 | 3.59e-01 | 0.1371 |
| 23059 | CLUAP1 | P39T-E | Human | Esophagus | ESCC | 2.06e-13 | 2.81e-01 | 0.0894 |
| 23059 | CLUAP1 | P40T-E | Human | Esophagus | ESCC | 1.38e-15 | 4.79e-01 | 0.109 |
| 23059 | CLUAP1 | P42T-E | Human | Esophagus | ESCC | 5.40e-14 | 3.73e-01 | 0.1175 |
| 23059 | CLUAP1 | P44T-E | Human | Esophagus | ESCC | 1.49e-02 | 1.80e-01 | 0.1096 |
| 23059 | CLUAP1 | P47T-E | Human | Esophagus | ESCC | 6.50e-16 | 3.23e-01 | 0.1067 |
| 23059 | CLUAP1 | P48T-E | Human | Esophagus | ESCC | 2.27e-23 | 4.44e-01 | 0.0959 |
| 23059 | CLUAP1 | P49T-E | Human | Esophagus | ESCC | 5.86e-11 | 1.05e+00 | 0.1768 |
| 23059 | CLUAP1 | P52T-E | Human | Esophagus | ESCC | 9.09e-11 | 1.93e-01 | 0.1555 |
| 23059 | CLUAP1 | P54T-E | Human | Esophagus | ESCC | 5.54e-10 | 2.90e-01 | 0.0975 |
| Page: 1 2 3 4 5 |
| Tissue | Expression Dynamics | Abbreviation |
| Esophagus | 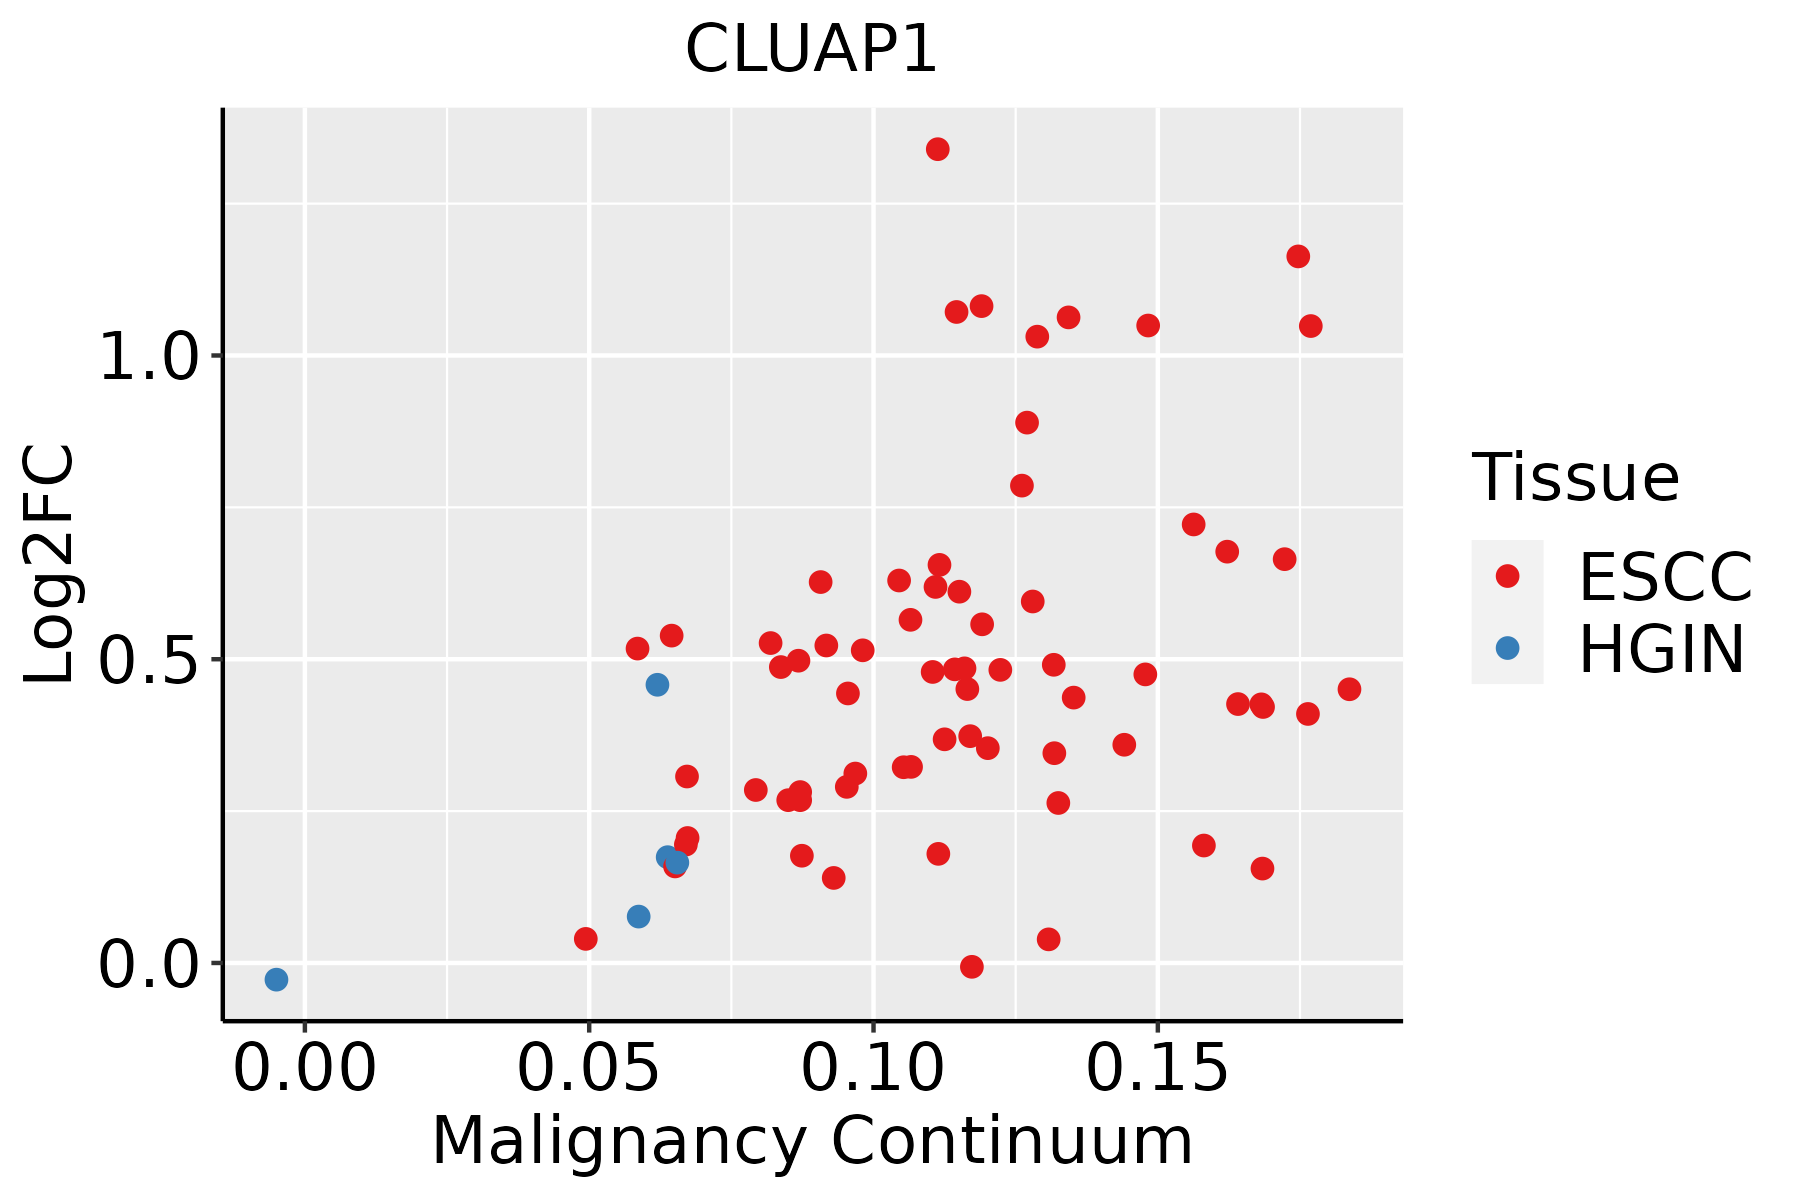 | ESCC: Esophageal squamous cell carcinoma |
| HGIN: High-grade intraepithelial neoplasias | ||
| LGIN: Low-grade intraepithelial neoplasias | ||
| Liver | 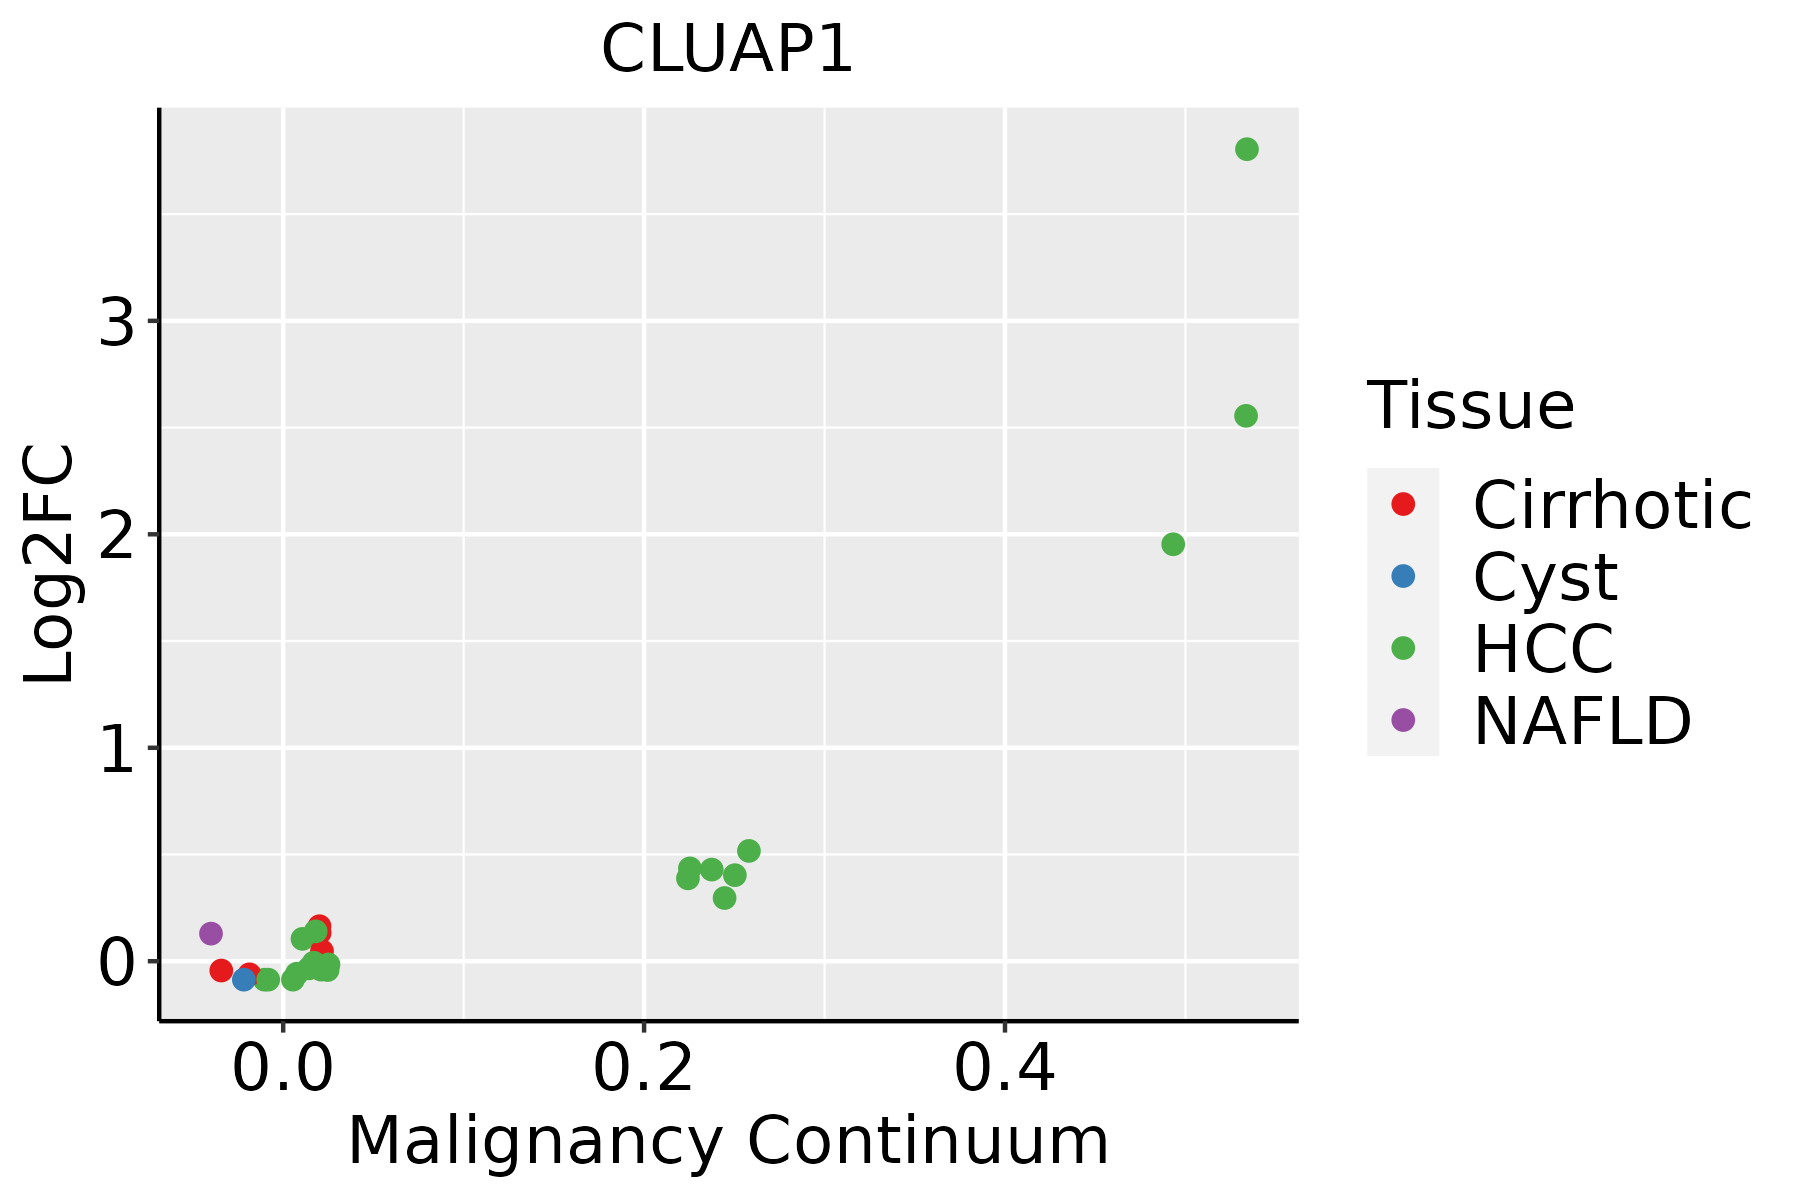 | HCC: Hepatocellular carcinoma |
| NAFLD: Non-alcoholic fatty liver disease | ||
| Oral Cavity | 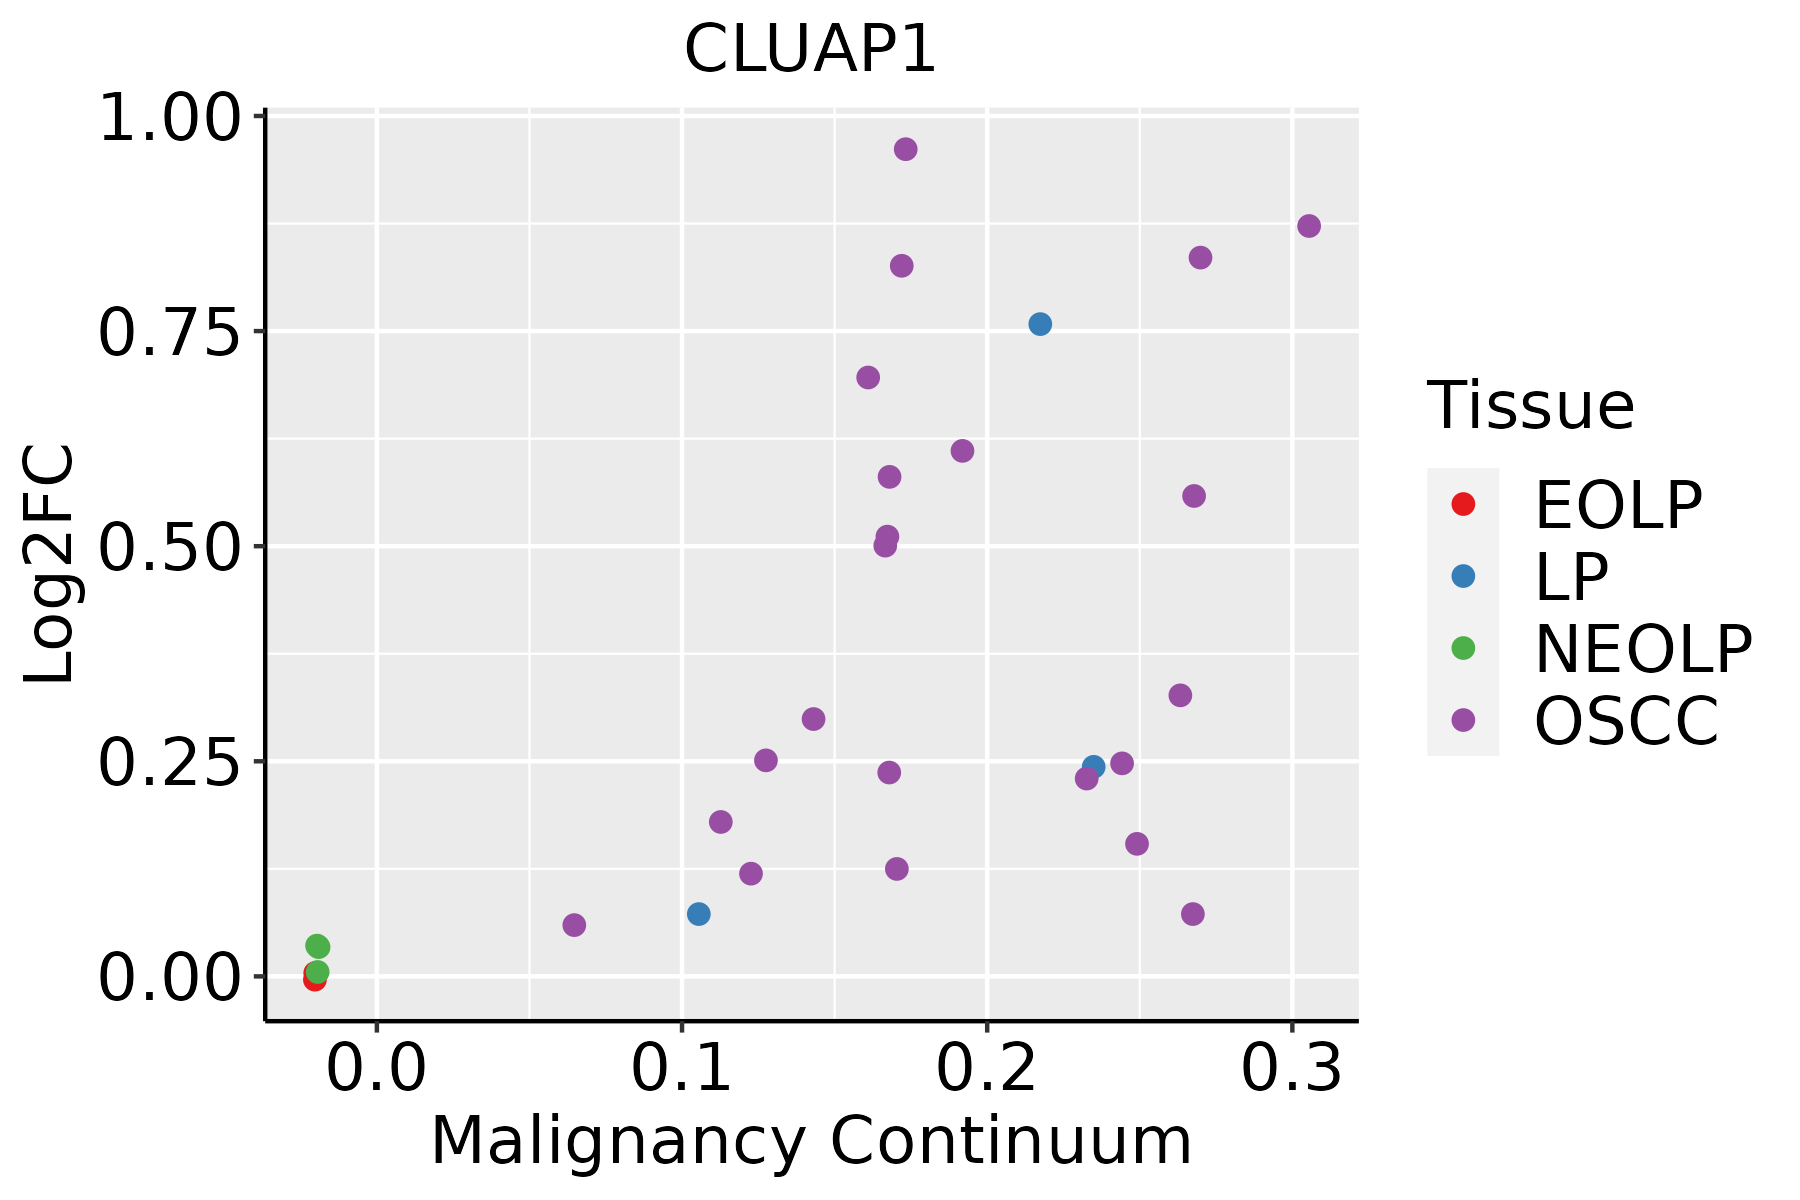 | EOLP: Erosive Oral lichen planus |
| LP: leukoplakia | ||
| NEOLP: Non-erosive oral lichen planus | ||
| OSCC: Oral squamous cell carcinoma | ||
| Thyroid | 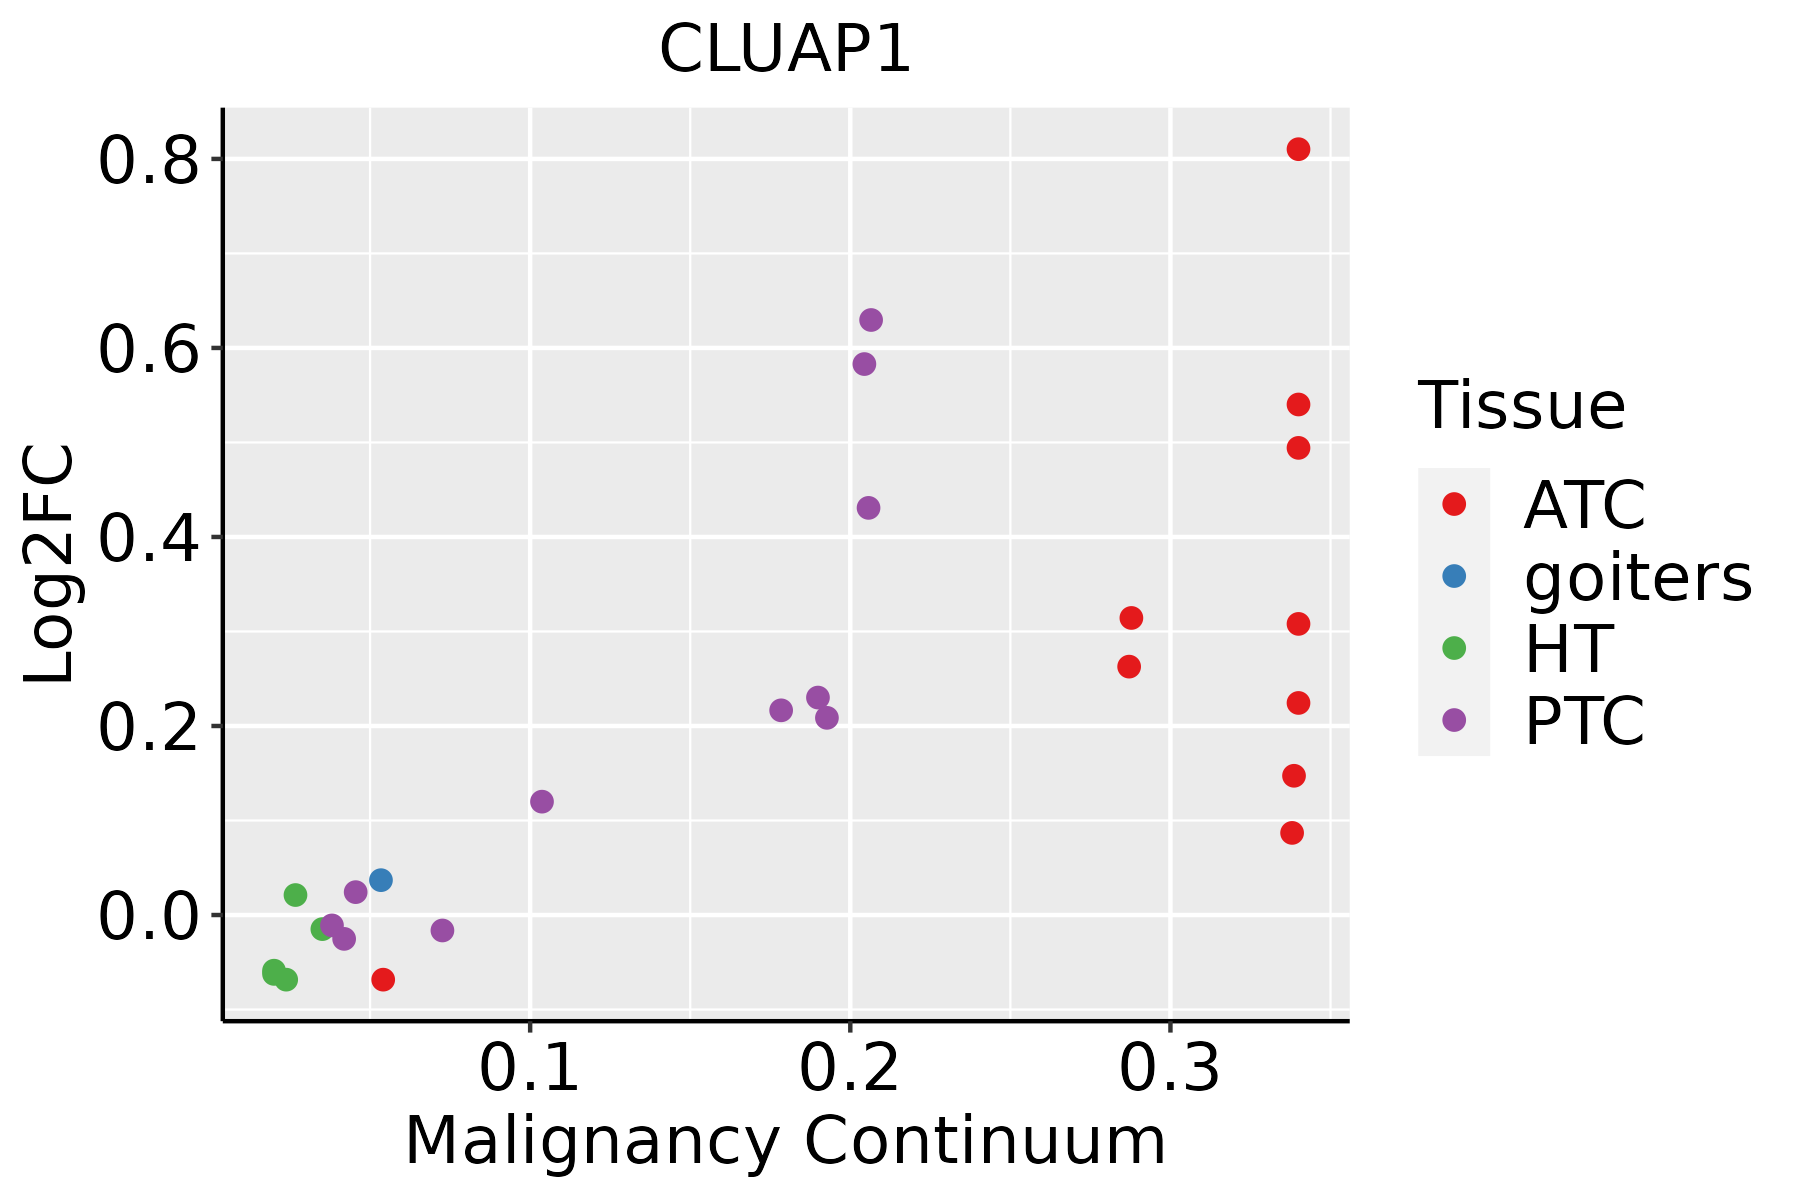 | ATC: Anaplastic thyroid cancer |
| HT: Hashimoto's thyroiditis | ||
| PTC: Papillary thyroid cancer |
| ∗log2FC in expression of this searched gene in stem-like cells from each diseased tissue sample relative to stem-like cells in normal samples in each tissue plotted against the malignancy continuum. Samples are colored based on if they are from different disease stage. |
Top |
Malignant transformation related pathway analysis |
| Find out the enriched GO biological processes and KEGG pathways involved in transition from healthy to precancer to cancer |
| Tissue | Disease Stage | Enriched GO biological Processes |
| Colorectum | AD |  |
| Colorectum | SER |  |
| Colorectum | MSS |  |
| Colorectum | MSI-H |  |
| Colorectum | FAP |  |
| ∗Top 15 enriched GO BP terms are showed in the bar plot of each disease state in each tissue. Each row represents a significant GO biological process which is colored according to the -log10(p.adjust). |
| Page: 1 2 3 4 5 6 7 8 9 |
| GO ID | Tissue | Disease Stage | Description | Gene Ratio | Bg Ratio | pvalue | p.adjust | Count |
| Page: 1 |
| Pathway ID | Tissue | Disease Stage | Description | Gene Ratio | Bg Ratio | pvalue | p.adjust | qvalue | Count |
| Page: 1 |
Top |
Cell-cell communication analysis |
| Identification of potential cell-cell interactions between two cell types and their ligand-receptor pairs for different disease states |
| Ligand | Receptor | LRpair | Pathway | Tissue | Disease Stage |
| Page: 1 |
Top |
Single-cell gene regulatory network inference analysis |
| Find out the significant the regulons (TFs) and the target genes of each regulon across cell types for different disease states |
| TF | Cell Type | Tissue | Disease Stage | Target Gene | RSS | Regulon Activity |
| ∗The dot plots of a searched regulon are shown for all cell subpopulations in each disease state of each tissue based on the regulon specific score inferred using pySCENIC and by calculating the average expression. |
| Page: 1 |
Top |
Somatic mutation of malignant transformation related genes |
| Annotation of somatic variants for genes involved in malignant transformation |
| Hugo Symbol | Variant Class | Variant Classification | dbSNP RS | HGVSc | HGVSp | HGVSp Short | SWISSPROT | BIOTYPE | SIFT | PolyPhen | Tumor Sample Barcode | Tissue | Histology | Sex | Age | Stage | Therapy Types | Drugs | Outcome |
| CLUAP1 | SNV | Missense_Mutation | c.388N>G | p.Leu130Val | p.L130V | protein_coding | tolerated(0.21) | benign(0.014) | TCGA-AN-A0XW-01 | Breast | breast invasive carcinoma | Female | <65 | III/IV | Unknown | Unknown | SD | ||
| CLUAP1 | SNV | Missense_Mutation | novel | c.1010N>C | p.Gln337Pro | p.Q337P | protein_coding | tolerated(0.1) | benign(0.006) | TCGA-B6-A400-01 | Breast | breast invasive carcinoma | Female | <65 | III/IV | Unknown | Unknown | SD | |
| CLUAP1 | SNV | Missense_Mutation | c.960N>T | p.Glu320Asp | p.E320D | protein_coding | tolerated(0.11) | benign(0.024) | TCGA-D8-A1J8-01 | Breast | breast invasive carcinoma | Female | >=65 | I/II | Hormone Therapy | nolvadex | SD | ||
| CLUAP1 | SNV | Missense_Mutation | c.1174G>T | p.Asp392Tyr | p.D392Y | protein_coding | tolerated(0.34) | probably_damaging(0.967) | TCGA-D8-A1JA-01 | Breast | breast invasive carcinoma | Female | <65 | III/IV | Chemotherapy | adriamycin | PD | ||
| CLUAP1 | insertion | Frame_Shift_Ins | novel | c.1276_1277insTAGGGGGAGTCTCTAGGTCCAGTGGCCCTCAGCGC | p.Asp426ValfsTer46 | p.D426Vfs*46 | protein_coding | TCGA-AR-A0TY-01 | Breast | breast invasive carcinoma | Female | <65 | I/II | Unspecific | Paclitaxel | PD | |||
| CLUAP1 | deletion | Frame_Shift_Del | novel | c.651delC | p.Ile217MetfsTer6 | p.I217Mfs*6 | protein_coding | TCGA-D8-A27V-01 | Breast | breast invasive carcinoma | Female | <65 | I/II | Hormone Therapy | tamoxiphen | SD | |||
| CLUAP1 | deletion | Frame_Shift_Del | novel | c.913delC | p.Leu305CysfsTer12 | p.L305Cfs*12 | protein_coding | TCGA-EW-A2FV-01 | Breast | breast invasive carcinoma | Female | <65 | III/IV | Chemotherapy | docetaxel | SD | |||
| CLUAP1 | SNV | Missense_Mutation | novel | c.20G>A | p.Arg7His | p.R7H | protein_coding | deleterious(0) | benign(0.16) | TCGA-2W-A8YY-01 | Cervix | cervical & endocervical cancer | Female | <65 | I/II | Chemotherapy | cisplatin | CR | |
| CLUAP1 | SNV | Missense_Mutation | novel | c.737A>G | p.Glu246Gly | p.E246G | protein_coding | deleterious(0) | probably_damaging(0.995) | TCGA-2W-A8YY-01 | Cervix | cervical & endocervical cancer | Female | <65 | I/II | Chemotherapy | cisplatin | CR | |
| CLUAP1 | SNV | Missense_Mutation | rs778178545 | c.657N>C | p.Lys219Asn | p.K219N | protein_coding | deleterious(0) | probably_damaging(0.997) | TCGA-C5-A1MH-01 | Cervix | cervical & endocervical cancer | Female | >=65 | III/IV | Chemotherapy | cisplatin | PD |
| Page: 1 2 3 4 5 |
Top |
Related drugs of malignant transformation related genes |
| Identification of chemicals and drugs interact with genes involved in malignant transfromation |
| (DGIdb 4.0) |
| Entrez ID | Symbol | Category | Interaction Types | Drug Claim Name | Drug Name | PMIDs |
| Page: 1 |

Copyright 2023-Present -The University of Texas Health Science Center at Houston |