
|
|||||
|
 | |
| |
| |
| |
| |
| |
|
Gene: CISD1 |
Gene summary for CISD1 |
| Gene information | Species | Human | Gene symbol | CISD1 | Gene ID | 55847 |
| Gene name | CDGSH iron sulfur domain 1 | |
| Gene Alias | C10orf70 | |
| Cytomap | 10q21.1 | |
| Gene Type | protein-coding | GO ID | GO:0006091 | UniProtAcc | A0A024QZN7 |
Top |
Malignant transformation analysis |
| Identification of the aberrant gene expression in precancerous and cancerous lesions by comparing the gene expression of stem-like cells in diseased tissues with normal stem cells |
| Entrez ID | Symbol | Replicates | Species | Organ | Tissue | Adj P-value | Log2FC | Malignancy |
| 55847 | CISD1 | LZE8T | Human | Esophagus | ESCC | 6.41e-07 | 3.24e-01 | 0.067 |
| 55847 | CISD1 | LZE20T | Human | Esophagus | ESCC | 3.51e-11 | 2.38e-01 | 0.0662 |
| 55847 | CISD1 | LZE22D1 | Human | Esophagus | HGIN | 5.89e-03 | 1.98e-01 | 0.0595 |
| 55847 | CISD1 | LZE24T | Human | Esophagus | ESCC | 8.04e-18 | 7.53e-01 | 0.0596 |
| 55847 | CISD1 | LZE21T | Human | Esophagus | ESCC | 3.36e-06 | 3.78e-01 | 0.0655 |
| 55847 | CISD1 | P2T-E | Human | Esophagus | ESCC | 3.71e-11 | 3.24e-01 | 0.1177 |
| 55847 | CISD1 | P4T-E | Human | Esophagus | ESCC | 4.15e-33 | 9.46e-01 | 0.1323 |
| 55847 | CISD1 | P5T-E | Human | Esophagus | ESCC | 1.09e-24 | 7.65e-01 | 0.1327 |
| 55847 | CISD1 | P8T-E | Human | Esophagus | ESCC | 6.13e-33 | 9.56e-01 | 0.0889 |
| 55847 | CISD1 | P9T-E | Human | Esophagus | ESCC | 1.37e-11 | 4.77e-01 | 0.1131 |
| 55847 | CISD1 | P10T-E | Human | Esophagus | ESCC | 5.42e-14 | 3.38e-01 | 0.116 |
| 55847 | CISD1 | P11T-E | Human | Esophagus | ESCC | 2.85e-07 | 5.93e-01 | 0.1426 |
| 55847 | CISD1 | P12T-E | Human | Esophagus | ESCC | 1.35e-02 | 2.73e-01 | 0.1122 |
| 55847 | CISD1 | P15T-E | Human | Esophagus | ESCC | 6.80e-22 | 5.01e-01 | 0.1149 |
| 55847 | CISD1 | P16T-E | Human | Esophagus | ESCC | 6.32e-16 | 4.13e-01 | 0.1153 |
| 55847 | CISD1 | P17T-E | Human | Esophagus | ESCC | 2.37e-12 | 5.80e-01 | 0.1278 |
| 55847 | CISD1 | P19T-E | Human | Esophagus | ESCC | 1.12e-03 | 8.51e-01 | 0.1662 |
| 55847 | CISD1 | P20T-E | Human | Esophagus | ESCC | 1.72e-30 | 7.17e-01 | 0.1124 |
| 55847 | CISD1 | P21T-E | Human | Esophagus | ESCC | 3.83e-46 | 1.29e+00 | 0.1617 |
| 55847 | CISD1 | P22T-E | Human | Esophagus | ESCC | 1.97e-22 | 4.26e-01 | 0.1236 |
| Page: 1 2 3 4 5 6 7 |
| Tissue | Expression Dynamics | Abbreviation |
| Colorectum (GSE201348) | 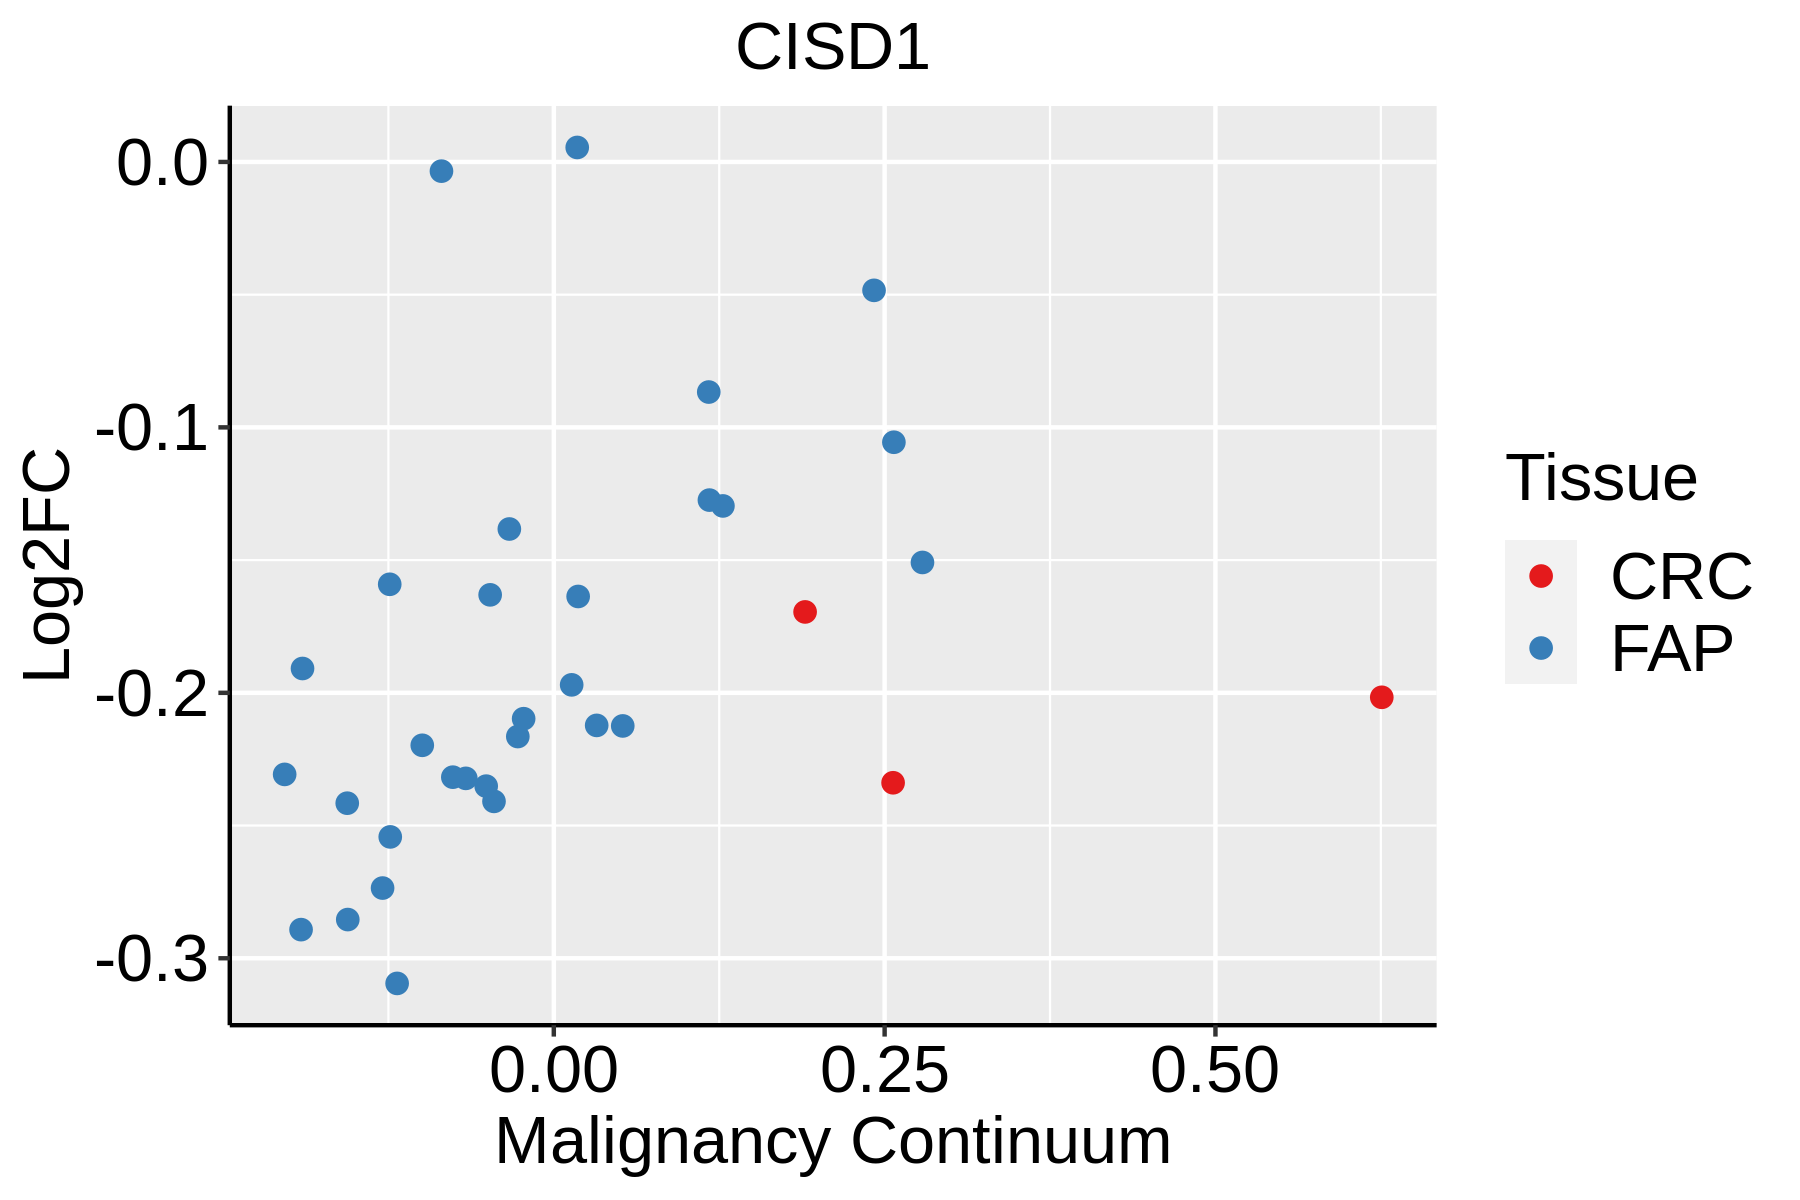 | FAP: Familial adenomatous polyposis |
| CRC: Colorectal cancer | ||
| Colorectum (HTA11) |  | AD: Adenomas |
| SER: Sessile serrated lesions | ||
| MSI-H: Microsatellite-high colorectal cancer | ||
| MSS: Microsatellite stable colorectal cancer | ||
| Esophagus | 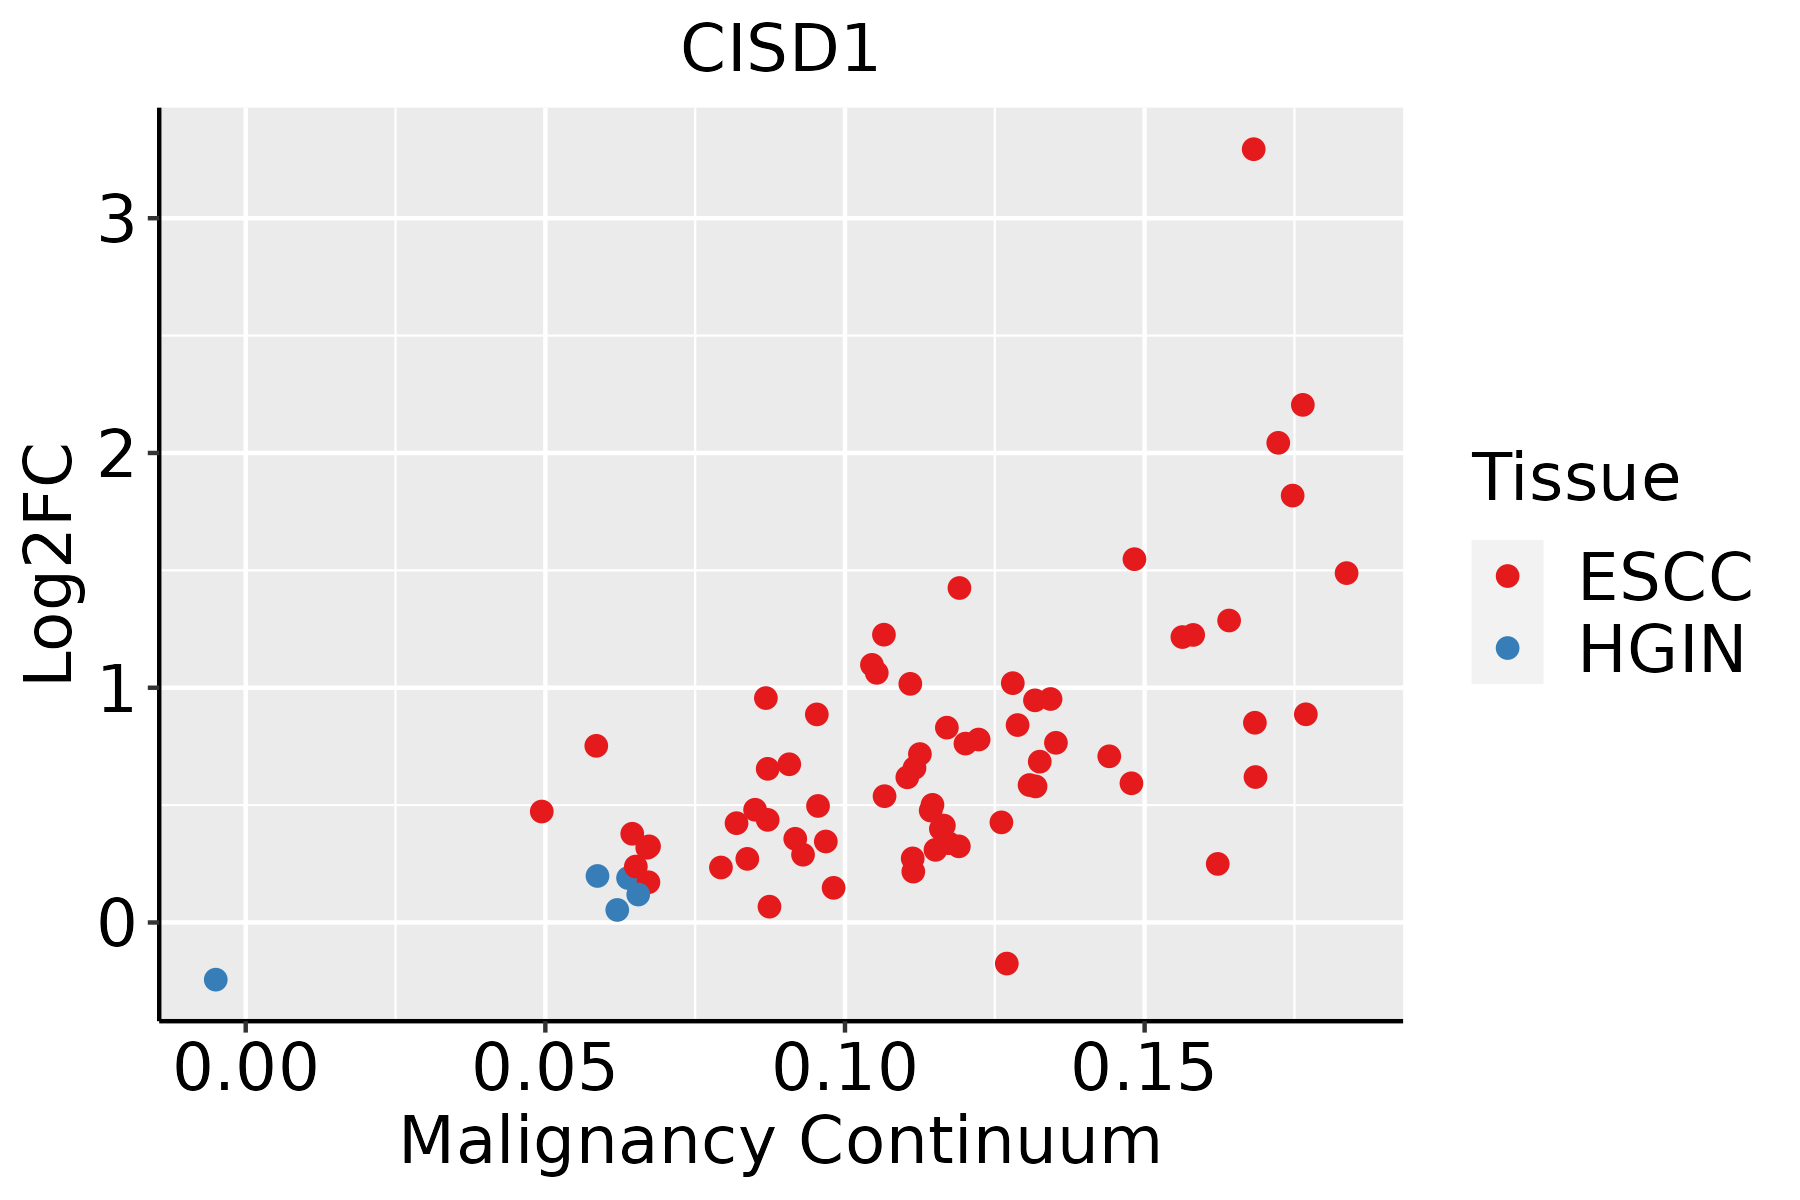 | ESCC: Esophageal squamous cell carcinoma |
| HGIN: High-grade intraepithelial neoplasias | ||
| LGIN: Low-grade intraepithelial neoplasias | ||
| Liver | 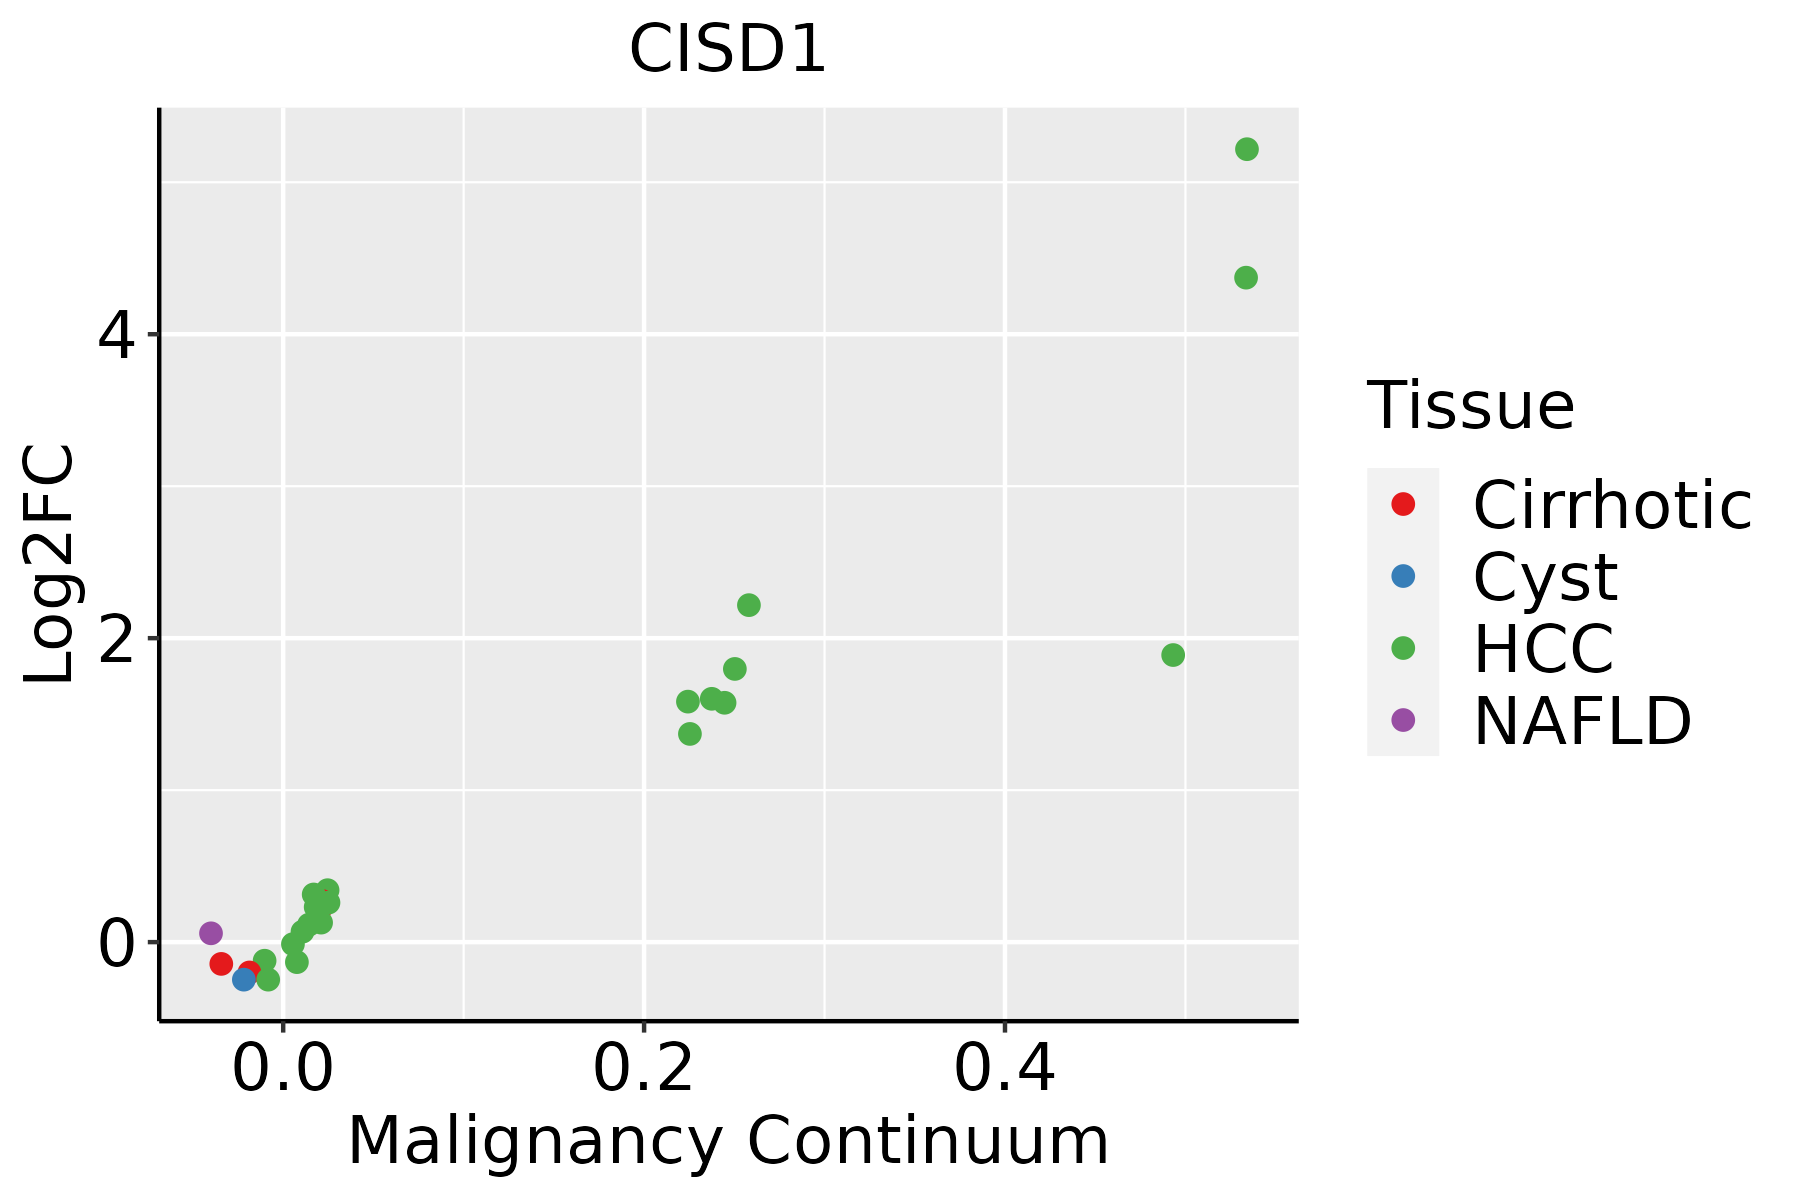 | HCC: Hepatocellular carcinoma |
| NAFLD: Non-alcoholic fatty liver disease | ||
| Oral Cavity |  | EOLP: Erosive Oral lichen planus |
| LP: leukoplakia | ||
| NEOLP: Non-erosive oral lichen planus | ||
| OSCC: Oral squamous cell carcinoma | ||
| Skin | 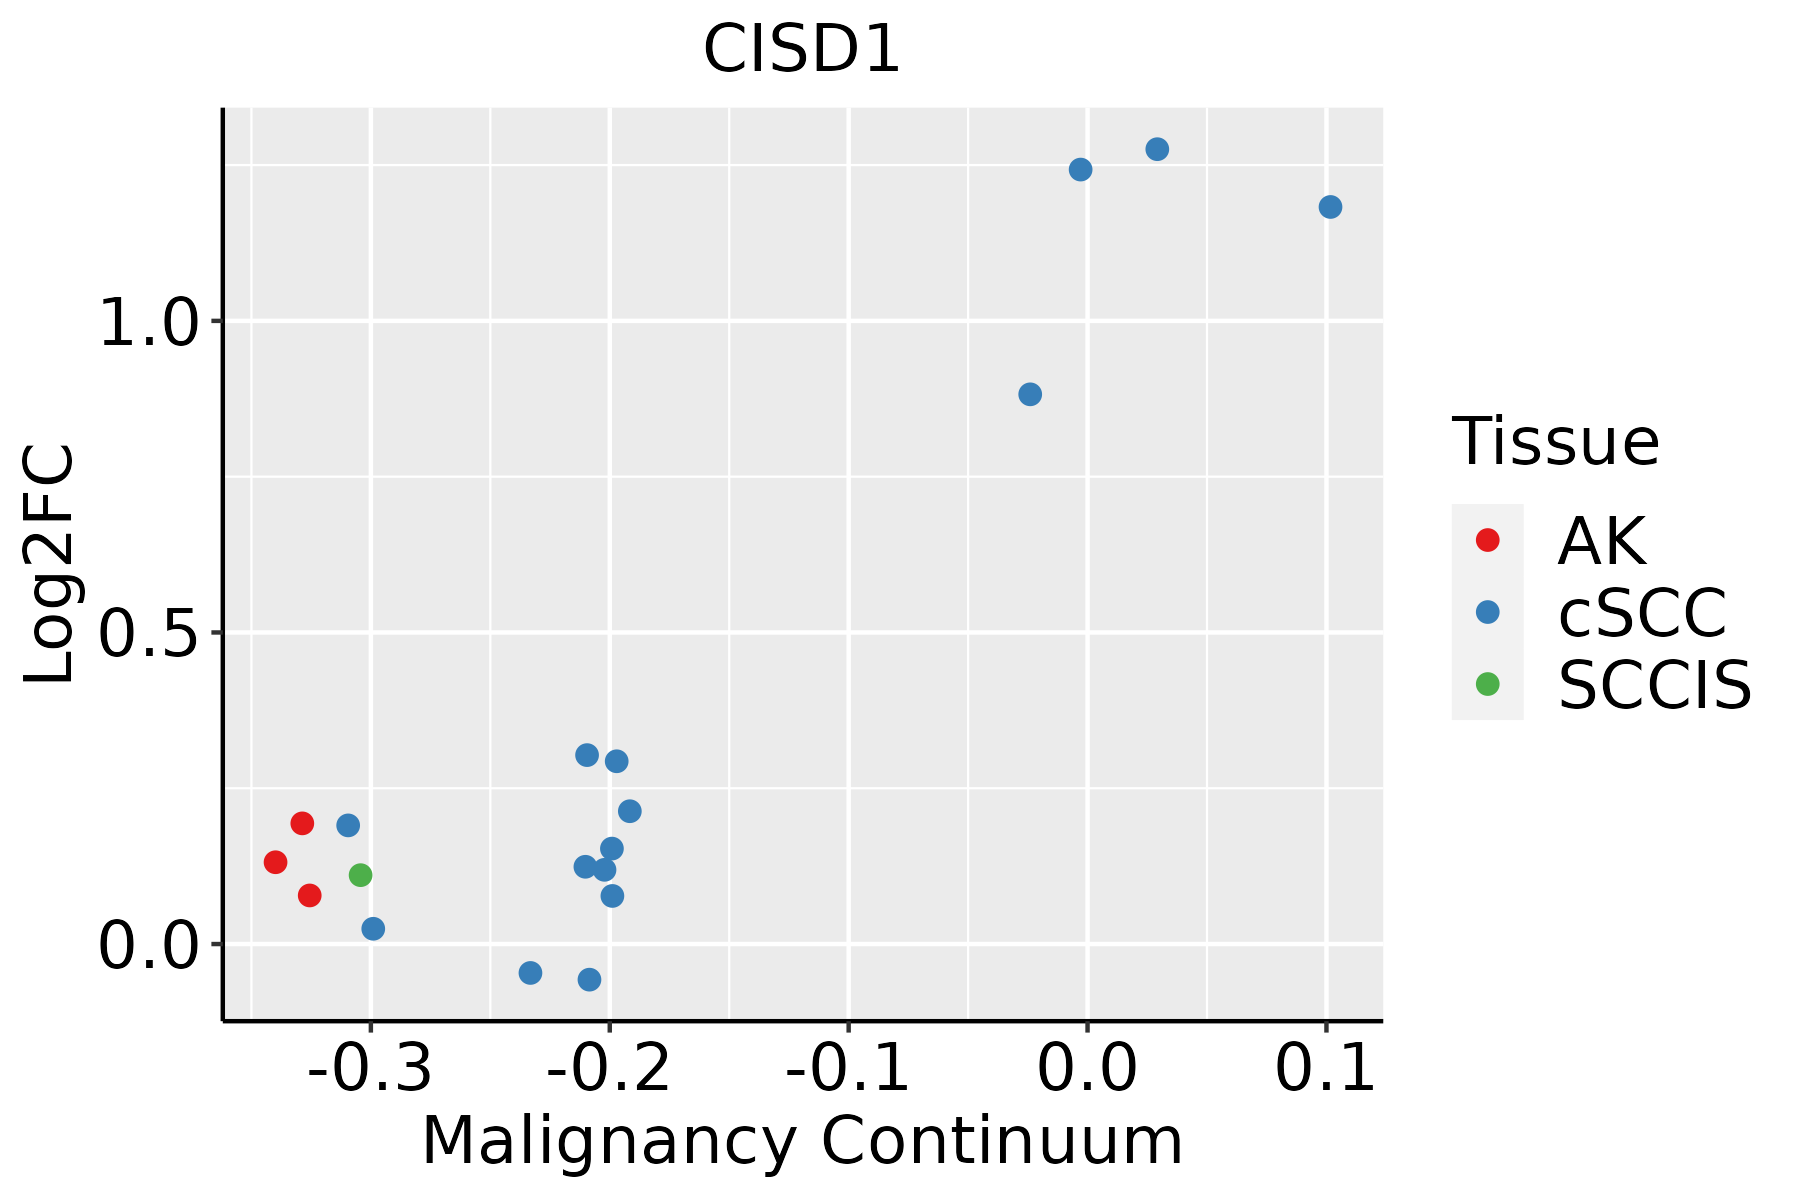 | AK: Actinic keratosis |
| cSCC: Cutaneous squamous cell carcinoma | ||
| SCCIS:squamous cell carcinoma in situ | ||
| Thyroid | 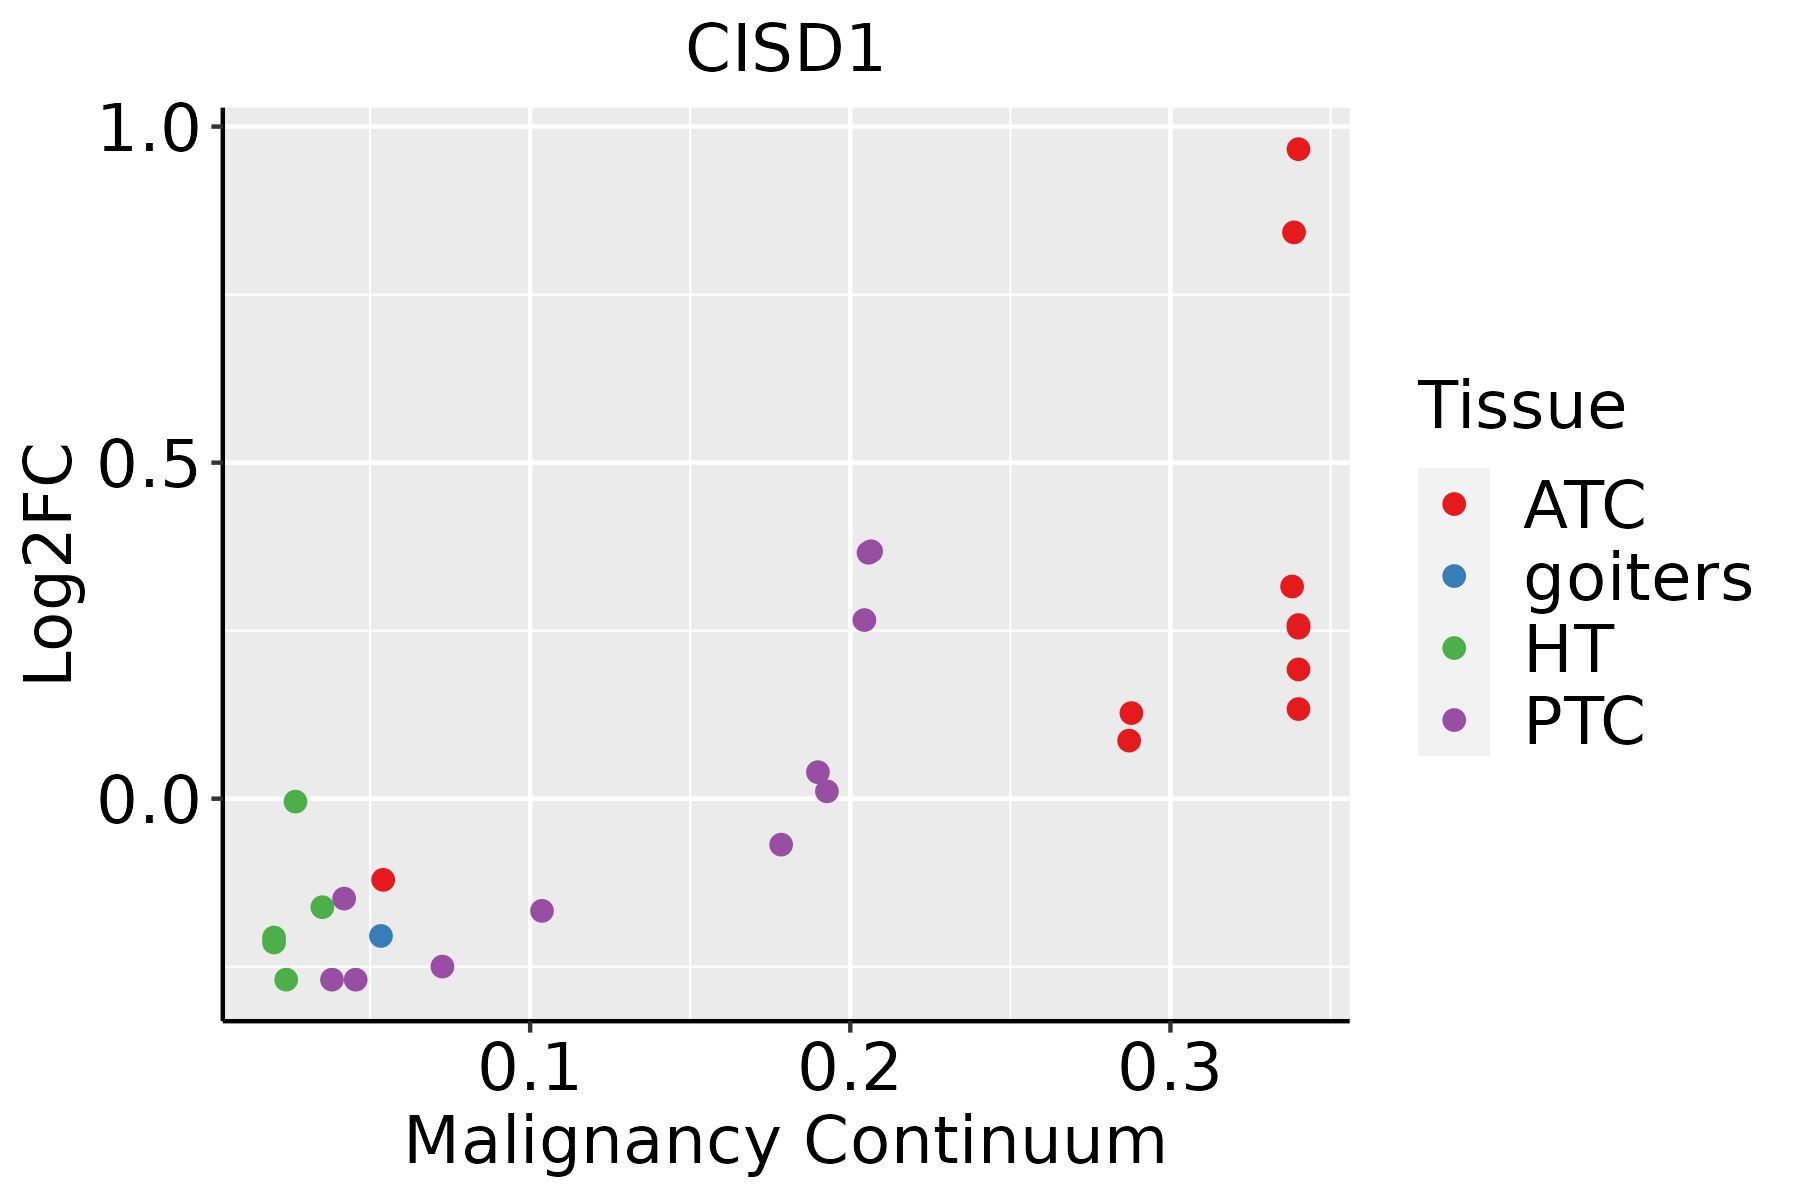 | ATC: Anaplastic thyroid cancer |
| HT: Hashimoto's thyroiditis | ||
| PTC: Papillary thyroid cancer |
| ∗log2FC in expression of this searched gene in stem-like cells from each diseased tissue sample relative to stem-like cells in normal samples in each tissue plotted against the malignancy continuum. Samples are colored based on if they are from different disease stage. |
Top |
Malignant transformation related pathway analysis |
| Find out the enriched GO biological processes and KEGG pathways involved in transition from healthy to precancer to cancer |
| Tissue | Disease Stage | Enriched GO biological Processes |
| Colorectum | AD |  |
| Colorectum | SER |  |
| Colorectum | MSS |  |
| Colorectum | MSI-H |  |
| Colorectum | FAP |  |
| ∗Top 15 enriched GO BP terms are showed in the bar plot of each disease state in each tissue. Each row represents a significant GO biological process which is colored according to the -log10(p.adjust). |
| Page: 1 2 3 4 5 6 7 8 9 |
| GO ID | Tissue | Disease Stage | Description | Gene Ratio | Bg Ratio | pvalue | p.adjust | Count |
| GO:0006091 | Colorectum | AD | generation of precursor metabolites and energy | 209/3918 | 490/18723 | 3.17e-28 | 6.61e-25 | 209 |
| GO:0045333 | Colorectum | AD | cellular respiration | 119/3918 | 230/18723 | 3.21e-25 | 4.02e-22 | 119 |
| GO:0015980 | Colorectum | AD | energy derivation by oxidation of organic compounds | 143/3918 | 318/18723 | 2.78e-22 | 2.49e-19 | 143 |
| GO:0010506 | Colorectum | AD | regulation of autophagy | 111/3918 | 317/18723 | 3.57e-09 | 2.35e-07 | 111 |
| GO:0043467 | Colorectum | AD | regulation of generation of precursor metabolites and energy | 49/3918 | 130/18723 | 8.33e-06 | 1.99e-04 | 49 |
| GO:0043457 | Colorectum | AD | regulation of cellular respiration | 20/3918 | 49/18723 | 1.23e-03 | 1.09e-02 | 20 |
| GO:00060914 | Colorectum | FAP | generation of precursor metabolites and energy | 128/2622 | 490/18723 | 5.58e-13 | 4.28e-10 | 128 |
| GO:00159804 | Colorectum | FAP | energy derivation by oxidation of organic compounds | 85/2622 | 318/18723 | 1.36e-09 | 2.77e-07 | 85 |
| GO:00453334 | Colorectum | FAP | cellular respiration | 65/2622 | 230/18723 | 1.13e-08 | 1.33e-06 | 65 |
| GO:00105063 | Colorectum | FAP | regulation of autophagy | 80/2622 | 317/18723 | 6.43e-08 | 4.54e-06 | 80 |
| GO:00434674 | Colorectum | FAP | regulation of generation of precursor metabolites and energy | 34/2622 | 130/18723 | 1.78e-04 | 2.64e-03 | 34 |
| GO:00105064 | Colorectum | CRC | regulation of autophagy | 62/2078 | 317/18723 | 6.04e-06 | 2.35e-04 | 62 |
| GO:00060915 | Colorectum | CRC | generation of precursor metabolites and energy | 80/2078 | 490/18723 | 2.55e-04 | 4.16e-03 | 80 |
| GO:000609120 | Esophagus | HGIN | generation of precursor metabolites and energy | 145/2587 | 490/18723 | 3.41e-20 | 2.04e-17 | 145 |
| GO:004533320 | Esophagus | HGIN | cellular respiration | 86/2587 | 230/18723 | 2.41e-19 | 1.20e-16 | 86 |
| GO:001598020 | Esophagus | HGIN | energy derivation by oxidation of organic compounds | 105/2587 | 318/18723 | 1.16e-18 | 4.99e-16 | 105 |
| GO:001050616 | Esophagus | HGIN | regulation of autophagy | 84/2587 | 317/18723 | 1.39e-09 | 1.08e-07 | 84 |
| GO:004346718 | Esophagus | HGIN | regulation of generation of precursor metabolites and energy | 34/2587 | 130/18723 | 1.37e-04 | 2.76e-03 | 34 |
| GO:0006091110 | Esophagus | ESCC | generation of precursor metabolites and energy | 331/8552 | 490/18723 | 3.86e-23 | 8.45e-21 | 331 |
| GO:0045333110 | Esophagus | ESCC | cellular respiration | 173/8552 | 230/18723 | 4.53e-20 | 5.99e-18 | 173 |
| Page: 1 2 3 4 |
| Pathway ID | Tissue | Disease Stage | Description | Gene Ratio | Bg Ratio | pvalue | p.adjust | qvalue | Count |
| Page: 1 |
Top |
Cell-cell communication analysis |
| Identification of potential cell-cell interactions between two cell types and their ligand-receptor pairs for different disease states |
| Ligand | Receptor | LRpair | Pathway | Tissue | Disease Stage |
| Page: 1 |
Top |
Single-cell gene regulatory network inference analysis |
| Find out the significant the regulons (TFs) and the target genes of each regulon across cell types for different disease states |
| TF | Cell Type | Tissue | Disease Stage | Target Gene | RSS | Regulon Activity |
| ∗The dot plots of a searched regulon are shown for all cell subpopulations in each disease state of each tissue based on the regulon specific score inferred using pySCENIC and by calculating the average expression. |
| Page: 1 |
Top |
Somatic mutation of malignant transformation related genes |
| Annotation of somatic variants for genes involved in malignant transformation |
| Hugo Symbol | Variant Class | Variant Classification | dbSNP RS | HGVSc | HGVSp | HGVSp Short | SWISSPROT | BIOTYPE | SIFT | PolyPhen | Tumor Sample Barcode | Tissue | Histology | Sex | Age | Stage | Therapy Types | Drugs | Outcome |
| CISD1 | SNV | Missense_Mutation | c.217N>T | p.Arg73Cys | p.R73C | Q9NZ45 | protein_coding | deleterious(0) | probably_damaging(0.961) | TCGA-A8-A0A4-01 | Breast | breast invasive carcinoma | Female | >=65 | I/II | Hormone Therapy | tamoxiphen | CR | |
| CISD1 | SNV | Missense_Mutation | rs769192686 | c.206N>T | p.Ala69Val | p.A69V | Q9NZ45 | protein_coding | tolerated(0.07) | possibly_damaging(0.859) | TCGA-AP-A051-01 | Endometrium | uterine corpus endometrioid carcinoma | Female | >=65 | I/II | Unknown | Unknown | SD |
| CISD1 | SNV | Missense_Mutation | novel | c.62C>T | p.Ala21Val | p.A21V | Q9NZ45 | protein_coding | tolerated(0.14) | benign(0.103) | TCGA-AP-A1DK-01 | Endometrium | uterine corpus endometrioid carcinoma | Female | <65 | I/II | Unknown | Unknown | SD |
| CISD1 | SNV | Missense_Mutation | c.313A>G | p.Lys105Glu | p.K105E | Q9NZ45 | protein_coding | deleterious(0.02) | benign(0.146) | TCGA-AP-A1DK-01 | Endometrium | uterine corpus endometrioid carcinoma | Female | <65 | I/II | Unknown | Unknown | SD | |
| CISD1 | SNV | Missense_Mutation | novel | c.241N>A | p.Pro81Thr | p.P81T | Q9NZ45 | protein_coding | deleterious(0) | probably_damaging(1) | TCGA-AX-A1CE-01 | Endometrium | uterine corpus endometrioid carcinoma | Female | <65 | I/II | Unspecific | Paclitaxel | SD |
| CISD1 | SNV | Missense_Mutation | c.251A>G | p.Asp84Gly | p.D84G | Q9NZ45 | protein_coding | deleterious(0.02) | probably_damaging(0.94) | TCGA-D1-A103-01 | Endometrium | uterine corpus endometrioid carcinoma | Female | >=65 | I/II | Unknown | Unknown | SD | |
| CISD1 | SNV | Missense_Mutation | novel | c.205G>T | p.Ala69Ser | p.A69S | Q9NZ45 | protein_coding | deleterious(0.04) | possibly_damaging(0.814) | TCGA-EO-A22R-01 | Endometrium | uterine corpus endometrioid carcinoma | Female | <65 | I/II | Unknown | Unknown | SD |
| CISD1 | SNV | Missense_Mutation | c.218G>T | p.Arg73Leu | p.R73L | Q9NZ45 | protein_coding | deleterious(0) | possibly_damaging(0.844) | TCGA-L9-A444-01 | Lung | lung adenocarcinoma | Female | <65 | I/II | Unknown | Unknown | SD | |
| CISD1 | SNV | Missense_Mutation | c.103N>C | p.Tyr35His | p.Y35H | Q9NZ45 | protein_coding | tolerated(0.2) | possibly_damaging(0.827) | TCGA-CG-4442-01 | Stomach | stomach adenocarcinoma | Male | >=65 | I/II | Unknown | Unknown | SD | |
| CISD1 | SNV | Missense_Mutation | rs568388348 | c.226N>G | p.Arg76Gly | p.R76G | Q9NZ45 | protein_coding | deleterious(0) | probably_damaging(0.99) | TCGA-HU-A4GH-01 | Stomach | stomach adenocarcinoma | Male | >=65 | I/II | Unknown | Unknown | SD |
| Page: 1 |
Top |
Related drugs of malignant transformation related genes |
| Identification of chemicals and drugs interact with genes involved in malignant transfromation |
| (DGIdb 4.0) |
| Entrez ID | Symbol | Category | Interaction Types | Drug Claim Name | Drug Name | PMIDs |
| Page: 1 |

Copyright 2023-Present -The University of Texas Health Science Center at Houston |