
|
|||||
|
 | |
| |
| |
| |
| |
| |
|
Gene: CIAPIN1 |
Gene summary for CIAPIN1 |
| Gene information | Species | Human | Gene symbol | CIAPIN1 | Gene ID | 57019 |
| Gene name | cytokine induced apoptosis inhibitor 1 | |
| Gene Alias | Anamorsin | |
| Cytomap | 16q21 | |
| Gene Type | protein-coding | GO ID | GO:0002376 | UniProtAcc | Q6FI81 |
Top |
Malignant transformation analysis |
| Identification of the aberrant gene expression in precancerous and cancerous lesions by comparing the gene expression of stem-like cells in diseased tissues with normal stem cells |
| Entrez ID | Symbol | Replicates | Species | Organ | Tissue | Adj P-value | Log2FC | Malignancy |
| 57019 | CIAPIN1 | P17T-E | Human | Esophagus | ESCC | 2.40e-08 | 4.43e-01 | 0.1278 |
| 57019 | CIAPIN1 | P19T-E | Human | Esophagus | ESCC | 5.64e-11 | 8.46e-01 | 0.1662 |
| 57019 | CIAPIN1 | P20T-E | Human | Esophagus | ESCC | 1.35e-28 | 6.62e-01 | 0.1124 |
| 57019 | CIAPIN1 | P21T-E | Human | Esophagus | ESCC | 4.18e-37 | 7.31e-01 | 0.1617 |
| 57019 | CIAPIN1 | P22T-E | Human | Esophagus | ESCC | 3.13e-32 | 6.03e-01 | 0.1236 |
| 57019 | CIAPIN1 | P23T-E | Human | Esophagus | ESCC | 9.28e-26 | 5.62e-01 | 0.108 |
| 57019 | CIAPIN1 | P24T-E | Human | Esophagus | ESCC | 1.77e-25 | 5.32e-01 | 0.1287 |
| 57019 | CIAPIN1 | P26T-E | Human | Esophagus | ESCC | 1.52e-37 | 6.41e-01 | 0.1276 |
| 57019 | CIAPIN1 | P27T-E | Human | Esophagus | ESCC | 1.59e-25 | 3.84e-01 | 0.1055 |
| 57019 | CIAPIN1 | P28T-E | Human | Esophagus | ESCC | 6.73e-24 | 4.82e-01 | 0.1149 |
| 57019 | CIAPIN1 | P30T-E | Human | Esophagus | ESCC | 2.42e-32 | 9.47e-01 | 0.137 |
| 57019 | CIAPIN1 | P31T-E | Human | Esophagus | ESCC | 4.48e-49 | 8.41e-01 | 0.1251 |
| 57019 | CIAPIN1 | P32T-E | Human | Esophagus | ESCC | 8.73e-58 | 9.58e-01 | 0.1666 |
| 57019 | CIAPIN1 | P36T-E | Human | Esophagus | ESCC | 1.72e-19 | 5.36e-01 | 0.1187 |
| 57019 | CIAPIN1 | P37T-E | Human | Esophagus | ESCC | 3.85e-18 | 4.34e-01 | 0.1371 |
| 57019 | CIAPIN1 | P38T-E | Human | Esophagus | ESCC | 4.87e-14 | 7.08e-01 | 0.127 |
| 57019 | CIAPIN1 | P39T-E | Human | Esophagus | ESCC | 2.63e-14 | 2.73e-01 | 0.0894 |
| 57019 | CIAPIN1 | P40T-E | Human | Esophagus | ESCC | 2.28e-09 | 3.10e-01 | 0.109 |
| 57019 | CIAPIN1 | P42T-E | Human | Esophagus | ESCC | 3.69e-29 | 7.01e-01 | 0.1175 |
| 57019 | CIAPIN1 | P44T-E | Human | Esophagus | ESCC | 2.76e-11 | 3.72e-01 | 0.1096 |
| Page: 1 2 3 4 5 6 |
| Tissue | Expression Dynamics | Abbreviation |
| Esophagus | 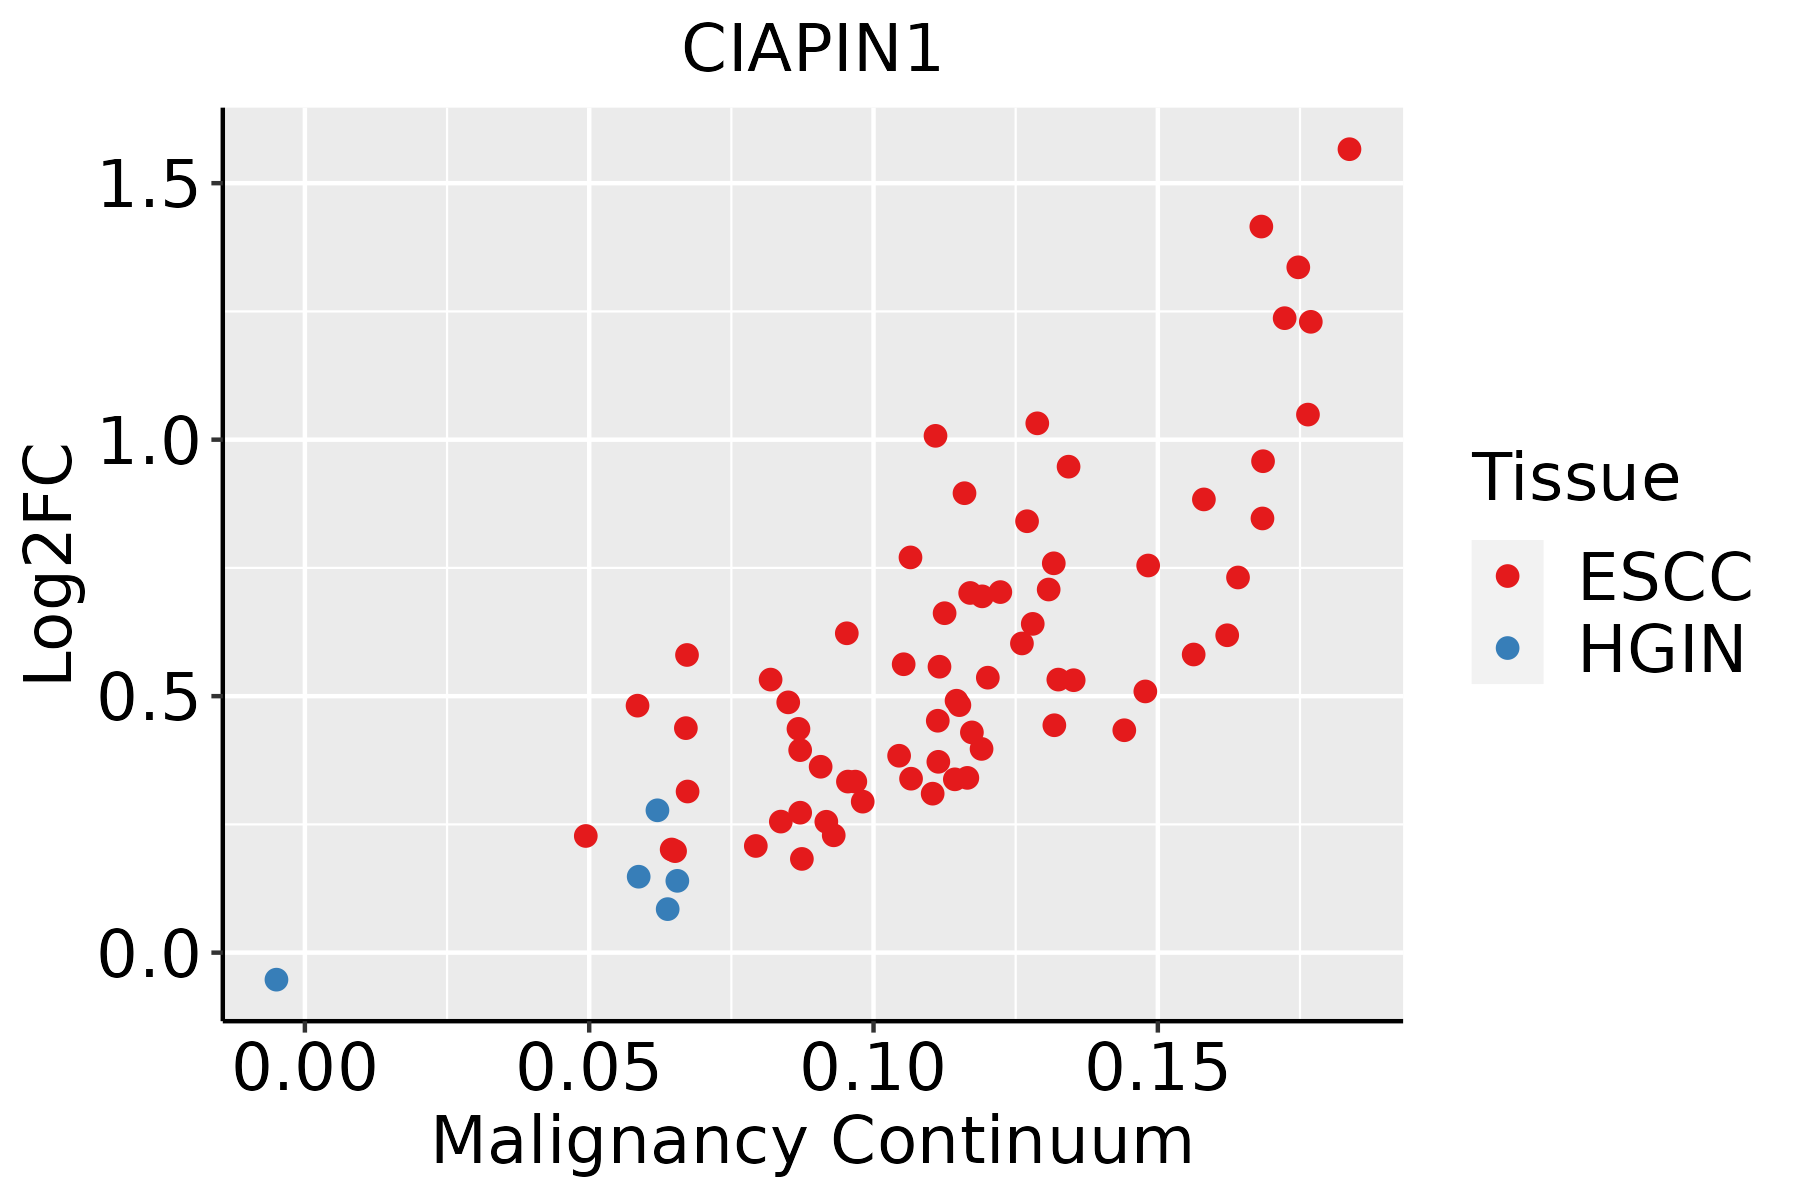 | ESCC: Esophageal squamous cell carcinoma |
| HGIN: High-grade intraepithelial neoplasias | ||
| LGIN: Low-grade intraepithelial neoplasias | ||
| Liver | 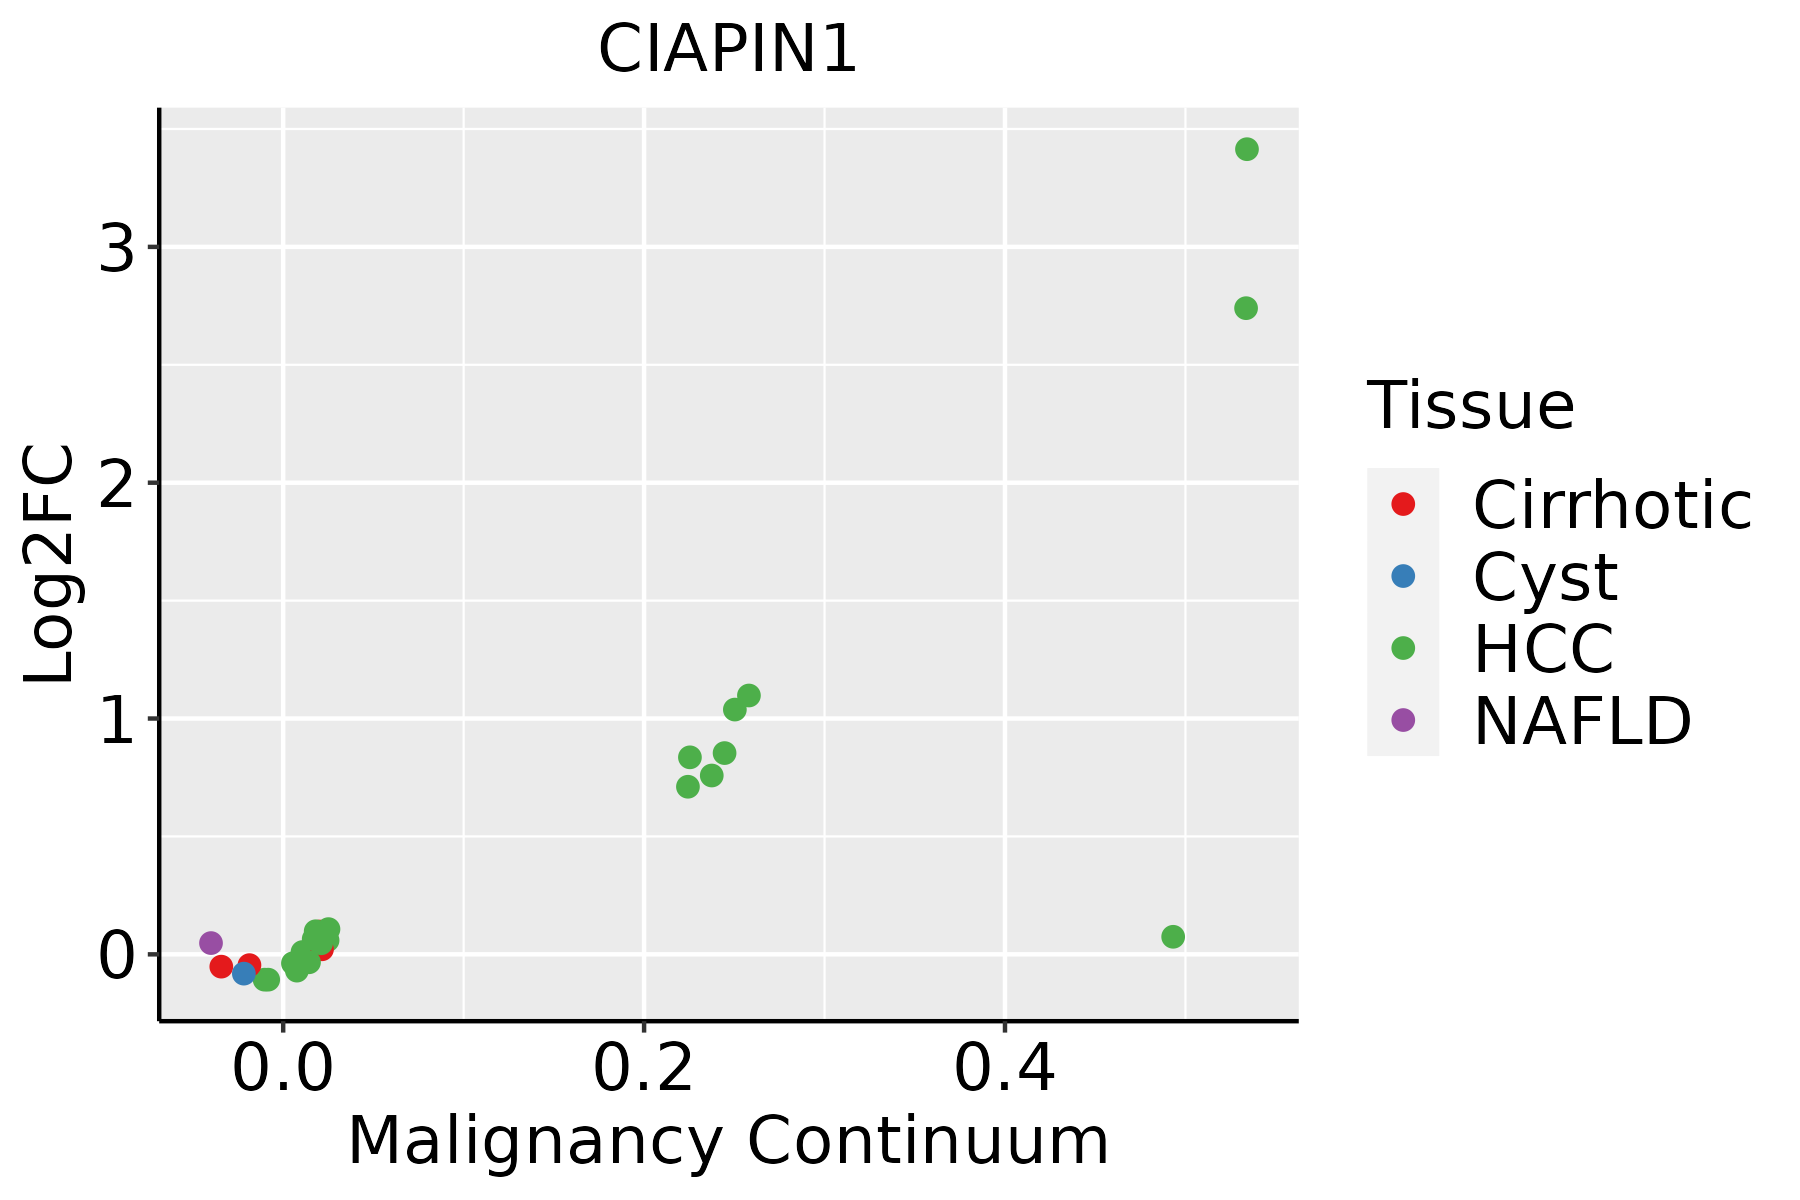 | HCC: Hepatocellular carcinoma |
| NAFLD: Non-alcoholic fatty liver disease | ||
| Oral Cavity | 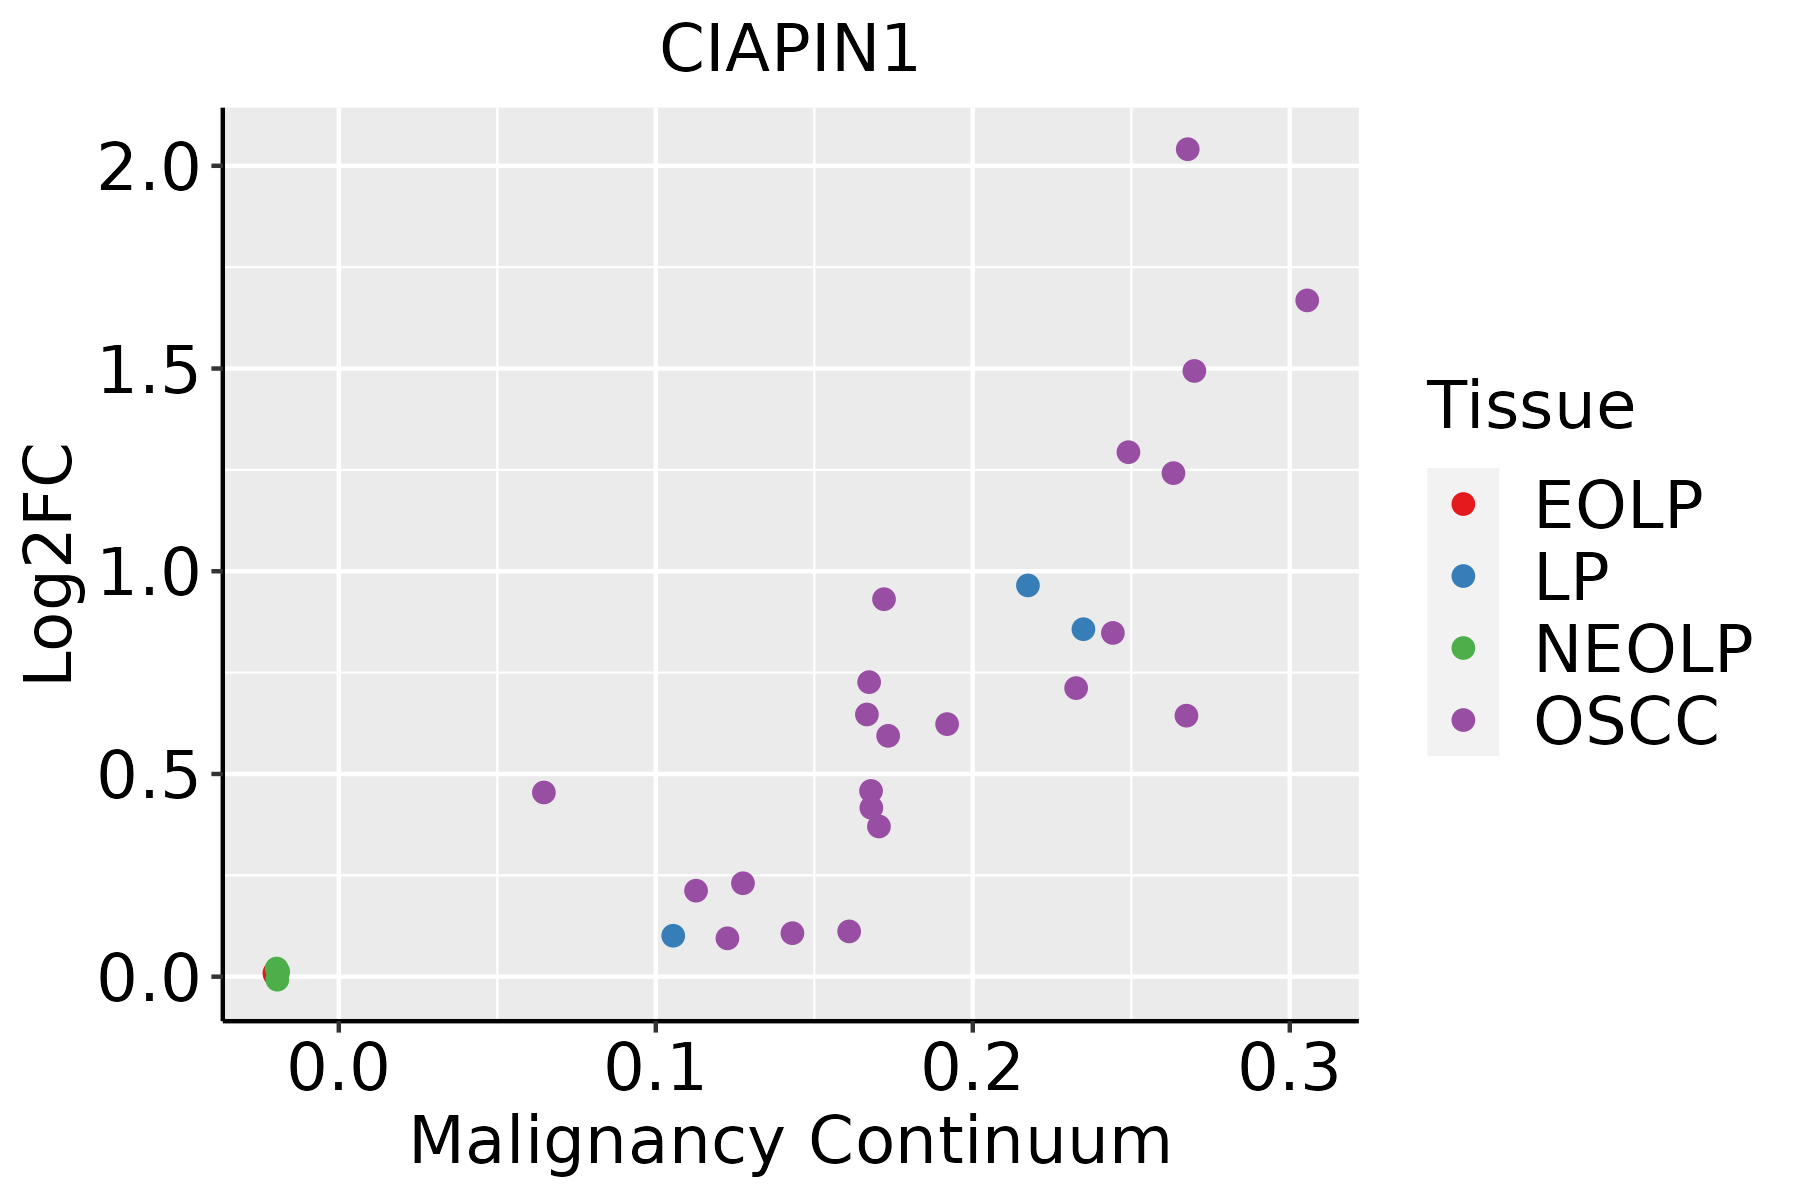 | EOLP: Erosive Oral lichen planus |
| LP: leukoplakia | ||
| NEOLP: Non-erosive oral lichen planus | ||
| OSCC: Oral squamous cell carcinoma | ||
| Skin | 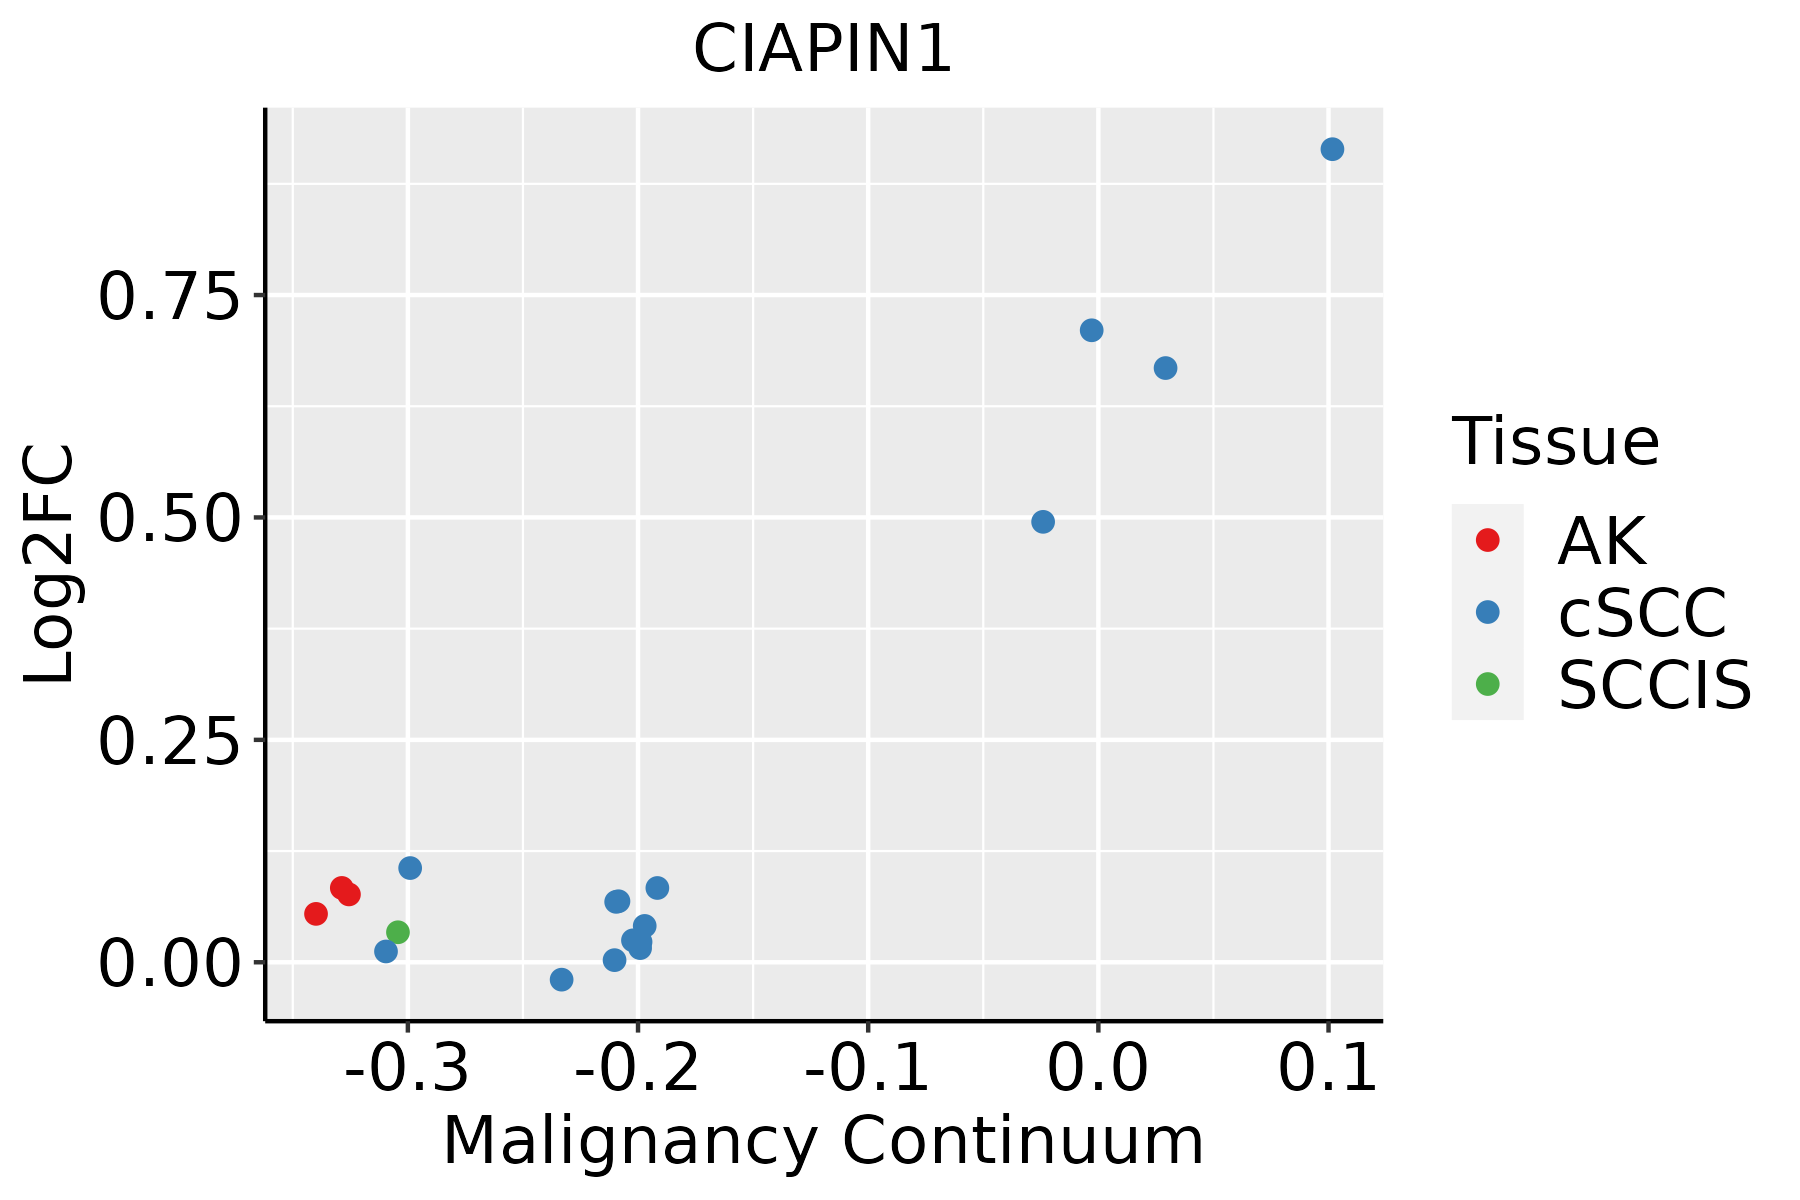 | AK: Actinic keratosis |
| cSCC: Cutaneous squamous cell carcinoma | ||
| SCCIS:squamous cell carcinoma in situ |
| ∗log2FC in expression of this searched gene in stem-like cells from each diseased tissue sample relative to stem-like cells in normal samples in each tissue plotted against the malignancy continuum. Samples are colored based on if they are from different disease stage. |
Top |
Malignant transformation related pathway analysis |
| Find out the enriched GO biological processes and KEGG pathways involved in transition from healthy to precancer to cancer |
| Tissue | Disease Stage | Enriched GO biological Processes |
| Colorectum | AD |  |
| Colorectum | SER |  |
| Colorectum | MSS |  |
| Colorectum | MSI-H |  |
| Colorectum | FAP |  |
| ∗Top 15 enriched GO BP terms are showed in the bar plot of each disease state in each tissue. Each row represents a significant GO biological process which is colored according to the -log10(p.adjust). |
| Page: 1 2 3 4 5 6 7 8 9 |
| GO ID | Tissue | Disease Stage | Description | Gene Ratio | Bg Ratio | pvalue | p.adjust | Count |
| GO:000609120 | Esophagus | HGIN | generation of precursor metabolites and energy | 145/2587 | 490/18723 | 3.41e-20 | 2.04e-17 | 145 |
| GO:002290020 | Esophagus | HGIN | electron transport chain | 66/2587 | 175/18723 | 2.21e-15 | 4.73e-13 | 66 |
| GO:00162263 | Esophagus | HGIN | iron-sulfur cluster assembly | 10/2587 | 26/18723 | 1.60e-03 | 1.79e-02 | 10 |
| GO:00311633 | Esophagus | HGIN | metallo-sulfur cluster assembly | 10/2587 | 26/18723 | 1.60e-03 | 1.79e-02 | 10 |
| GO:0006091110 | Esophagus | ESCC | generation of precursor metabolites and energy | 331/8552 | 490/18723 | 3.86e-23 | 8.45e-21 | 331 |
| GO:0022900110 | Esophagus | ESCC | electron transport chain | 133/8552 | 175/18723 | 2.18e-16 | 1.67e-14 | 133 |
| GO:00067906 | Esophagus | ESCC | sulfur compound metabolic process | 201/8552 | 339/18723 | 2.64e-07 | 3.94e-06 | 201 |
| GO:001622611 | Esophagus | ESCC | iron-sulfur cluster assembly | 21/8552 | 26/18723 | 2.69e-04 | 1.63e-03 | 21 |
| GO:003116311 | Esophagus | ESCC | metallo-sulfur cluster assembly | 21/8552 | 26/18723 | 2.69e-04 | 1.63e-03 | 21 |
| GO:000609122 | Liver | HCC | generation of precursor metabolites and energy | 340/7958 | 490/18723 | 4.04e-34 | 2.85e-31 | 340 |
| GO:002290022 | Liver | HCC | electron transport chain | 134/7958 | 175/18723 | 3.32e-20 | 4.68e-18 | 134 |
| GO:000679021 | Liver | HCC | sulfur compound metabolic process | 212/7958 | 339/18723 | 5.60e-14 | 3.39e-12 | 212 |
| GO:0016226 | Liver | HCC | iron-sulfur cluster assembly | 18/7958 | 26/18723 | 5.37e-03 | 2.24e-02 | 18 |
| GO:0031163 | Liver | HCC | metallo-sulfur cluster assembly | 18/7958 | 26/18723 | 5.37e-03 | 2.24e-02 | 18 |
| GO:002290018 | Oral cavity | OSCC | electron transport chain | 126/7305 | 175/18723 | 6.65e-19 | 8.42e-17 | 126 |
| GO:000609118 | Oral cavity | OSCC | generation of precursor metabolites and energy | 286/7305 | 490/18723 | 1.45e-18 | 1.71e-16 | 286 |
| GO:00067905 | Oral cavity | OSCC | sulfur compound metabolic process | 168/7305 | 339/18723 | 4.50e-05 | 3.84e-04 | 168 |
| GO:00162262 | Oral cavity | OSCC | iron-sulfur cluster assembly | 19/7305 | 26/18723 | 4.46e-04 | 2.70e-03 | 19 |
| GO:00311632 | Oral cavity | OSCC | metallo-sulfur cluster assembly | 19/7305 | 26/18723 | 4.46e-04 | 2.70e-03 | 19 |
| GO:002290019 | Oral cavity | LP | electron transport chain | 108/4623 | 175/18723 | 2.21e-25 | 9.90e-23 | 108 |
| Page: 1 2 |
| Pathway ID | Tissue | Disease Stage | Description | Gene Ratio | Bg Ratio | pvalue | p.adjust | qvalue | Count |
| Page: 1 |
Top |
Cell-cell communication analysis |
| Identification of potential cell-cell interactions between two cell types and their ligand-receptor pairs for different disease states |
| Ligand | Receptor | LRpair | Pathway | Tissue | Disease Stage |
| Page: 1 |
Top |
Single-cell gene regulatory network inference analysis |
| Find out the significant the regulons (TFs) and the target genes of each regulon across cell types for different disease states |
| TF | Cell Type | Tissue | Disease Stage | Target Gene | RSS | Regulon Activity |
| ∗The dot plots of a searched regulon are shown for all cell subpopulations in each disease state of each tissue based on the regulon specific score inferred using pySCENIC and by calculating the average expression. |
| Page: 1 |
Top |
Somatic mutation of malignant transformation related genes |
| Annotation of somatic variants for genes involved in malignant transformation |
| Hugo Symbol | Variant Class | Variant Classification | dbSNP RS | HGVSc | HGVSp | HGVSp Short | SWISSPROT | BIOTYPE | SIFT | PolyPhen | Tumor Sample Barcode | Tissue | Histology | Sex | Age | Stage | Therapy Types | Drugs | Outcome |
| CIAPIN1 | SNV | Missense_Mutation | rs745916329 | c.841N>A | p.Asp281Asn | p.D281N | Q6FI81 | protein_coding | deleterious(0.04) | probably_damaging(0.999) | TCGA-AO-A128-01 | Breast | breast invasive carcinoma | Female | <65 | I/II | Chemotherapy | doxorubicin | SD |
| CIAPIN1 | SNV | Missense_Mutation | c.412G>A | p.Glu138Lys | p.E138K | Q6FI81 | protein_coding | tolerated(0.09) | benign(0.001) | TCGA-DR-A0ZM-01 | Cervix | cervical & endocervical cancer | Female | <65 | III/IV | Unspecific | Cisplatin | SD | |
| CIAPIN1 | SNV | Missense_Mutation | novel | c.729N>T | p.Arg243Ser | p.R243S | Q6FI81 | protein_coding | deleterious(0) | benign(0.355) | TCGA-VS-A9V3-01 | Cervix | cervical & endocervical cancer | Female | <65 | I/II | Chemotherapy | cisplatin | PD |
| CIAPIN1 | SNV | Missense_Mutation | c.458N>G | p.Asn153Ser | p.N153S | Q6FI81 | protein_coding | tolerated(0.88) | benign(0) | TCGA-AA-3815-01 | Colorectum | colon adenocarcinoma | Female | >=65 | I/II | Unknown | Unknown | SD | |
| CIAPIN1 | SNV | Missense_Mutation | c.732N>T | p.Lys244Asn | p.K244N | Q6FI81 | protein_coding | deleterious(0) | possibly_damaging(0.575) | TCGA-G4-6304-01 | Colorectum | colon adenocarcinoma | Female | >=65 | I/II | Chemotherapy | fluorouracil | PD | |
| CIAPIN1 | SNV | Missense_Mutation | rs562918898 | c.697C>T | p.Arg233Trp | p.R233W | Q6FI81 | protein_coding | tolerated(0.09) | benign(0.058) | TCGA-WS-AB45-01 | Colorectum | colon adenocarcinoma | Female | <65 | I/II | Unknown | Unknown | SD |
| CIAPIN1 | SNV | Missense_Mutation | novel | c.512N>A | p.Ser171Tyr | p.S171Y | Q6FI81 | protein_coding | deleterious(0) | possibly_damaging(0.871) | TCGA-A5-A0G1-01 | Endometrium | uterine corpus endometrioid carcinoma | Female | >=65 | I/II | Unknown | Unknown | SD |
| CIAPIN1 | SNV | Missense_Mutation | novel | c.323N>G | p.Lys108Arg | p.K108R | Q6FI81 | protein_coding | tolerated(0.28) | benign(0) | TCGA-AJ-A3EK-01 | Endometrium | uterine corpus endometrioid carcinoma | Female | <65 | I/II | Chemotherapy | carboplatin | CR |
| CIAPIN1 | SNV | Missense_Mutation | novel | c.69G>T | p.Glu23Asp | p.E23D | Q6FI81 | protein_coding | tolerated(0.19) | benign(0) | TCGA-AP-A051-01 | Endometrium | uterine corpus endometrioid carcinoma | Female | >=65 | I/II | Unknown | Unknown | SD |
| CIAPIN1 | SNV | Missense_Mutation | novel | c.302N>T | p.Thr101Ile | p.T101I | Q6FI81 | protein_coding | deleterious(0.04) | possibly_damaging(0.74) | TCGA-AX-A1CE-01 | Endometrium | uterine corpus endometrioid carcinoma | Female | <65 | I/II | Unspecific | Paclitaxel | SD |
| Page: 1 2 |
Top |
Related drugs of malignant transformation related genes |
| Identification of chemicals and drugs interact with genes involved in malignant transfromation |
| (DGIdb 4.0) |
| Entrez ID | Symbol | Category | Interaction Types | Drug Claim Name | Drug Name | PMIDs |
| Page: 1 |

Copyright 2023-Present -The University of Texas Health Science Center at Houston |