
|
|||||
|
 | |
| |
| |
| |
| |
| |
|
Gene: CHMP4A |
Gene summary for CHMP4A |
| Gene information | Species | Human | Gene symbol | CHMP4A | Gene ID | 29082 |
| Gene name | charged multivesicular body protein 4A | |
| Gene Alias | C14orf123 | |
| Cytomap | 14q12 | |
| Gene Type | protein-coding | GO ID | GO:0000045 | UniProtAcc | Q9BY43 |
Top |
Malignant transformation analysis |
| Identification of the aberrant gene expression in precancerous and cancerous lesions by comparing the gene expression of stem-like cells in diseased tissues with normal stem cells |
| Entrez ID | Symbol | Replicates | Species | Organ | Tissue | Adj P-value | Log2FC | Malignancy |
| 29082 | CHMP4A | P15T-E | Human | Esophagus | ESCC | 8.06e-59 | 1.14e+00 | 0.1149 |
| 29082 | CHMP4A | P16T-E | Human | Esophagus | ESCC | 2.42e-10 | 2.15e-01 | 0.1153 |
| 29082 | CHMP4A | P17T-E | Human | Esophagus | ESCC | 5.13e-17 | 7.45e-01 | 0.1278 |
| 29082 | CHMP4A | P19T-E | Human | Esophagus | ESCC | 7.62e-12 | 7.20e-01 | 0.1662 |
| 29082 | CHMP4A | P20T-E | Human | Esophagus | ESCC | 4.39e-20 | 4.59e-01 | 0.1124 |
| 29082 | CHMP4A | P21T-E | Human | Esophagus | ESCC | 2.74e-31 | 5.74e-01 | 0.1617 |
| 29082 | CHMP4A | P22T-E | Human | Esophagus | ESCC | 2.93e-37 | 6.28e-01 | 0.1236 |
| 29082 | CHMP4A | P23T-E | Human | Esophagus | ESCC | 1.61e-29 | 6.84e-01 | 0.108 |
| 29082 | CHMP4A | P24T-E | Human | Esophagus | ESCC | 2.26e-28 | 6.68e-01 | 0.1287 |
| 29082 | CHMP4A | P26T-E | Human | Esophagus | ESCC | 1.96e-31 | 5.17e-01 | 0.1276 |
| 29082 | CHMP4A | P27T-E | Human | Esophagus | ESCC | 1.80e-34 | 7.89e-01 | 0.1055 |
| 29082 | CHMP4A | P28T-E | Human | Esophagus | ESCC | 2.40e-37 | 7.51e-01 | 0.1149 |
| 29082 | CHMP4A | P30T-E | Human | Esophagus | ESCC | 1.21e-32 | 9.20e-01 | 0.137 |
| 29082 | CHMP4A | P31T-E | Human | Esophagus | ESCC | 3.53e-40 | 6.11e-01 | 0.1251 |
| 29082 | CHMP4A | P32T-E | Human | Esophagus | ESCC | 1.08e-37 | 6.18e-01 | 0.1666 |
| 29082 | CHMP4A | P36T-E | Human | Esophagus | ESCC | 5.58e-12 | 4.56e-01 | 0.1187 |
| 29082 | CHMP4A | P37T-E | Human | Esophagus | ESCC | 1.01e-31 | 7.04e-01 | 0.1371 |
| 29082 | CHMP4A | P38T-E | Human | Esophagus | ESCC | 2.38e-12 | 4.49e-01 | 0.127 |
| 29082 | CHMP4A | P39T-E | Human | Esophagus | ESCC | 2.99e-30 | 5.36e-01 | 0.0894 |
| 29082 | CHMP4A | P40T-E | Human | Esophagus | ESCC | 2.19e-12 | 4.16e-01 | 0.109 |
| Page: 1 2 3 4 5 6 7 8 |
| Tissue | Expression Dynamics | Abbreviation |
| Esophagus | 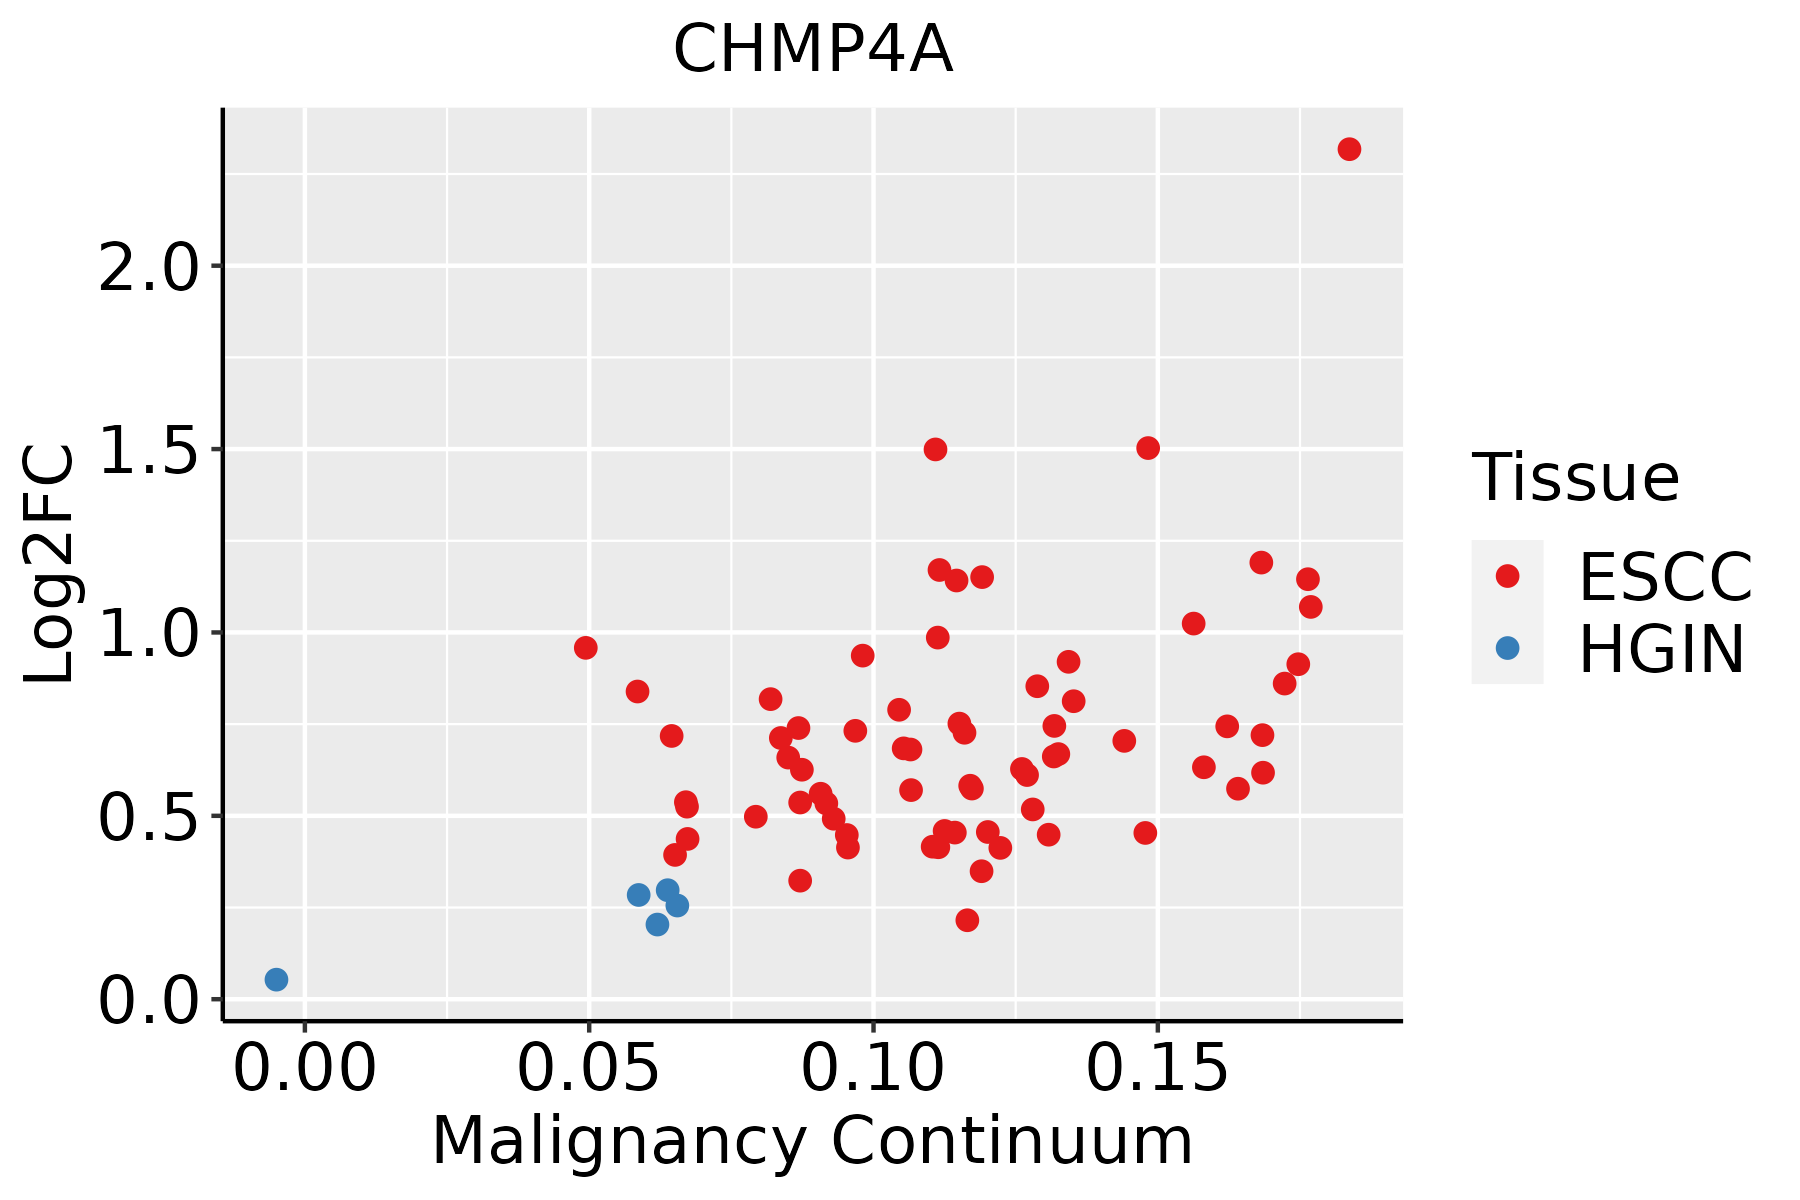 | ESCC: Esophageal squamous cell carcinoma |
| HGIN: High-grade intraepithelial neoplasias | ||
| LGIN: Low-grade intraepithelial neoplasias | ||
| GC | 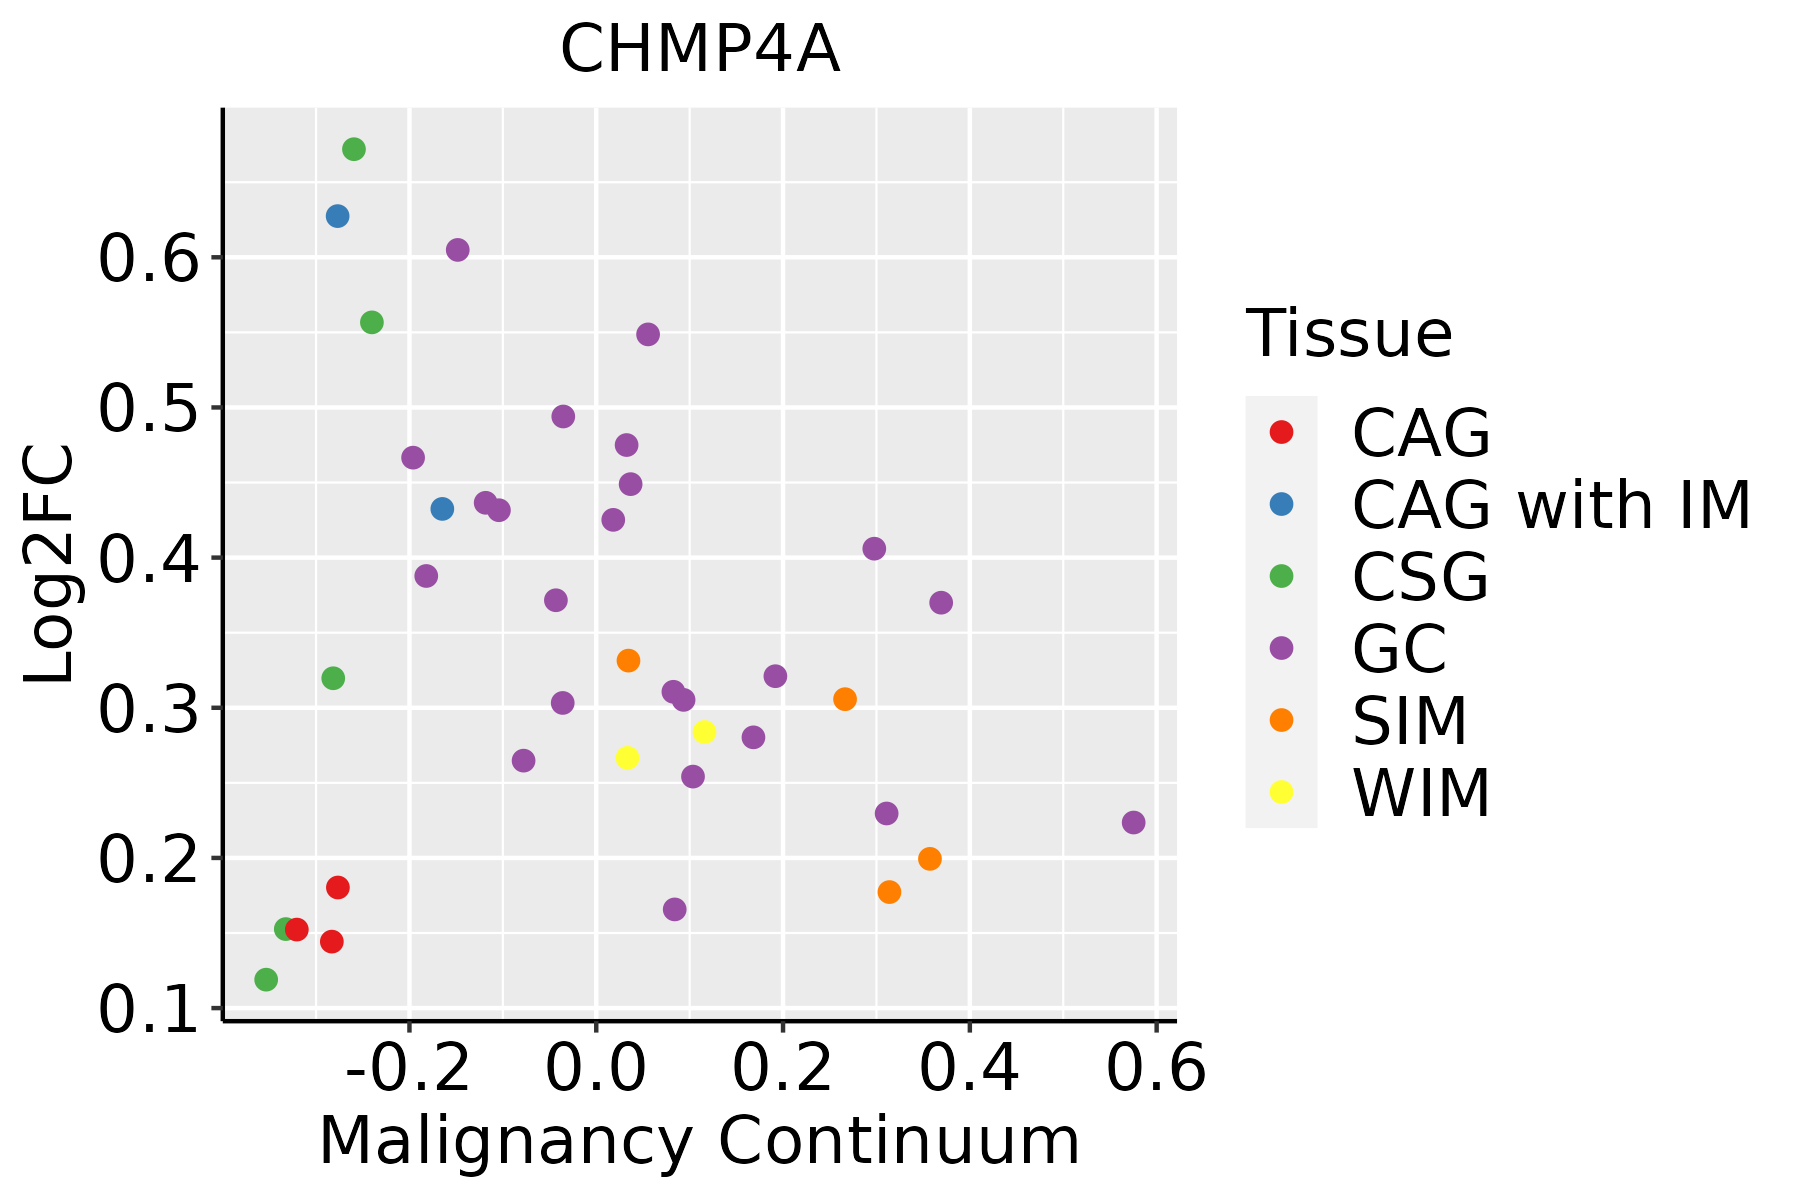 | CAG: Chronic atrophic gastritis |
| CAG with IM: Chronic atrophic gastritis with intestinal metaplasia | ||
| CSG: Chronic superficial gastritis | ||
| GC: Gastric cancer | ||
| SIM: Severe intestinal metaplasia | ||
| WIM: Wild intestinal metaplasia | ||
| Liver | 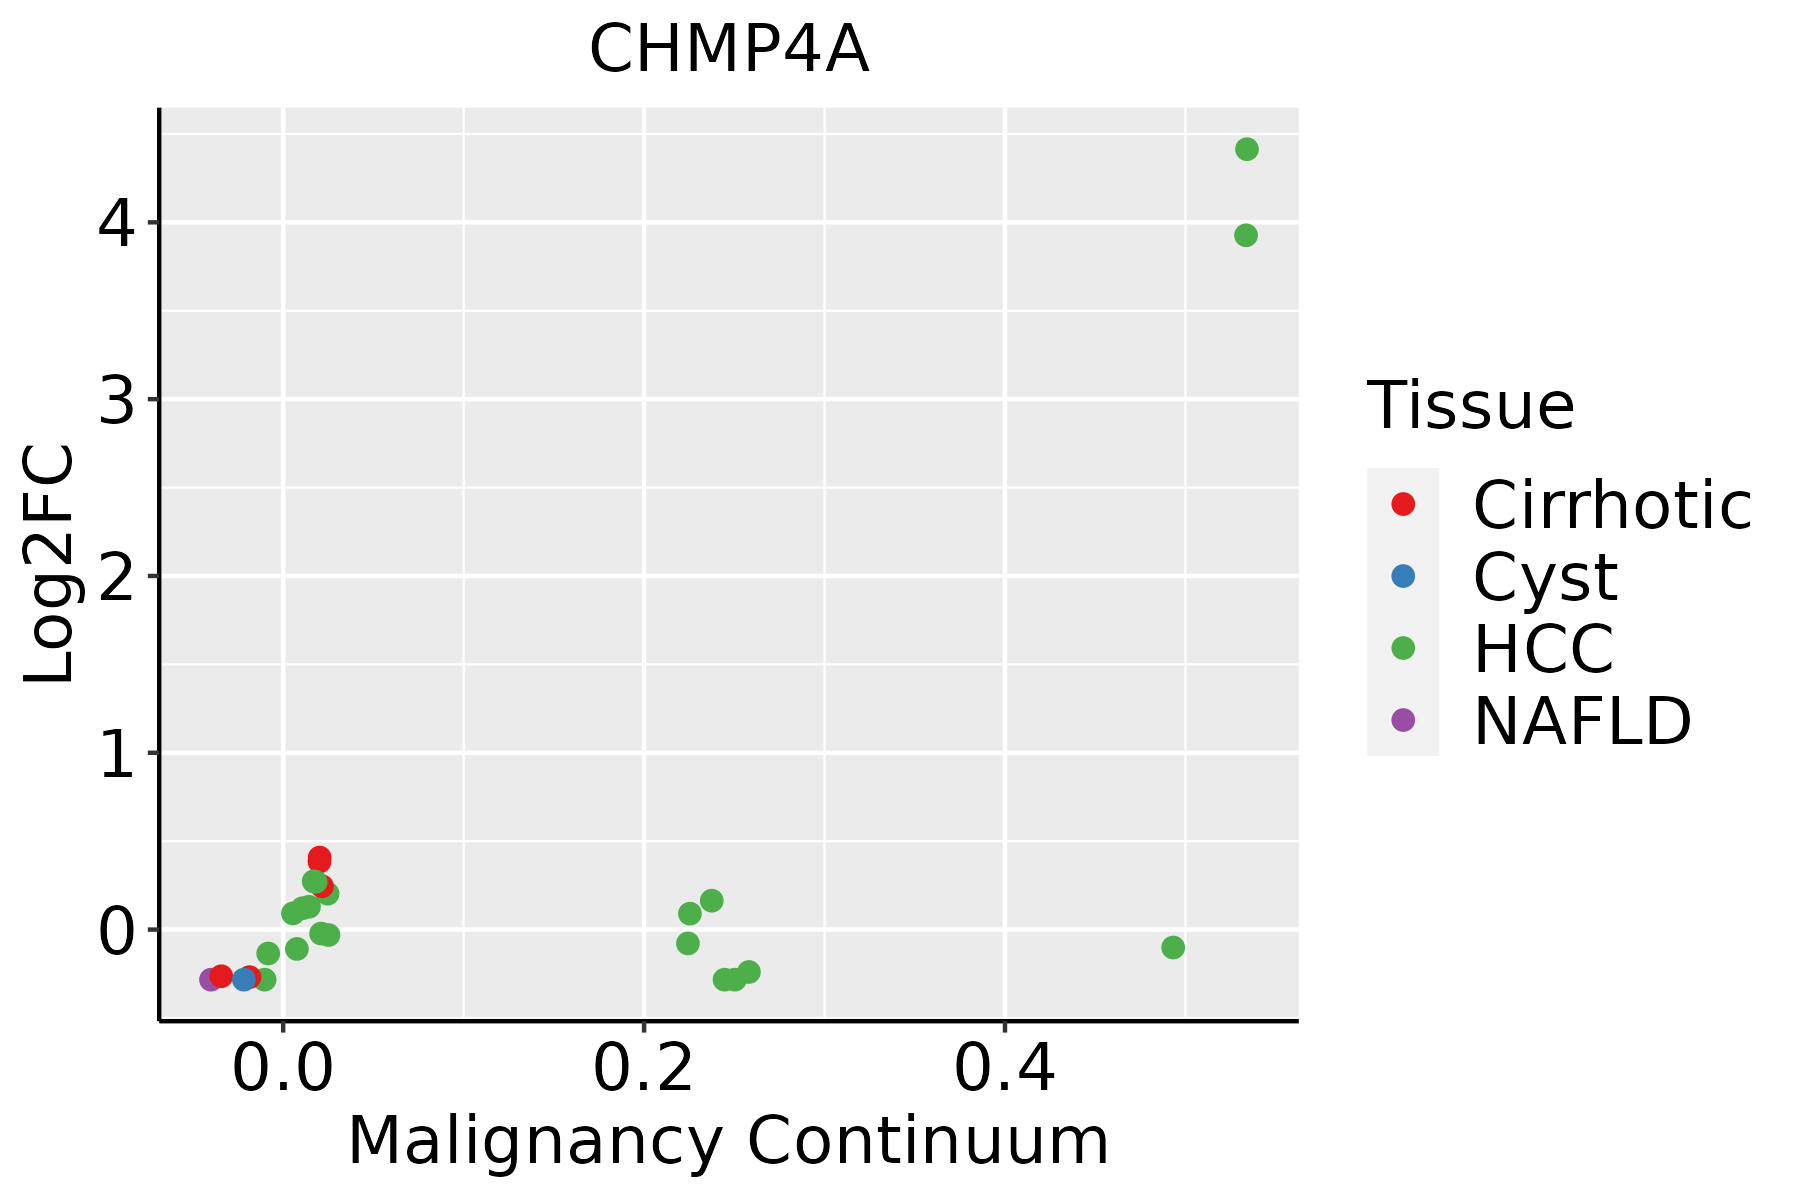 | HCC: Hepatocellular carcinoma |
| NAFLD: Non-alcoholic fatty liver disease | ||
| Oral Cavity | 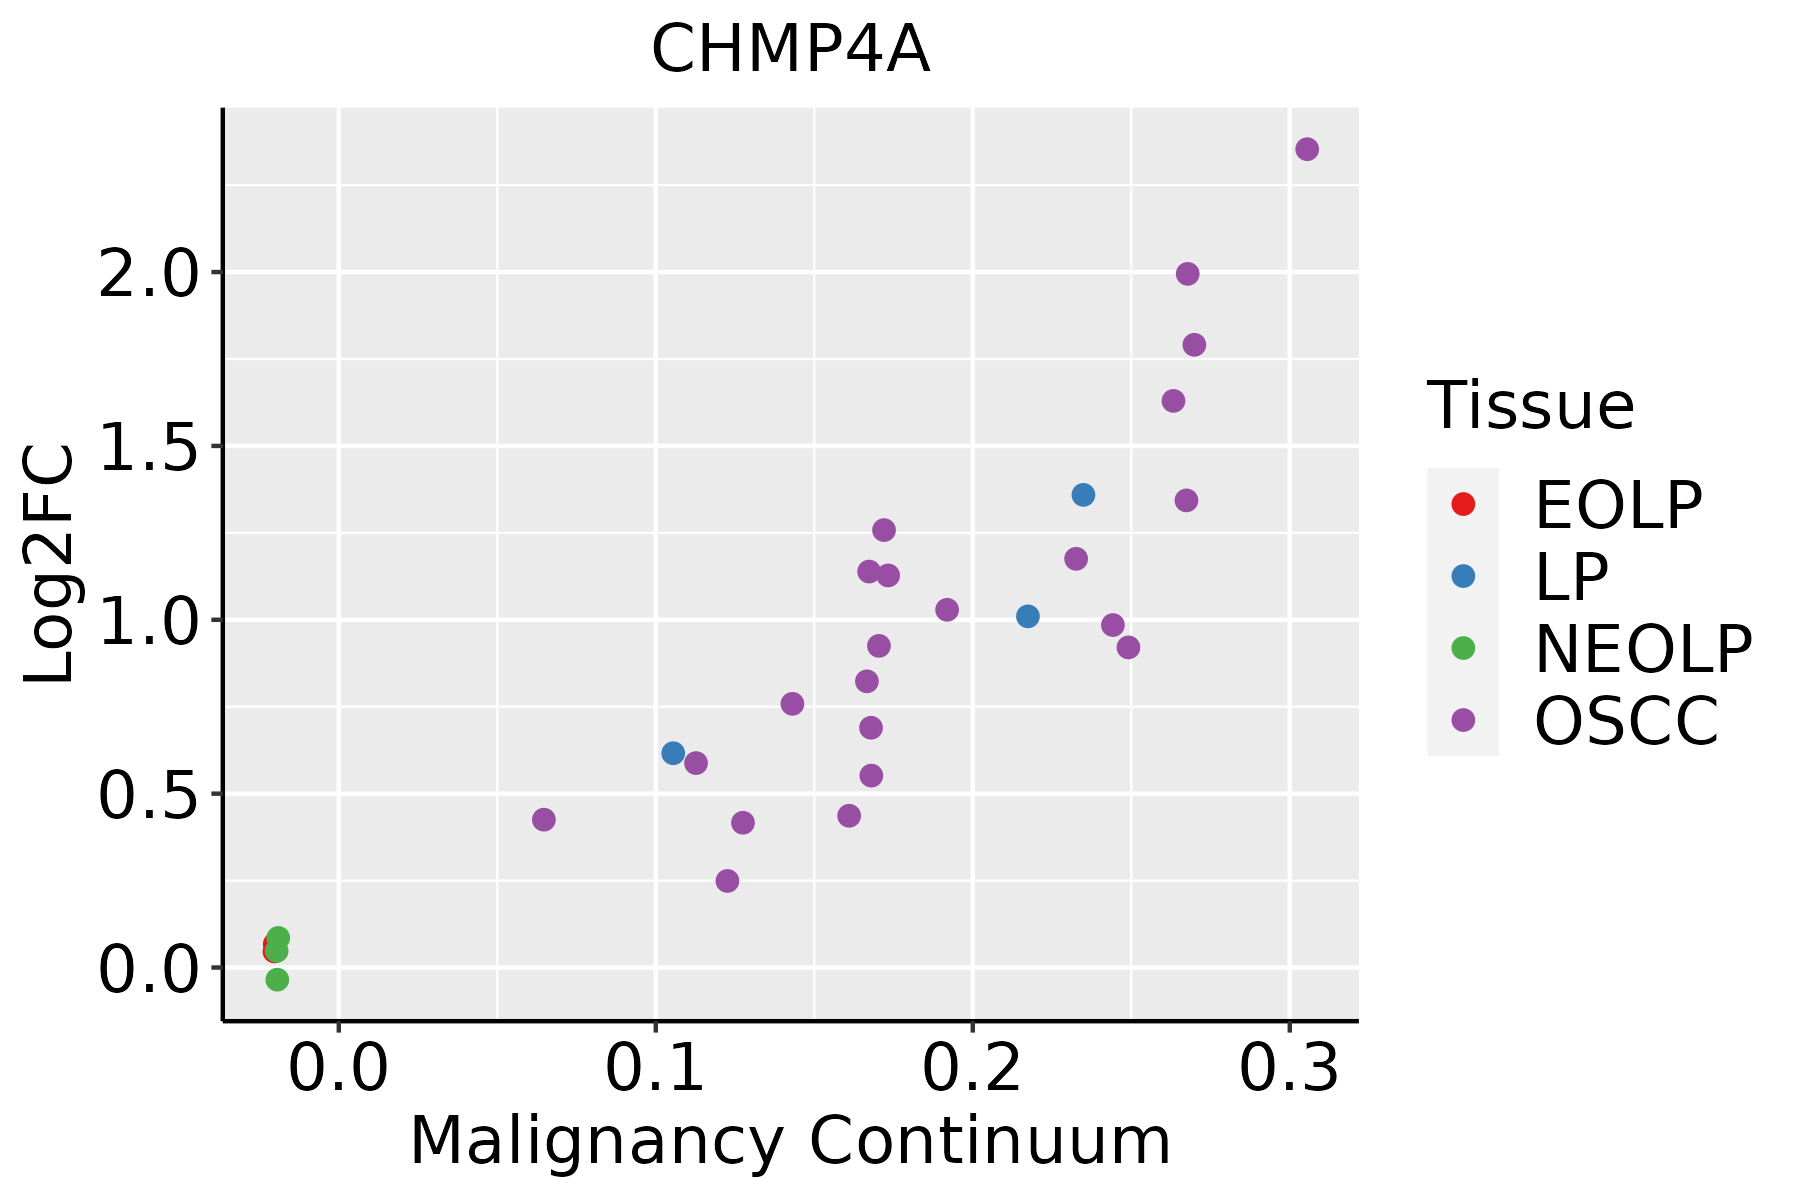 | EOLP: Erosive Oral lichen planus |
| LP: leukoplakia | ||
| NEOLP: Non-erosive oral lichen planus | ||
| OSCC: Oral squamous cell carcinoma | ||
| Skin | 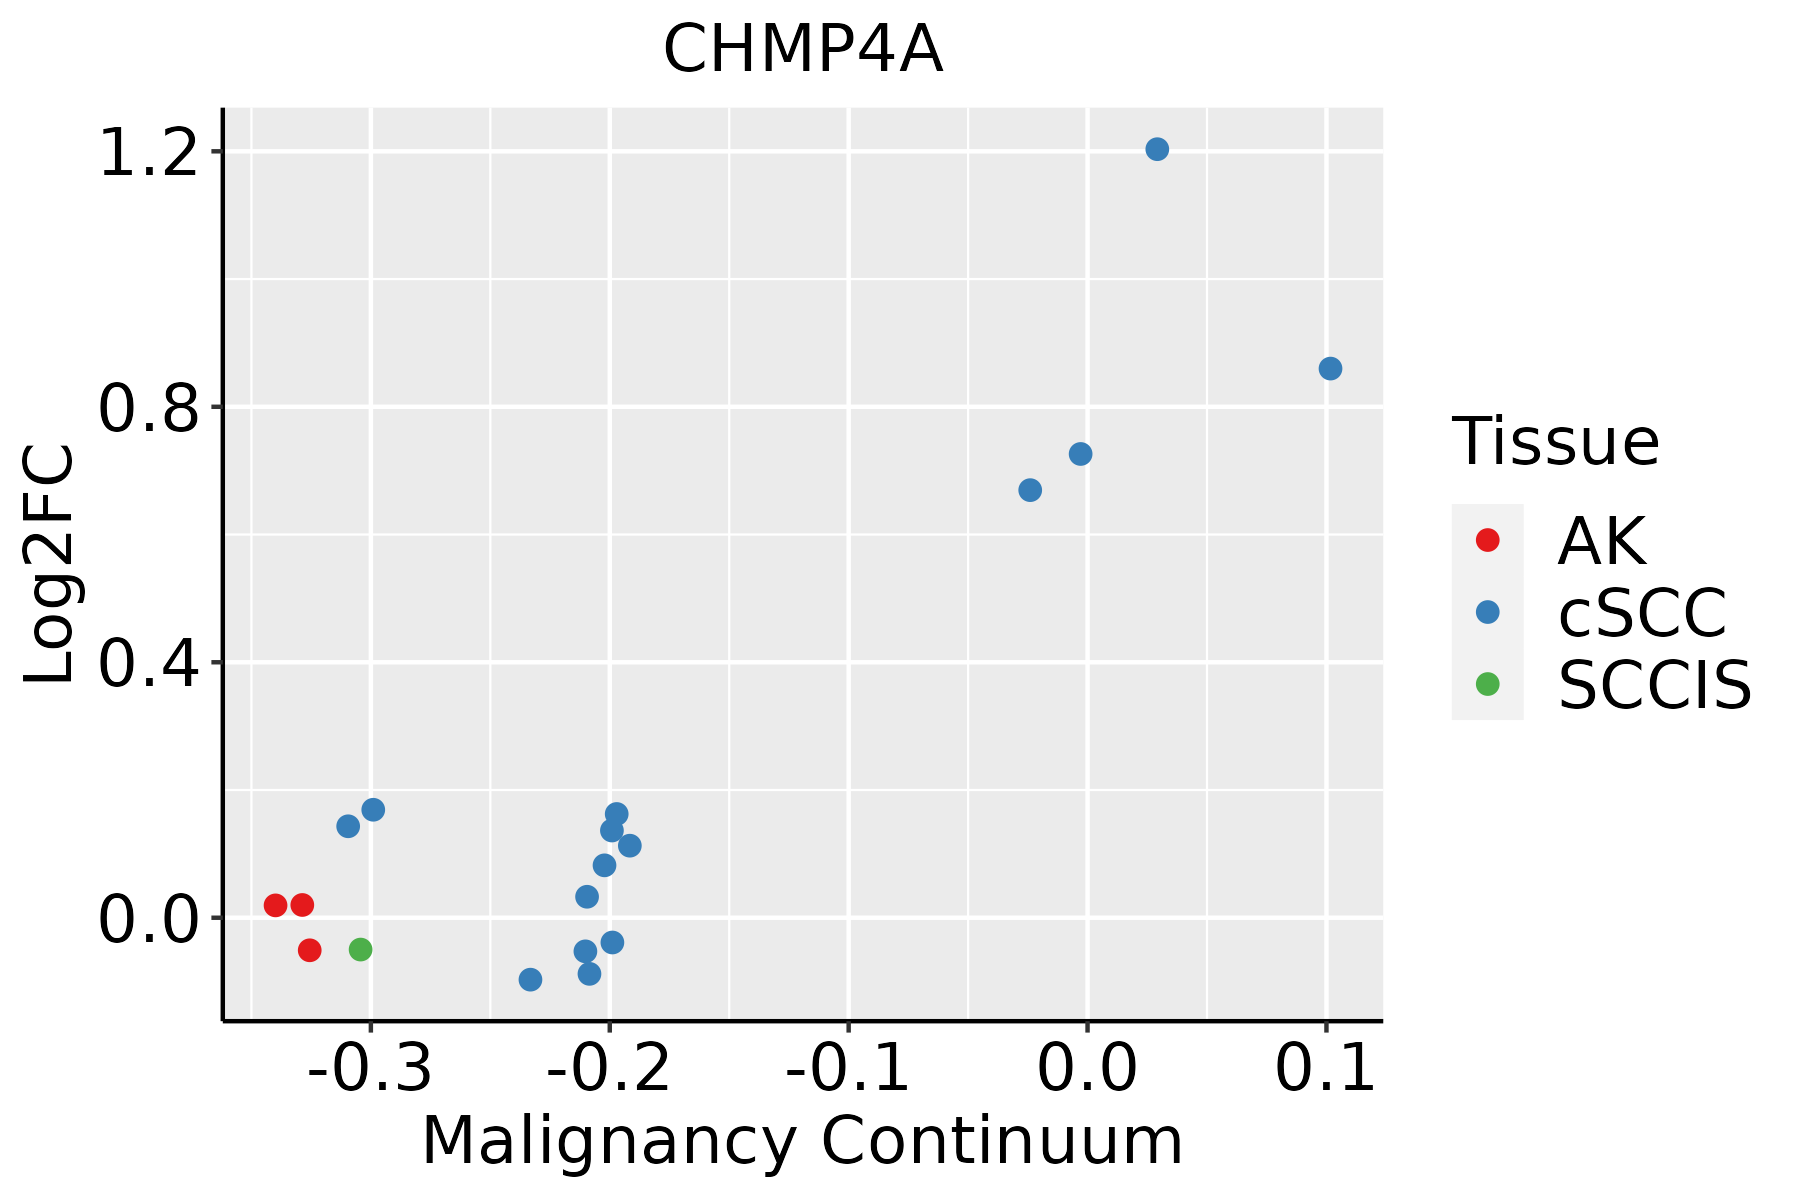 | AK: Actinic keratosis |
| cSCC: Cutaneous squamous cell carcinoma | ||
| SCCIS:squamous cell carcinoma in situ | ||
| Thyroid | 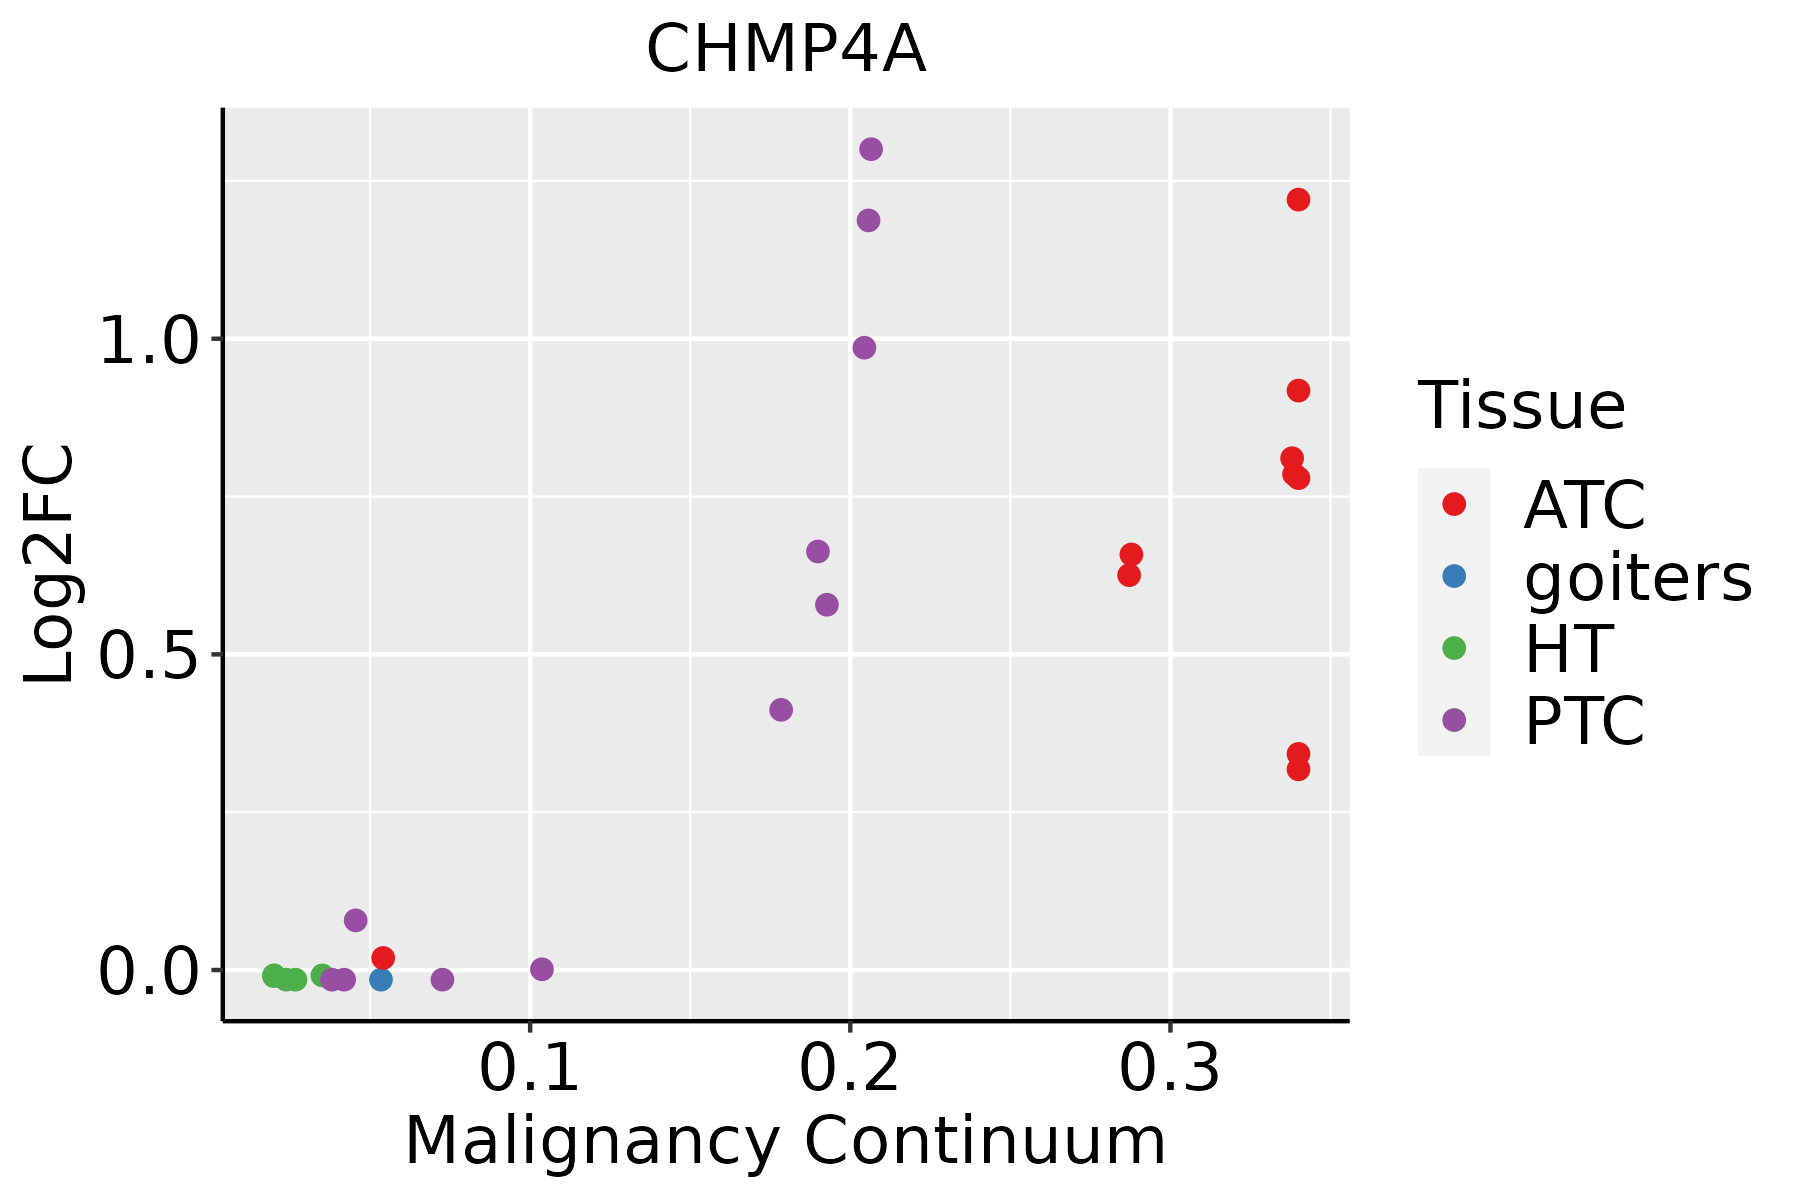 | ATC: Anaplastic thyroid cancer |
| HT: Hashimoto's thyroiditis | ||
| PTC: Papillary thyroid cancer |
| ∗log2FC in expression of this searched gene in stem-like cells from each diseased tissue sample relative to stem-like cells in normal samples in each tissue plotted against the malignancy continuum. Samples are colored based on if they are from different disease stage. |
Top |
Malignant transformation related pathway analysis |
| Find out the enriched GO biological processes and KEGG pathways involved in transition from healthy to precancer to cancer |
| Tissue | Disease Stage | Enriched GO biological Processes |
| Colorectum | AD |  |
| Colorectum | SER |  |
| Colorectum | MSS |  |
| Colorectum | MSI-H |  |
| Colorectum | FAP |  |
| ∗Top 15 enriched GO BP terms are showed in the bar plot of each disease state in each tissue. Each row represents a significant GO biological process which is colored according to the -log10(p.adjust). |
| Page: 1 2 3 4 5 6 7 8 9 |
| GO ID | Tissue | Disease Stage | Description | Gene Ratio | Bg Ratio | pvalue | p.adjust | Count |
| GO:007259420 | Esophagus | HGIN | establishment of protein localization to organelle | 120/2587 | 422/18723 | 1.73e-15 | 4.00e-13 | 120 |
| GO:001603227 | Esophagus | HGIN | viral process | 118/2587 | 415/18723 | 3.01e-15 | 6.22e-13 | 118 |
| GO:001905827 | Esophagus | HGIN | viral life cycle | 93/2587 | 317/18723 | 3.66e-13 | 5.63e-11 | 93 |
| GO:000989520 | Esophagus | HGIN | negative regulation of catabolic process | 87/2587 | 320/18723 | 1.74e-10 | 1.68e-08 | 87 |
| GO:003133026 | Esophagus | HGIN | negative regulation of cellular catabolic process | 74/2587 | 262/18723 | 6.27e-10 | 5.30e-08 | 74 |
| GO:001050616 | Esophagus | HGIN | regulation of autophagy | 84/2587 | 317/18723 | 1.39e-09 | 1.08e-07 | 84 |
| GO:001623616 | Esophagus | HGIN | macroautophagy | 77/2587 | 291/18723 | 7.15e-09 | 4.61e-07 | 77 |
| GO:000660525 | Esophagus | HGIN | protein targeting | 78/2587 | 314/18723 | 1.08e-07 | 5.47e-06 | 78 |
| GO:009015020 | Esophagus | HGIN | establishment of protein localization to membrane | 67/2587 | 260/18723 | 1.96e-07 | 9.57e-06 | 67 |
| GO:005165616 | Esophagus | HGIN | establishment of organelle localization | 90/2587 | 390/18723 | 4.27e-07 | 1.94e-05 | 90 |
| GO:000690020 | Esophagus | HGIN | vesicle budding from membrane | 23/2587 | 61/18723 | 2.85e-06 | 9.93e-05 | 23 |
| GO:007097210 | Esophagus | HGIN | protein localization to endoplasmic reticulum | 26/2587 | 74/18723 | 3.09e-06 | 1.05e-04 | 26 |
| GO:001063920 | Esophagus | HGIN | negative regulation of organelle organization | 79/2587 | 348/18723 | 4.12e-06 | 1.37e-04 | 79 |
| GO:007099727 | Esophagus | HGIN | neuron death | 81/2587 | 361/18723 | 5.01e-06 | 1.61e-04 | 81 |
| GO:001619710 | Esophagus | HGIN | endosomal transport | 57/2587 | 230/18723 | 5.74e-06 | 1.81e-04 | 57 |
| GO:00105076 | Esophagus | HGIN | negative regulation of autophagy | 27/2587 | 85/18723 | 1.72e-05 | 4.71e-04 | 27 |
| GO:00162418 | Esophagus | HGIN | regulation of macroautophagy | 38/2587 | 141/18723 | 2.80e-05 | 7.21e-04 | 38 |
| GO:000091015 | Esophagus | HGIN | cytokinesis | 44/2587 | 173/18723 | 3.26e-05 | 8.32e-04 | 44 |
| GO:19021156 | Esophagus | HGIN | regulation of organelle assembly | 46/2587 | 186/18723 | 4.63e-05 | 1.12e-03 | 46 |
| GO:005125826 | Esophagus | HGIN | protein polymerization | 66/2587 | 297/18723 | 4.96e-05 | 1.19e-03 | 66 |
| Page: 1 2 3 4 5 6 7 8 9 10 11 12 13 14 15 16 17 18 19 20 21 22 23 24 25 26 27 28 29 30 31 |
| Pathway ID | Tissue | Disease Stage | Description | Gene Ratio | Bg Ratio | pvalue | p.adjust | qvalue | Count |
| hsa0414429 | Esophagus | HGIN | Endocytosis | 76/1383 | 251/8465 | 1.74e-08 | 3.34e-07 | 2.65e-07 | 76 |
| hsa04144113 | Esophagus | HGIN | Endocytosis | 76/1383 | 251/8465 | 1.74e-08 | 3.34e-07 | 2.65e-07 | 76 |
| hsa04144210 | Esophagus | ESCC | Endocytosis | 186/4205 | 251/8465 | 9.74e-16 | 4.66e-14 | 2.39e-14 | 186 |
| hsa032509 | Esophagus | ESCC | Viral life cycle - HIV-1 | 54/4205 | 63/8465 | 2.01e-09 | 2.17e-08 | 1.11e-08 | 54 |
| hsa0414437 | Esophagus | ESCC | Endocytosis | 186/4205 | 251/8465 | 9.74e-16 | 4.66e-14 | 2.39e-14 | 186 |
| hsa0325014 | Esophagus | ESCC | Viral life cycle - HIV-1 | 54/4205 | 63/8465 | 2.01e-09 | 2.17e-08 | 1.11e-08 | 54 |
| hsa0414412 | Liver | Cirrhotic | Endocytosis | 119/2530 | 251/8465 | 2.33e-09 | 4.56e-08 | 2.81e-08 | 119 |
| hsa0414413 | Liver | Cirrhotic | Endocytosis | 119/2530 | 251/8465 | 2.33e-09 | 4.56e-08 | 2.81e-08 | 119 |
| hsa0414422 | Liver | HCC | Endocytosis | 178/4020 | 251/8465 | 2.03e-14 | 5.22e-13 | 2.91e-13 | 178 |
| hsa032502 | Liver | HCC | Viral life cycle - HIV-1 | 46/4020 | 63/8465 | 3.25e-05 | 1.88e-04 | 1.04e-04 | 46 |
| hsa0414432 | Liver | HCC | Endocytosis | 178/4020 | 251/8465 | 2.03e-14 | 5.22e-13 | 2.91e-13 | 178 |
| hsa0325011 | Liver | HCC | Viral life cycle - HIV-1 | 46/4020 | 63/8465 | 3.25e-05 | 1.88e-04 | 1.04e-04 | 46 |
| hsa0414427 | Oral cavity | OSCC | Endocytosis | 174/3704 | 251/8465 | 9.42e-17 | 4.51e-15 | 2.29e-15 | 174 |
| hsa032508 | Oral cavity | OSCC | Viral life cycle - HIV-1 | 45/3704 | 63/8465 | 7.62e-06 | 3.59e-05 | 1.83e-05 | 45 |
| hsa04144112 | Oral cavity | OSCC | Endocytosis | 174/3704 | 251/8465 | 9.42e-17 | 4.51e-15 | 2.29e-15 | 174 |
| hsa0325013 | Oral cavity | OSCC | Viral life cycle - HIV-1 | 45/3704 | 63/8465 | 7.62e-06 | 3.59e-05 | 1.83e-05 | 45 |
| hsa0414428 | Oral cavity | LP | Endocytosis | 121/2418 | 251/8465 | 1.89e-11 | 3.70e-10 | 2.38e-10 | 121 |
| hsa0325022 | Oral cavity | LP | Viral life cycle - HIV-1 | 32/2418 | 63/8465 | 1.55e-04 | 9.08e-04 | 5.86e-04 | 32 |
| hsa0421714 | Oral cavity | LP | Necroptosis | 59/2418 | 159/8465 | 1.15e-02 | 3.91e-02 | 2.52e-02 | 59 |
| hsa0414436 | Oral cavity | LP | Endocytosis | 121/2418 | 251/8465 | 1.89e-11 | 3.70e-10 | 2.38e-10 | 121 |
| Page: 1 2 |
Top |
Cell-cell communication analysis |
| Identification of potential cell-cell interactions between two cell types and their ligand-receptor pairs for different disease states |
| Ligand | Receptor | LRpair | Pathway | Tissue | Disease Stage |
| Page: 1 |
Top |
Single-cell gene regulatory network inference analysis |
| Find out the significant the regulons (TFs) and the target genes of each regulon across cell types for different disease states |
| TF | Cell Type | Tissue | Disease Stage | Target Gene | RSS | Regulon Activity |
| ∗The dot plots of a searched regulon are shown for all cell subpopulations in each disease state of each tissue based on the regulon specific score inferred using pySCENIC and by calculating the average expression. |
| Page: 1 |
Top |
Somatic mutation of malignant transformation related genes |
| Annotation of somatic variants for genes involved in malignant transformation |
| Hugo Symbol | Variant Class | Variant Classification | dbSNP RS | HGVSc | HGVSp | HGVSp Short | SWISSPROT | BIOTYPE | SIFT | PolyPhen | Tumor Sample Barcode | Tissue | Histology | Sex | Age | Stage | Therapy Types | Drugs | Outcome |
| CHMP4A | SNV | Missense_Mutation | rs575738905 | c.346N>A | p.Glu116Lys | p.E116K | Q9BY43 | protein_coding | deleterious(0) | probably_damaging(0.999) | TCGA-AN-A046-01 | Breast | breast invasive carcinoma | Female | >=65 | I/II | Unknown | Unknown | SD |
| CHMP4A | SNV | Missense_Mutation | novel | c.618N>T | p.Glu206Asp | p.E206D | Q9BY43 | protein_coding | tolerated(0.44) | possibly_damaging(0.707) | TCGA-AG-3892-01 | Colorectum | rectum adenocarcinoma | Female | <65 | I/II | Unknown | Unknown | SD |
| CHMP4A | SNV | Missense_Mutation | c.398N>A | p.Arg133His | p.R133H | Q9BY43 | protein_coding | deleterious(0.02) | probably_damaging(0.99) | TCGA-EI-6882-01 | Colorectum | rectum adenocarcinoma | Male | <65 | I/II | Unknown | Unknown | SD | |
| CHMP4A | SNV | Missense_Mutation | c.569N>A | p.Ser190Tyr | p.S190Y | Q9BY43 | protein_coding | deleterious(0) | probably_damaging(0.996) | TCGA-F5-6814-01 | Colorectum | rectum adenocarcinoma | Male | <65 | I/II | Unknown | Unknown | SD | |
| CHMP4A | SNV | Missense_Mutation | novel | c.341N>T | p.Arg114Ile | p.R114I | Q9BY43 | protein_coding | deleterious(0) | probably_damaging(0.937) | TCGA-AP-A1E0-01 | Endometrium | uterine corpus endometrioid carcinoma | Female | <65 | III/IV | Chemotherapy | paclitaxel | SD |
| CHMP4A | SNV | Missense_Mutation | novel | c.341N>T | p.Arg114Ile | p.R114I | Q9BY43 | protein_coding | deleterious(0) | probably_damaging(0.937) | TCGA-AX-A0J0-01 | Endometrium | uterine corpus endometrioid carcinoma | Female | <65 | I/II | Unknown | Unknown | SD |
| CHMP4A | SNV | Missense_Mutation | c.53T>C | p.Met18Thr | p.M18T | Q9BY43 | protein_coding | tolerated_low_confidence(0.07) | benign(0) | TCGA-BG-A222-01 | Endometrium | uterine corpus endometrioid carcinoma | Female | <65 | I/II | Unknown | Unknown | SD | |
| CHMP4A | SNV | Missense_Mutation | c.300N>T | p.Lys100Asn | p.K100N | Q9BY43 | protein_coding | deleterious(0) | possibly_damaging(0.823) | TCGA-D1-A16Y-01 | Endometrium | uterine corpus endometrioid carcinoma | Female | <65 | I/II | Unknown | Unknown | SD | |
| CHMP4A | SNV | Missense_Mutation | novel | c.563N>T | p.Ala188Val | p.A188V | Q9BY43 | protein_coding | tolerated(0.08) | possibly_damaging(0.836) | TCGA-EO-A22U-01 | Endometrium | uterine corpus endometrioid carcinoma | Female | >=65 | I/II | Unknown | Unknown | SD |
| CHMP4A | SNV | Missense_Mutation | c.569C>T | p.Ser190Phe | p.S190F | Q9BY43 | protein_coding | deleterious(0) | probably_damaging(0.996) | TCGA-EY-A1G8-01 | Endometrium | uterine corpus endometrioid carcinoma | Female | >=65 | I/II | Unknown | Unknown | SD |
| Page: 1 2 |
Top |
Related drugs of malignant transformation related genes |
| Identification of chemicals and drugs interact with genes involved in malignant transfromation |
| (DGIdb 4.0) |
| Entrez ID | Symbol | Category | Interaction Types | Drug Claim Name | Drug Name | PMIDs |
| Page: 1 |

Copyright 2023-Present -The University of Texas Health Science Center at Houston |