
|
|||||
|
 | |
| |
| |
| |
| |
| |
|
Gene: CHKA |
Gene summary for CHKA |
| Gene information | Species | Human | Gene symbol | CHKA | Gene ID | 1119 |
| Gene name | choline kinase alpha | |
| Gene Alias | CHK | |
| Cytomap | 11q13.2 | |
| Gene Type | protein-coding | GO ID | GO:0006066 | UniProtAcc | P35790 |
Top |
Malignant transformation analysis |
| Identification of the aberrant gene expression in precancerous and cancerous lesions by comparing the gene expression of stem-like cells in diseased tissues with normal stem cells |
| Entrez ID | Symbol | Replicates | Species | Organ | Tissue | Adj P-value | Log2FC | Malignancy |
| 1119 | CHKA | A015-C-106 | Human | Colorectum | FAP | 9.89e-08 | -6.09e-02 | -0.0511 |
| 1119 | CHKA | A002-C-114 | Human | Colorectum | FAP | 1.77e-16 | -1.74e-01 | -0.1561 |
| 1119 | CHKA | A015-C-104 | Human | Colorectum | FAP | 1.66e-30 | -1.74e-01 | -0.1899 |
| 1119 | CHKA | A001-C-014 | Human | Colorectum | FAP | 1.18e-13 | -3.00e-01 | 0.0135 |
| 1119 | CHKA | A002-C-016 | Human | Colorectum | FAP | 4.49e-21 | -3.15e-01 | 0.0521 |
| 1119 | CHKA | A015-C-002 | Human | Colorectum | FAP | 6.99e-10 | -2.91e-01 | -0.0763 |
| 1119 | CHKA | A001-C-203 | Human | Colorectum | FAP | 2.25e-06 | -1.59e-01 | -0.0481 |
| 1119 | CHKA | A002-C-116 | Human | Colorectum | FAP | 1.09e-30 | -3.48e-01 | -0.0452 |
| 1119 | CHKA | A014-C-008 | Human | Colorectum | FAP | 1.96e-11 | -2.28e-01 | -0.191 |
| 1119 | CHKA | A018-E-020 | Human | Colorectum | FAP | 1.08e-17 | -3.15e-01 | -0.2034 |
| 1119 | CHKA | F034 | Human | Colorectum | FAP | 2.65e-20 | -3.01e-01 | -0.0665 |
| 1119 | CHKA | F072B | Human | Colorectum | FAP | 6.36e-09 | -2.66e-01 | 0.257 |
| 1119 | CHKA | CRC-1-8810 | Human | Colorectum | CRC | 6.28e-10 | -4.48e-01 | 0.6257 |
| 1119 | CHKA | CRC-3-11773 | Human | Colorectum | CRC | 1.11e-05 | -1.27e-01 | 0.2564 |
| 1119 | CHKA | AEH-subject1 | Human | Endometrium | AEH | 3.39e-06 | 3.33e-01 | -0.3059 |
| 1119 | CHKA | AEH-subject2 | Human | Endometrium | AEH | 2.21e-06 | 3.39e-01 | -0.2525 |
| 1119 | CHKA | AEH-subject3 | Human | Endometrium | AEH | 1.56e-03 | 2.08e-01 | -0.2576 |
| 1119 | CHKA | AEH-subject4 | Human | Endometrium | AEH | 1.85e-05 | 3.56e-01 | -0.2657 |
| 1119 | CHKA | AEH-subject5 | Human | Endometrium | AEH | 1.07e-16 | 5.71e-01 | -0.2953 |
| 1119 | CHKA | EEC-subject1 | Human | Endometrium | EEC | 2.48e-09 | 4.07e-01 | -0.2682 |
| Page: 1 2 3 4 5 6 7 |
| Tissue | Expression Dynamics | Abbreviation |
| Colorectum (GSE201348) |  | FAP: Familial adenomatous polyposis |
| CRC: Colorectal cancer | ||
| Colorectum (HTA11) |  | AD: Adenomas |
| SER: Sessile serrated lesions | ||
| MSI-H: Microsatellite-high colorectal cancer | ||
| MSS: Microsatellite stable colorectal cancer | ||
| Endometrium | 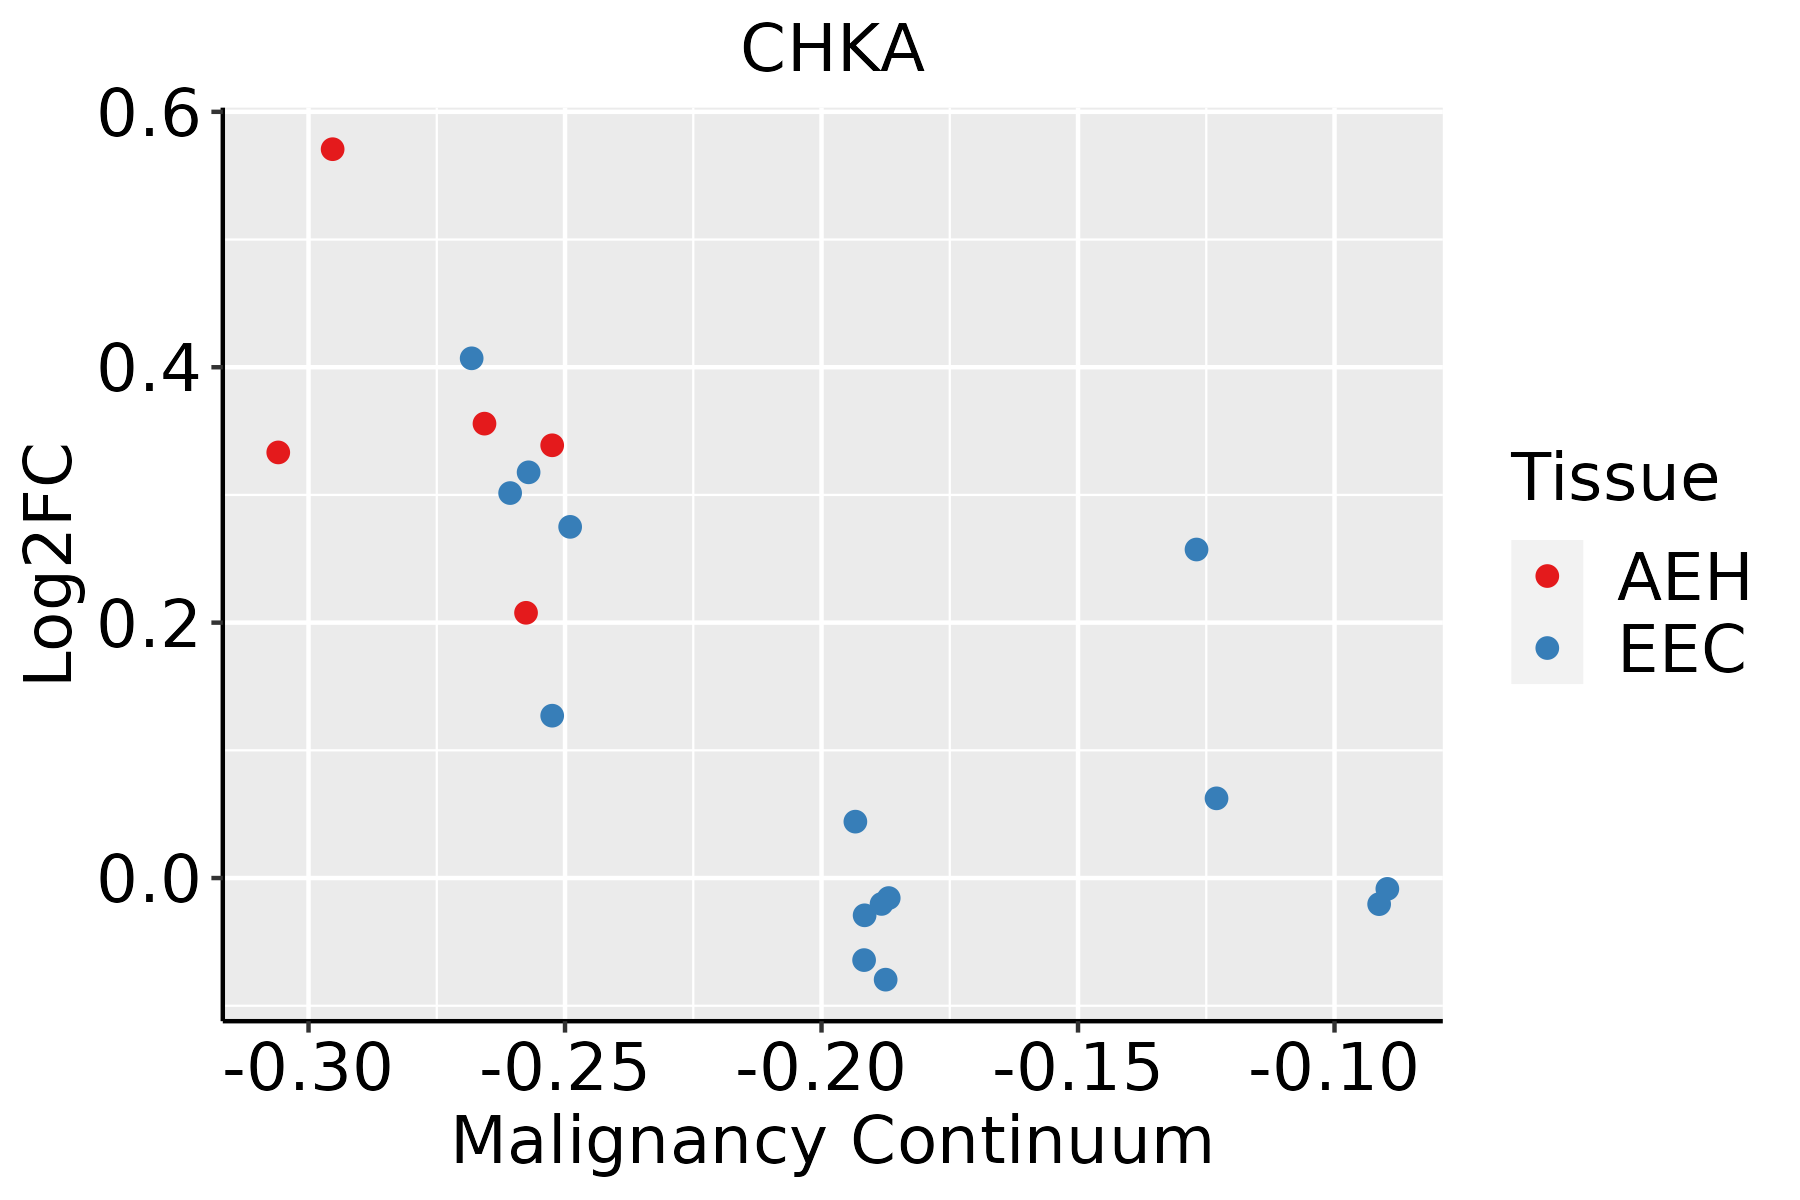 | AEH: Atypical endometrial hyperplasia |
| EEC: Endometrioid Cancer | ||
| Esophagus |  | ESCC: Esophageal squamous cell carcinoma |
| HGIN: High-grade intraepithelial neoplasias | ||
| LGIN: Low-grade intraepithelial neoplasias | ||
| Liver | 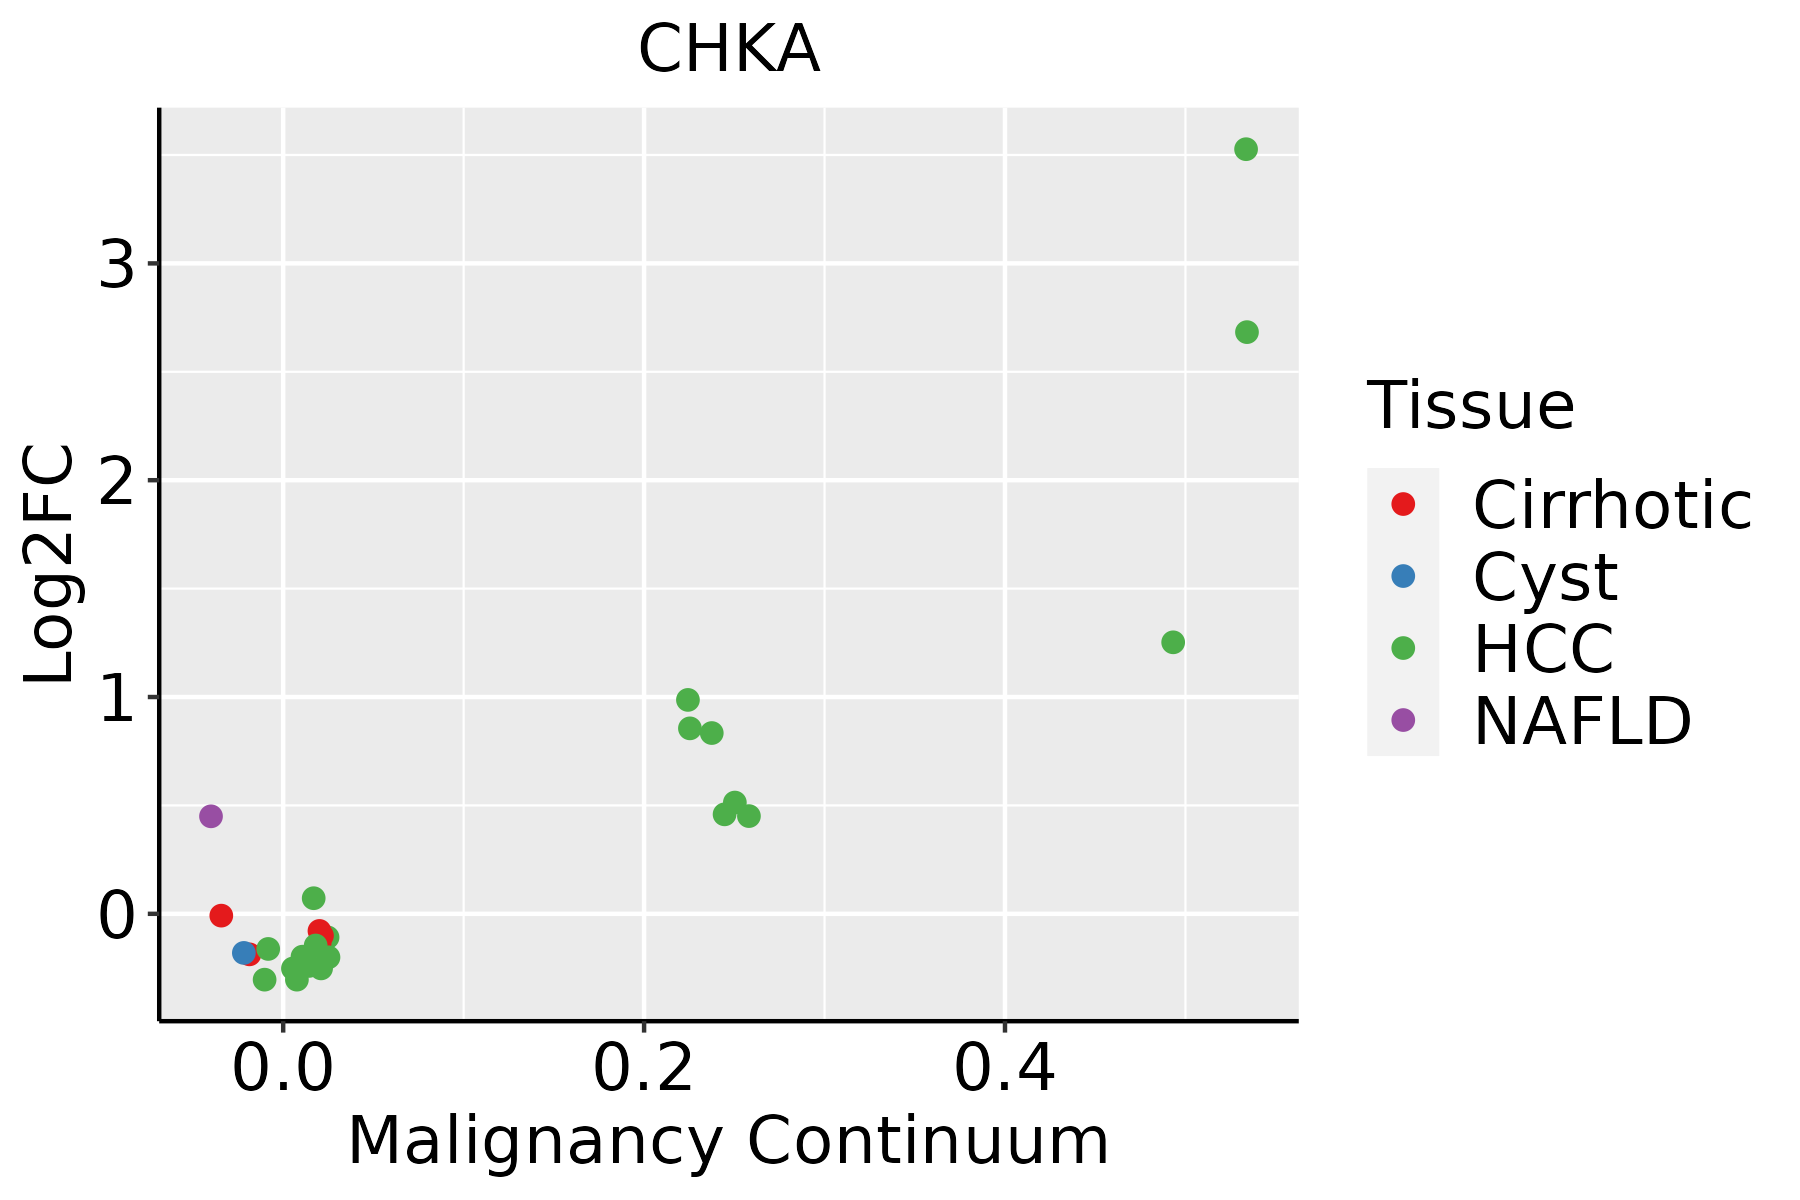 | HCC: Hepatocellular carcinoma |
| NAFLD: Non-alcoholic fatty liver disease | ||
| Lung | 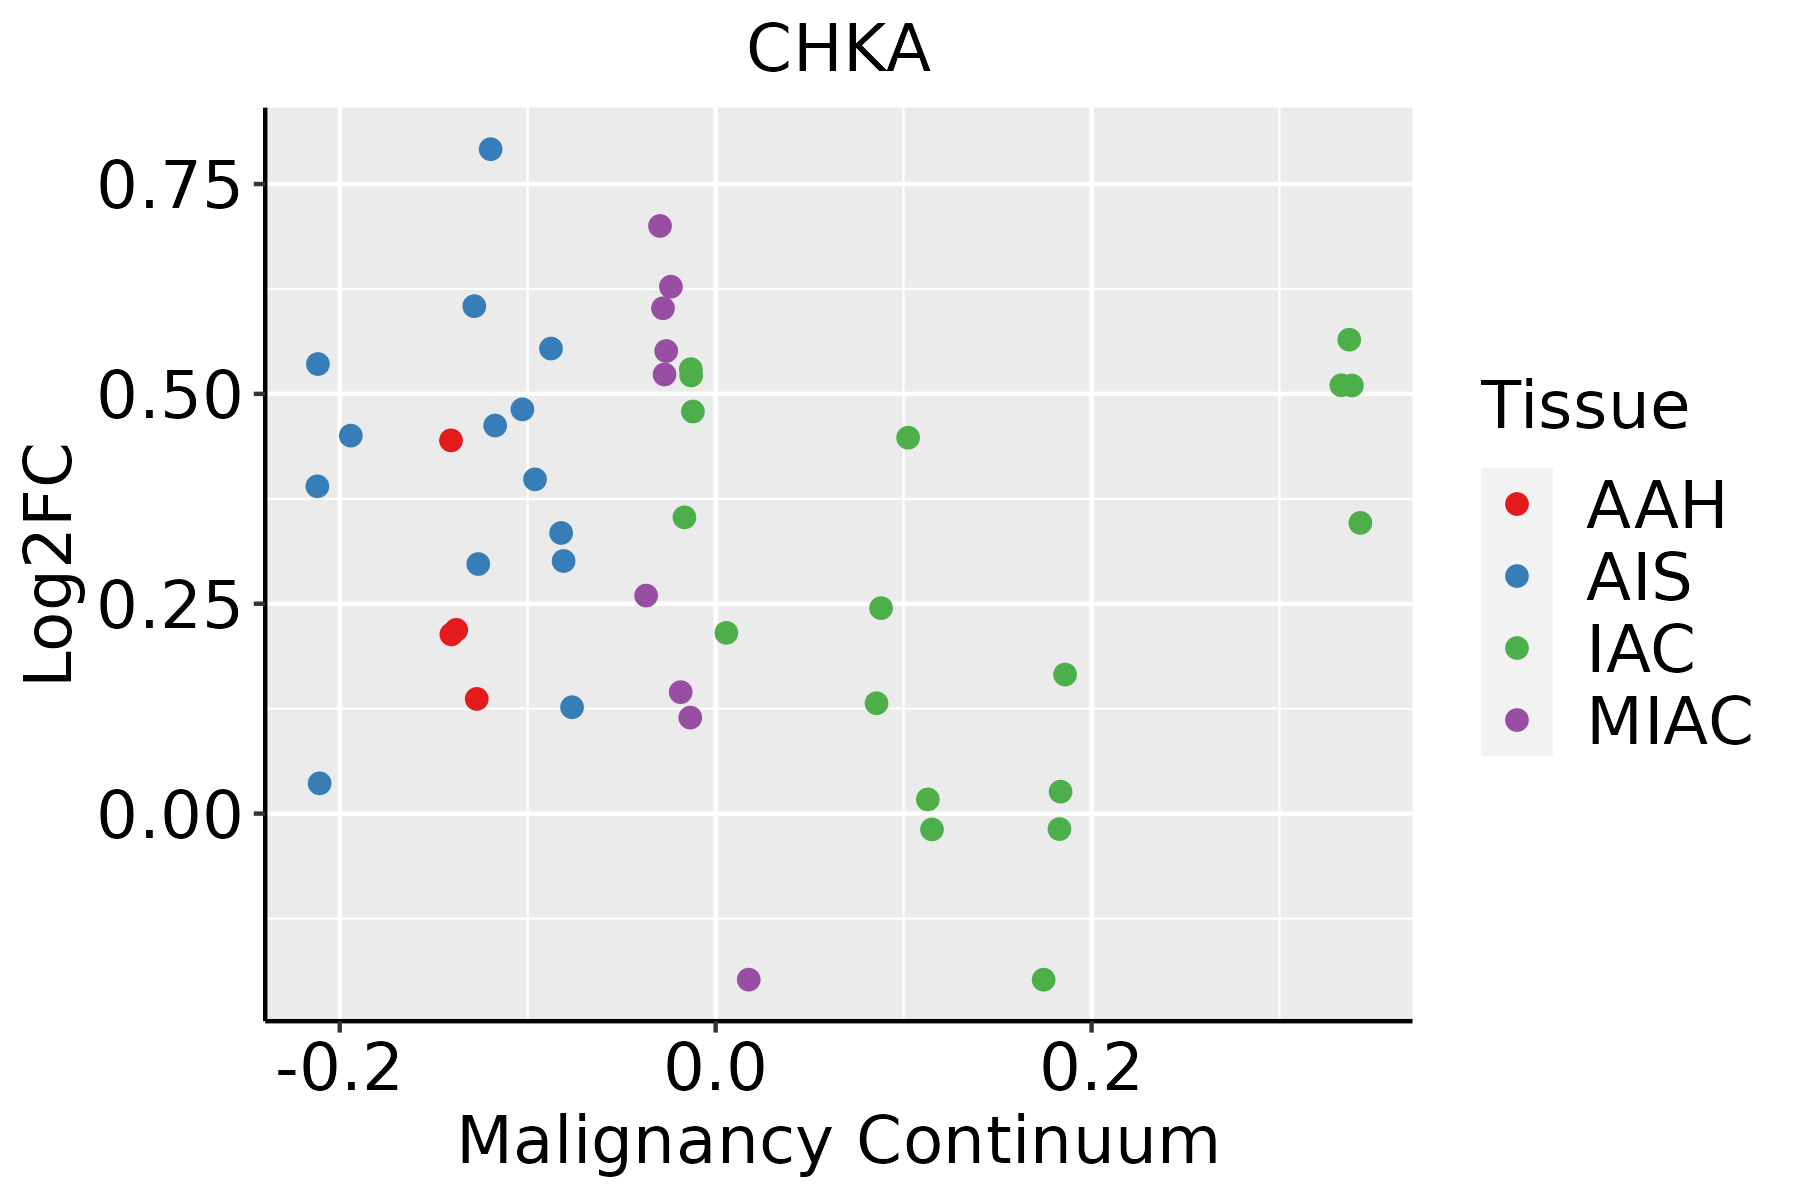 | AAH: Atypical adenomatous hyperplasia |
| AIS: Adenocarcinoma in situ | ||
| IAC: Invasive lung adenocarcinoma | ||
| MIA: Minimally invasive adenocarcinoma | ||
| Prostate |  | BPH: Benign Prostatic Hyperplasia |
| ∗log2FC in expression of this searched gene in stem-like cells from each diseased tissue sample relative to stem-like cells in normal samples in each tissue plotted against the malignancy continuum. Samples are colored based on if they are from different disease stage. |
Top |
Malignant transformation related pathway analysis |
| Find out the enriched GO biological processes and KEGG pathways involved in transition from healthy to precancer to cancer |
| Tissue | Disease Stage | Enriched GO biological Processes |
| Colorectum | AD |  |
| Colorectum | SER |  |
| Colorectum | MSS |  |
| Colorectum | MSI-H |  |
| Colorectum | FAP |  |
| ∗Top 15 enriched GO BP terms are showed in the bar plot of each disease state in each tissue. Each row represents a significant GO biological process which is colored according to the -log10(p.adjust). |
| Page: 1 2 3 4 5 6 7 8 9 |
| GO ID | Tissue | Disease Stage | Description | Gene Ratio | Bg Ratio | pvalue | p.adjust | Count |
| GO:0009636 | Colorectum | AD | response to toxic substance | 88/3918 | 262/18723 | 1.12e-06 | 3.72e-05 | 88 |
| GO:0006066 | Colorectum | AD | alcohol metabolic process | 106/3918 | 353/18723 | 3.02e-05 | 5.57e-04 | 106 |
| GO:0034308 | Colorectum | AD | primary alcohol metabolic process | 35/3918 | 102/18723 | 1.16e-03 | 1.05e-02 | 35 |
| GO:0010876 | Colorectum | AD | lipid localization | 120/3918 | 448/18723 | 1.59e-03 | 1.33e-02 | 120 |
| GO:0006869 | Colorectum | AD | lipid transport | 108/3918 | 398/18723 | 1.67e-03 | 1.39e-02 | 108 |
| GO:0006650 | Colorectum | AD | glycerophospholipid metabolic process | 83/3918 | 306/18723 | 5.40e-03 | 3.55e-02 | 83 |
| GO:0006644 | Colorectum | AD | phospholipid metabolic process | 101/3918 | 383/18723 | 5.80e-03 | 3.67e-02 | 101 |
| GO:0045017 | Colorectum | AD | glycerolipid biosynthetic process | 69/3918 | 252/18723 | 8.33e-03 | 4.88e-02 | 69 |
| GO:00096362 | Colorectum | MSS | response to toxic substance | 73/3467 | 262/18723 | 1.26e-04 | 1.94e-03 | 73 |
| GO:00060662 | Colorectum | MSS | alcohol metabolic process | 92/3467 | 353/18723 | 2.57e-04 | 3.46e-03 | 92 |
| GO:00108761 | Colorectum | MSS | lipid localization | 104/3467 | 448/18723 | 6.76e-03 | 4.38e-02 | 104 |
| GO:00068691 | Colorectum | FAP | lipid transport | 81/2622 | 398/18723 | 2.84e-04 | 3.76e-03 | 81 |
| GO:0008654 | Colorectum | FAP | phospholipid biosynthetic process | 54/2622 | 253/18723 | 8.88e-04 | 9.08e-03 | 54 |
| GO:00066502 | Colorectum | FAP | glycerophospholipid metabolic process | 62/2622 | 306/18723 | 1.54e-03 | 1.38e-02 | 62 |
| GO:00108762 | Colorectum | FAP | lipid localization | 85/2622 | 448/18723 | 1.92e-03 | 1.63e-02 | 85 |
| GO:00066442 | Colorectum | FAP | phospholipid metabolic process | 74/2622 | 383/18723 | 2.24e-03 | 1.83e-02 | 74 |
| GO:00060663 | Colorectum | FAP | alcohol metabolic process | 69/2622 | 353/18723 | 2.29e-03 | 1.85e-02 | 69 |
| GO:00096363 | Colorectum | FAP | response to toxic substance | 53/2622 | 262/18723 | 3.35e-03 | 2.46e-02 | 53 |
| GO:0046474 | Colorectum | FAP | glycerophospholipid biosynthetic process | 44/2622 | 211/18723 | 3.98e-03 | 2.76e-02 | 44 |
| GO:00450172 | Colorectum | FAP | glycerolipid biosynthetic process | 50/2622 | 252/18723 | 6.32e-03 | 3.95e-02 | 50 |
| Page: 1 2 3 4 |
| Pathway ID | Tissue | Disease Stage | Description | Gene Ratio | Bg Ratio | pvalue | p.adjust | qvalue | Count |
| hsa05231 | Colorectum | MSS | Choline metabolism in cancer | 34/1875 | 98/8465 | 2.90e-03 | 1.39e-02 | 8.50e-03 | 34 |
| hsa052311 | Colorectum | MSS | Choline metabolism in cancer | 34/1875 | 98/8465 | 2.90e-03 | 1.39e-02 | 8.50e-03 | 34 |
| hsa052312 | Colorectum | FAP | Choline metabolism in cancer | 29/1404 | 98/8465 | 9.03e-04 | 5.20e-03 | 3.16e-03 | 29 |
| hsa052313 | Colorectum | FAP | Choline metabolism in cancer | 29/1404 | 98/8465 | 9.03e-04 | 5.20e-03 | 3.16e-03 | 29 |
| hsa052314 | Colorectum | CRC | Choline metabolism in cancer | 24/1091 | 98/8465 | 1.21e-03 | 9.84e-03 | 6.67e-03 | 24 |
| hsa052315 | Colorectum | CRC | Choline metabolism in cancer | 24/1091 | 98/8465 | 1.21e-03 | 9.84e-03 | 6.67e-03 | 24 |
| hsa052319 | Esophagus | ESCC | Choline metabolism in cancer | 61/4205 | 98/8465 | 7.97e-03 | 1.92e-02 | 9.84e-03 | 61 |
| hsa0523114 | Esophagus | ESCC | Choline metabolism in cancer | 61/4205 | 98/8465 | 7.97e-03 | 1.92e-02 | 9.84e-03 | 61 |
| hsa052316 | Liver | HCC | Choline metabolism in cancer | 57/4020 | 98/8465 | 2.14e-02 | 4.90e-02 | 2.72e-02 | 57 |
| hsa0523111 | Liver | HCC | Choline metabolism in cancer | 57/4020 | 98/8465 | 2.14e-02 | 4.90e-02 | 2.72e-02 | 57 |
| hsa052317 | Lung | IAC | Choline metabolism in cancer | 23/1053 | 98/8465 | 1.72e-03 | 9.66e-03 | 6.41e-03 | 23 |
| hsa0523112 | Lung | IAC | Choline metabolism in cancer | 23/1053 | 98/8465 | 1.72e-03 | 9.66e-03 | 6.41e-03 | 23 |
| Page: 1 |
Top |
Cell-cell communication analysis |
| Identification of potential cell-cell interactions between two cell types and their ligand-receptor pairs for different disease states |
| Ligand | Receptor | LRpair | Pathway | Tissue | Disease Stage |
| Page: 1 |
Top |
Single-cell gene regulatory network inference analysis |
| Find out the significant the regulons (TFs) and the target genes of each regulon across cell types for different disease states |
| TF | Cell Type | Tissue | Disease Stage | Target Gene | RSS | Regulon Activity |
| ∗The dot plots of a searched regulon are shown for all cell subpopulations in each disease state of each tissue based on the regulon specific score inferred using pySCENIC and by calculating the average expression. |
| Page: 1 |
Top |
Somatic mutation of malignant transformation related genes |
| Annotation of somatic variants for genes involved in malignant transformation |
| Hugo Symbol | Variant Class | Variant Classification | dbSNP RS | HGVSc | HGVSp | HGVSp Short | SWISSPROT | BIOTYPE | SIFT | PolyPhen | Tumor Sample Barcode | Tissue | Histology | Sex | Age | Stage | Therapy Types | Drugs | Outcome |
| CHKA | SNV | Missense_Mutation | novel | c.443N>G | p.Tyr148Cys | p.Y148C | P35790 | protein_coding | deleterious(0) | probably_damaging(0.998) | TCGA-JL-A3YW-01 | Breast | breast invasive carcinoma | Female | <65 | I/II | Unknown | Unknown | SD |
| CHKA | deletion | Frame_Shift_Del | novel | c.353delN | p.Gly118AlafsTer37 | p.G118Afs*37 | P35790 | protein_coding | TCGA-D8-A27V-01 | Breast | breast invasive carcinoma | Female | <65 | I/II | Hormone Therapy | tamoxiphen | SD | ||
| CHKA | SNV | Missense_Mutation | novel | c.1171G>A | p.Glu391Lys | p.E391K | P35790 | protein_coding | tolerated(0.08) | benign(0.001) | TCGA-EA-A3HU-01 | Cervix | cervical & endocervical cancer | Female | <65 | I/II | Unknown | Unknown | SD |
| CHKA | SNV | Missense_Mutation | novel | c.994G>A | p.Glu332Lys | p.E332K | P35790 | protein_coding | deleterious(0) | probably_damaging(0.993) | TCGA-EA-A3HU-01 | Cervix | cervical & endocervical cancer | Female | <65 | I/II | Unknown | Unknown | SD |
| CHKA | SNV | Missense_Mutation | rs368477871 | c.635G>A | p.Arg212Gln | p.R212Q | P35790 | protein_coding | deleterious(0) | probably_damaging(0.971) | TCGA-EK-A2PI-01 | Cervix | cervical & endocervical cancer | Female | <65 | III/IV | Unknown | Unknown | SD |
| CHKA | SNV | Missense_Mutation | c.785N>T | p.Arg262Ile | p.R262I | P35790 | protein_coding | deleterious(0.03) | benign(0.061) | TCGA-AA-A010-01 | Colorectum | colon adenocarcinoma | Female | <65 | I/II | Chemotherapy | folinic | CR | |
| CHKA | SNV | Missense_Mutation | c.832N>T | p.Leu278Phe | p.L278F | P35790 | protein_coding | tolerated(0.11) | possibly_damaging(0.688) | TCGA-AA-A01R-01 | Colorectum | colon adenocarcinoma | Male | <65 | III/IV | Chemotherapy | 5-fluorouracil | PD | |
| CHKA | SNV | Missense_Mutation | novel | c.802G>A | p.Glu268Lys | p.E268K | P35790 | protein_coding | tolerated(0.1) | benign(0.06) | TCGA-AZ-4315-01 | Colorectum | colon adenocarcinoma | Male | <65 | I/II | Unknown | Unknown | SD |
| CHKA | SNV | Missense_Mutation | c.1202T>G | p.Ile401Arg | p.I401R | P35790 | protein_coding | tolerated(0.12) | benign(0.001) | TCGA-AG-3881-01 | Colorectum | rectum adenocarcinoma | Female | >=65 | I/II | Unknown | Unknown | SD | |
| CHKA | SNV | Missense_Mutation | c.525N>T | p.Glu175Asp | p.E175D | P35790 | protein_coding | tolerated(0.44) | benign(0.015) | TCGA-AG-A02N-01 | Colorectum | rectum adenocarcinoma | Male | >=65 | I/II | Chemotherapy | folinic | CR |
| Page: 1 2 3 4 5 |
Top |
Related drugs of malignant transformation related genes |
| Identification of chemicals and drugs interact with genes involved in malignant transfromation |
| (DGIdb 4.0) |
| Entrez ID | Symbol | Category | Interaction Types | Drug Claim Name | Drug Name | PMIDs |
| 1119 | CHKA | ENZYME, KINASE | TCD-717 | TCD-717 | ||
| 1119 | CHKA | ENZYME, KINASE | inhibitor | CHEMBL3545084 | TCD-717 | |
| 1119 | CHKA | ENZYME, KINASE | DEXAMETHASONE | DEXAMETHASONE | 10077342 |
| Page: 1 |

Copyright 2023-Present -The University of Texas Health Science Center at Houston |