
|
|||||
|
 | |
| |
| |
| |
| |
| |
|
Gene: CEP78 |
Gene summary for CEP78 |
| Gene information | Species | Human | Gene symbol | CEP78 | Gene ID | 84131 |
| Gene name | centrosomal protein 78 | |
| Gene Alias | C9orf81 | |
| Cytomap | 9q21.2 | |
| Gene Type | protein-coding | GO ID | GO:0006996 | UniProtAcc | Q5JTW2 |
Top |
Malignant transformation analysis |
| Identification of the aberrant gene expression in precancerous and cancerous lesions by comparing the gene expression of stem-like cells in diseased tissues with normal stem cells |
| Entrez ID | Symbol | Replicates | Species | Organ | Tissue | Adj P-value | Log2FC | Malignancy |
| 84131 | CEP78 | P28T-E | Human | Esophagus | ESCC | 4.27e-20 | 3.45e-01 | 0.1149 |
| 84131 | CEP78 | P30T-E | Human | Esophagus | ESCC | 3.64e-12 | 5.08e-01 | 0.137 |
| 84131 | CEP78 | P31T-E | Human | Esophagus | ESCC | 4.04e-08 | 1.71e-01 | 0.1251 |
| 84131 | CEP78 | P32T-E | Human | Esophagus | ESCC | 2.73e-12 | 2.61e-01 | 0.1666 |
| 84131 | CEP78 | P36T-E | Human | Esophagus | ESCC | 5.79e-08 | 4.19e-01 | 0.1187 |
| 84131 | CEP78 | P37T-E | Human | Esophagus | ESCC | 5.12e-08 | 2.37e-01 | 0.1371 |
| 84131 | CEP78 | P39T-E | Human | Esophagus | ESCC | 4.23e-10 | 1.07e-01 | 0.0894 |
| 84131 | CEP78 | P42T-E | Human | Esophagus | ESCC | 8.90e-07 | 1.97e-01 | 0.1175 |
| 84131 | CEP78 | P48T-E | Human | Esophagus | ESCC | 2.89e-09 | 1.68e-01 | 0.0959 |
| 84131 | CEP78 | P52T-E | Human | Esophagus | ESCC | 3.46e-16 | 3.47e-01 | 0.1555 |
| 84131 | CEP78 | P56T-E | Human | Esophagus | ESCC | 2.39e-02 | 5.73e-01 | 0.1613 |
| 84131 | CEP78 | P57T-E | Human | Esophagus | ESCC | 5.99e-11 | 9.73e-02 | 0.0926 |
| 84131 | CEP78 | P61T-E | Human | Esophagus | ESCC | 1.05e-07 | 1.71e-01 | 0.099 |
| 84131 | CEP78 | P62T-E | Human | Esophagus | ESCC | 2.18e-12 | 2.38e-01 | 0.1302 |
| 84131 | CEP78 | P74T-E | Human | Esophagus | ESCC | 2.65e-10 | 5.18e-01 | 0.1479 |
| 84131 | CEP78 | P75T-E | Human | Esophagus | ESCC | 1.35e-05 | 1.90e-01 | 0.1125 |
| 84131 | CEP78 | P76T-E | Human | Esophagus | ESCC | 6.50e-11 | 1.86e-01 | 0.1207 |
| 84131 | CEP78 | P79T-E | Human | Esophagus | ESCC | 1.90e-16 | 2.42e-01 | 0.1154 |
| 84131 | CEP78 | P80T-E | Human | Esophagus | ESCC | 4.77e-10 | 3.22e-01 | 0.155 |
| 84131 | CEP78 | P82T-E | Human | Esophagus | ESCC | 1.51e-03 | 2.34e-01 | 0.1072 |
| Page: 1 2 3 4 |
| Tissue | Expression Dynamics | Abbreviation |
| Esophagus |  | ESCC: Esophageal squamous cell carcinoma |
| HGIN: High-grade intraepithelial neoplasias | ||
| LGIN: Low-grade intraepithelial neoplasias | ||
| Skin | 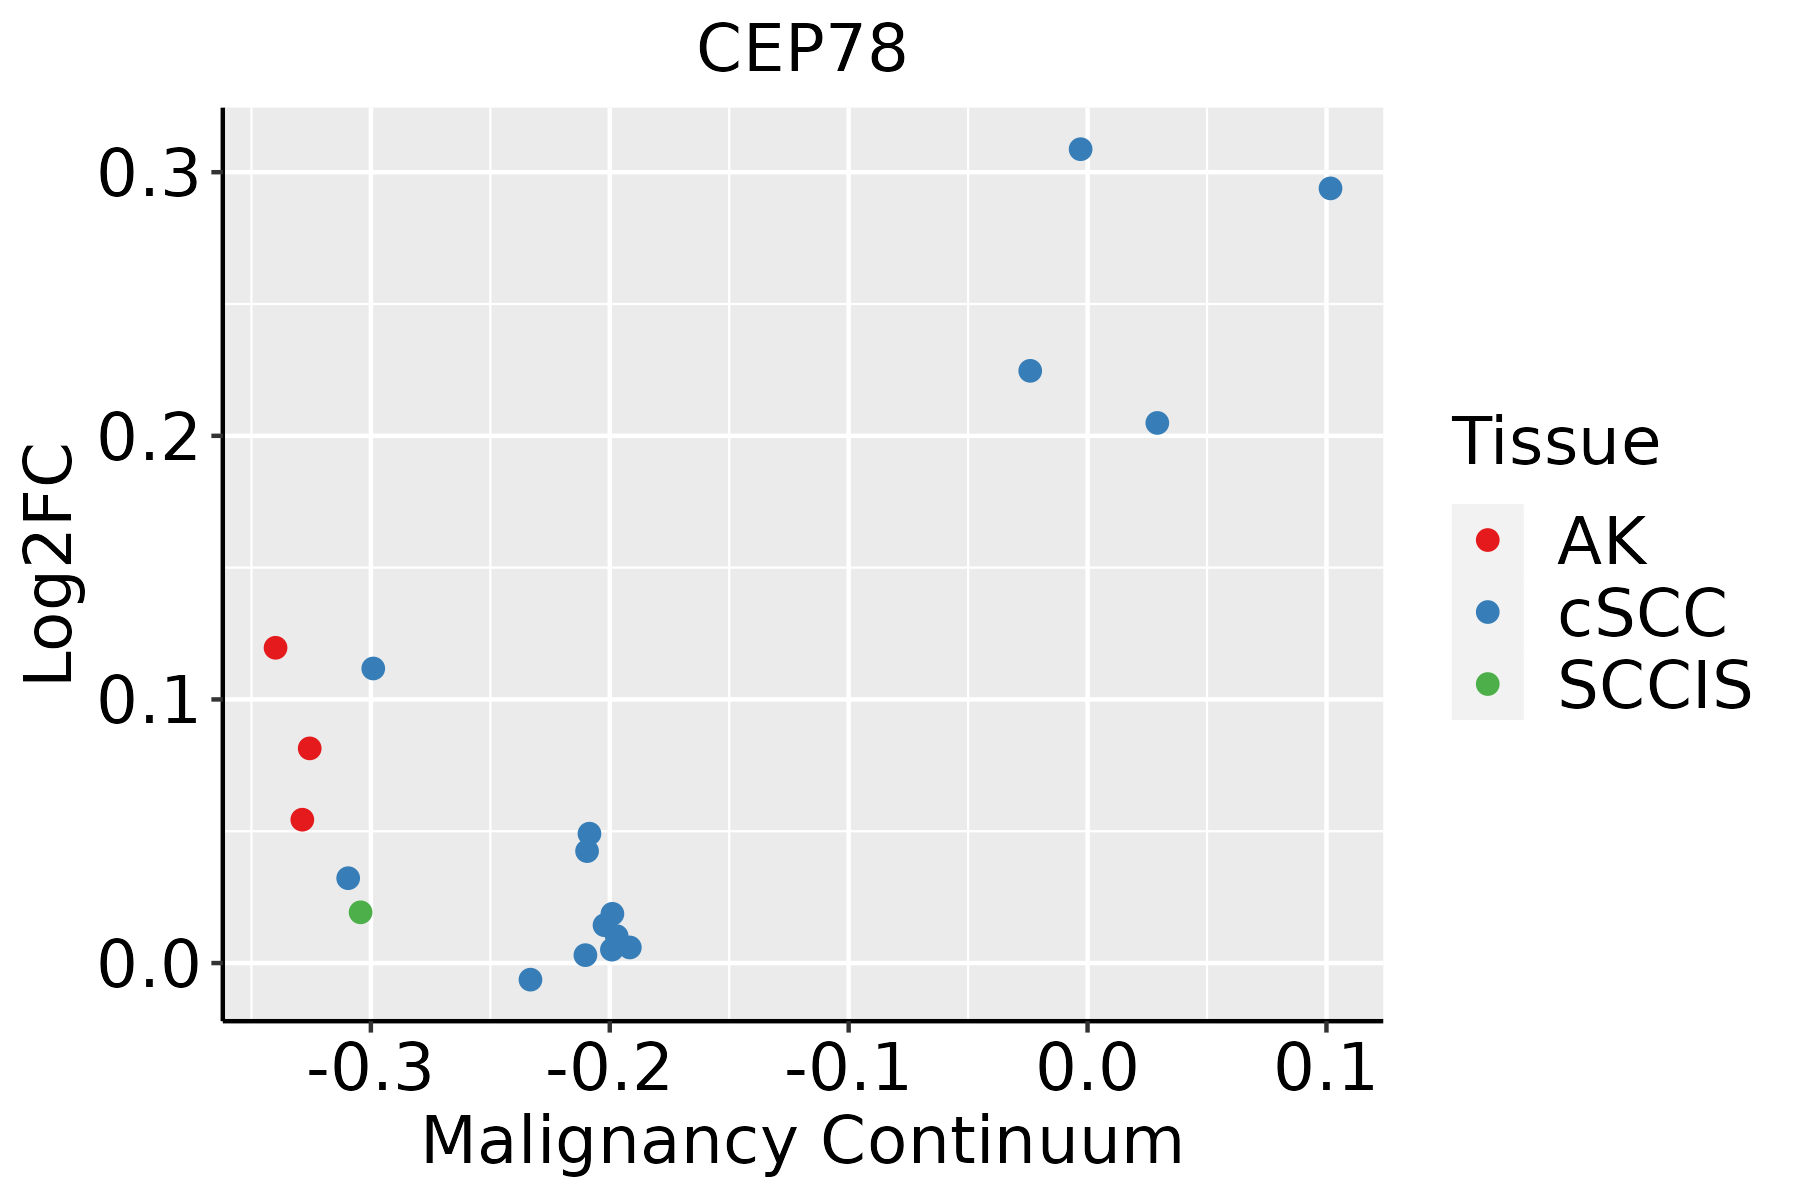 | AK: Actinic keratosis |
| cSCC: Cutaneous squamous cell carcinoma | ||
| SCCIS:squamous cell carcinoma in situ | ||
| Thyroid | 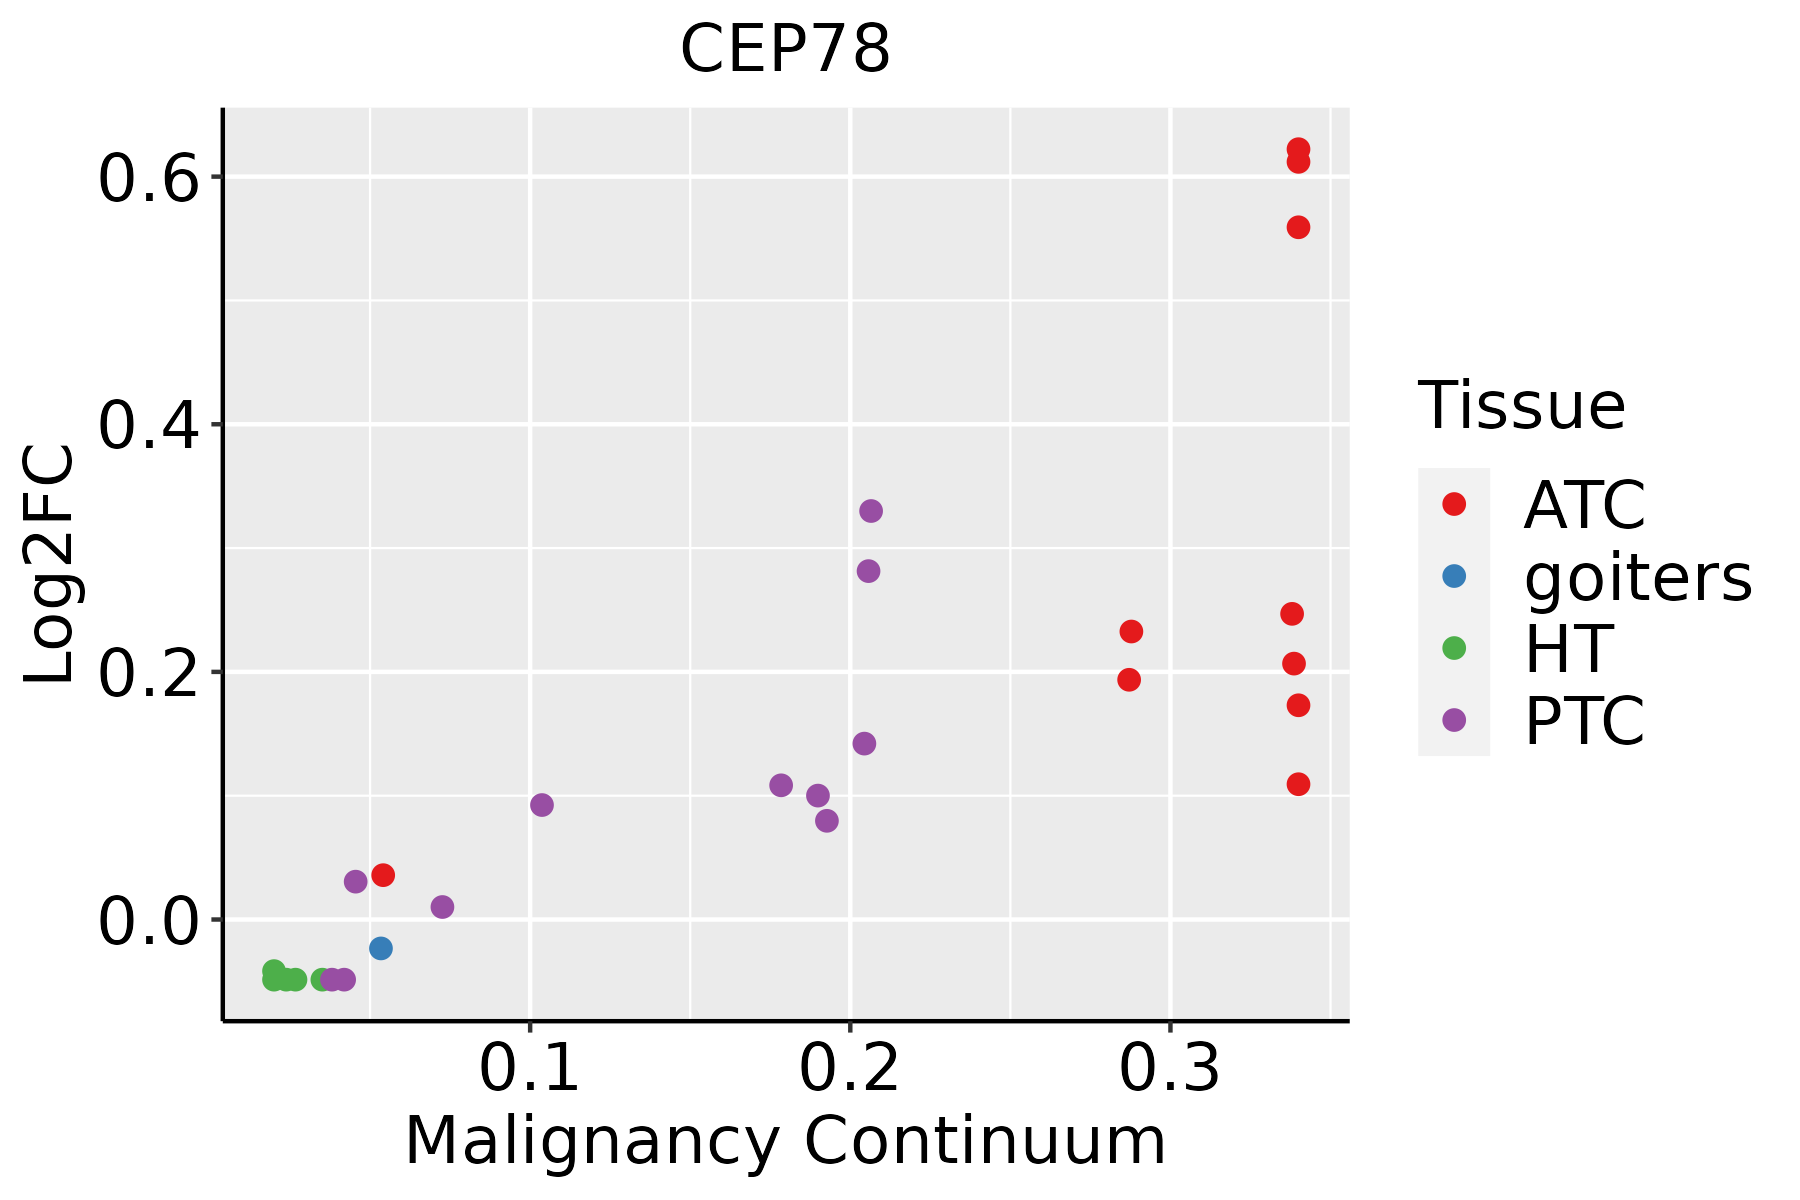 | ATC: Anaplastic thyroid cancer |
| HT: Hashimoto's thyroiditis | ||
| PTC: Papillary thyroid cancer |
| ∗log2FC in expression of this searched gene in stem-like cells from each diseased tissue sample relative to stem-like cells in normal samples in each tissue plotted against the malignancy continuum. Samples are colored based on if they are from different disease stage. |
Top |
Malignant transformation related pathway analysis |
| Find out the enriched GO biological processes and KEGG pathways involved in transition from healthy to precancer to cancer |
| Tissue | Disease Stage | Enriched GO biological Processes |
| Colorectum | AD |  |
| Colorectum | SER |  |
| Colorectum | MSS |  |
| Colorectum | MSI-H |  |
| Colorectum | FAP |  |
| ∗Top 15 enriched GO BP terms are showed in the bar plot of each disease state in each tissue. Each row represents a significant GO biological process which is colored according to the -log10(p.adjust). |
| Page: 1 2 3 4 5 6 7 8 9 |
| GO ID | Tissue | Disease Stage | Description | Gene Ratio | Bg Ratio | pvalue | p.adjust | Count |
| Page: 1 |
| Pathway ID | Tissue | Disease Stage | Description | Gene Ratio | Bg Ratio | pvalue | p.adjust | qvalue | Count |
| Page: 1 |
Top |
Cell-cell communication analysis |
| Identification of potential cell-cell interactions between two cell types and their ligand-receptor pairs for different disease states |
| Ligand | Receptor | LRpair | Pathway | Tissue | Disease Stage |
| Page: 1 |
Top |
Single-cell gene regulatory network inference analysis |
| Find out the significant the regulons (TFs) and the target genes of each regulon across cell types for different disease states |
| TF | Cell Type | Tissue | Disease Stage | Target Gene | RSS | Regulon Activity |
| ∗The dot plots of a searched regulon are shown for all cell subpopulations in each disease state of each tissue based on the regulon specific score inferred using pySCENIC and by calculating the average expression. |
| Page: 1 |
Top |
Somatic mutation of malignant transformation related genes |
| Annotation of somatic variants for genes involved in malignant transformation |
| Hugo Symbol | Variant Class | Variant Classification | dbSNP RS | HGVSc | HGVSp | HGVSp Short | SWISSPROT | BIOTYPE | SIFT | PolyPhen | Tumor Sample Barcode | Tissue | Histology | Sex | Age | Stage | Therapy Types | Drugs | Outcome |
| CEP78 | SNV | Missense_Mutation | c.1612N>T | p.Leu538Phe | p.L538F | Q5JTW2 | protein_coding | deleterious(0.01) | probably_damaging(0.999) | TCGA-AC-A23H-01 | Breast | breast invasive carcinoma | Female | >=65 | I/II | Unknown | Unknown | PD | |
| CEP78 | SNV | Missense_Mutation | novel | c.407N>C | p.Asp136Ala | p.D136A | Q5JTW2 | protein_coding | deleterious(0) | probably_damaging(0.998) | TCGA-AN-A046-01 | Breast | breast invasive carcinoma | Female | >=65 | I/II | Unknown | Unknown | SD |
| CEP78 | SNV | Missense_Mutation | rs756662244 | c.1657A>G | p.Ile553Val | p.I553V | Q5JTW2 | protein_coding | deleterious(0) | probably_damaging(0.978) | TCGA-BH-A0HO-01 | Breast | breast invasive carcinoma | Female | <65 | I/II | Chemotherapy | cyclophosphamide | SD |
| CEP78 | SNV | Missense_Mutation | rs756662244 | c.1657N>G | p.Ile553Val | p.I553V | Q5JTW2 | protein_coding | deleterious(0) | probably_damaging(0.978) | TCGA-BH-A0HU-01 | Breast | breast invasive carcinoma | Female | <65 | I/II | Chemotherapy | docetaxel | SD |
| CEP78 | SNV | Missense_Mutation | c.1744N>A | p.Glu582Lys | p.E582K | Q5JTW2 | protein_coding | tolerated(0.11) | possibly_damaging(0.814) | TCGA-BH-A18U-01 | Breast | breast invasive carcinoma | Female | >=65 | III/IV | Unknown | Unknown | SD | |
| CEP78 | SNV | Missense_Mutation | c.563N>C | p.Leu188Pro | p.L188P | Q5JTW2 | protein_coding | deleterious(0) | probably_damaging(0.925) | TCGA-E2-A156-01 | Breast | breast invasive carcinoma | Female | <65 | I/II | Hormone Therapy | arimidex | SD | |
| CEP78 | SNV | Missense_Mutation | rs756662244 | c.1657N>G | p.Ile553Val | p.I553V | Q5JTW2 | protein_coding | deleterious(0) | probably_damaging(0.978) | TCGA-EW-A1J3-01 | Breast | breast invasive carcinoma | Female | <65 | I/II | Chemotherapy | carboplatin | SD |
| CEP78 | insertion | Nonsense_Mutation | novel | c.2159_2160insTATTCTATAA | p.His721IlefsTer3 | p.H721Ifs*3 | Q5JTW2 | protein_coding | TCGA-AR-A0U0-01 | Breast | breast invasive carcinoma | Female | >=65 | I/II | Unknown | Unknown | SD | ||
| CEP78 | SNV | Missense_Mutation | rs763394651 | c.2027N>T | p.Ala676Val | p.A676V | Q5JTW2 | protein_coding | tolerated_low_confidence(0.59) | benign(0) | TCGA-2W-A8YY-01 | Cervix | cervical & endocervical cancer | Female | <65 | I/II | Chemotherapy | cisplatin | CR |
| CEP78 | SNV | Missense_Mutation | c.2078G>A | p.Ser693Asn | p.S693N | Q5JTW2 | protein_coding | deleterious_low_confidence(0.02) | probably_damaging(0.997) | TCGA-A6-2686-01 | Colorectum | colon adenocarcinoma | Female | >=65 | I/II | Unknown | Unknown | SD |
| Page: 1 2 3 4 5 6 7 8 |
Top |
Related drugs of malignant transformation related genes |
| Identification of chemicals and drugs interact with genes involved in malignant transfromation |
| (DGIdb 4.0) |
| Entrez ID | Symbol | Category | Interaction Types | Drug Claim Name | Drug Name | PMIDs |
| Page: 1 |

Copyright 2023-Present -The University of Texas Health Science Center at Houston |