| Tissue | Expression Dynamics | Abbreviation |
| Cervix | 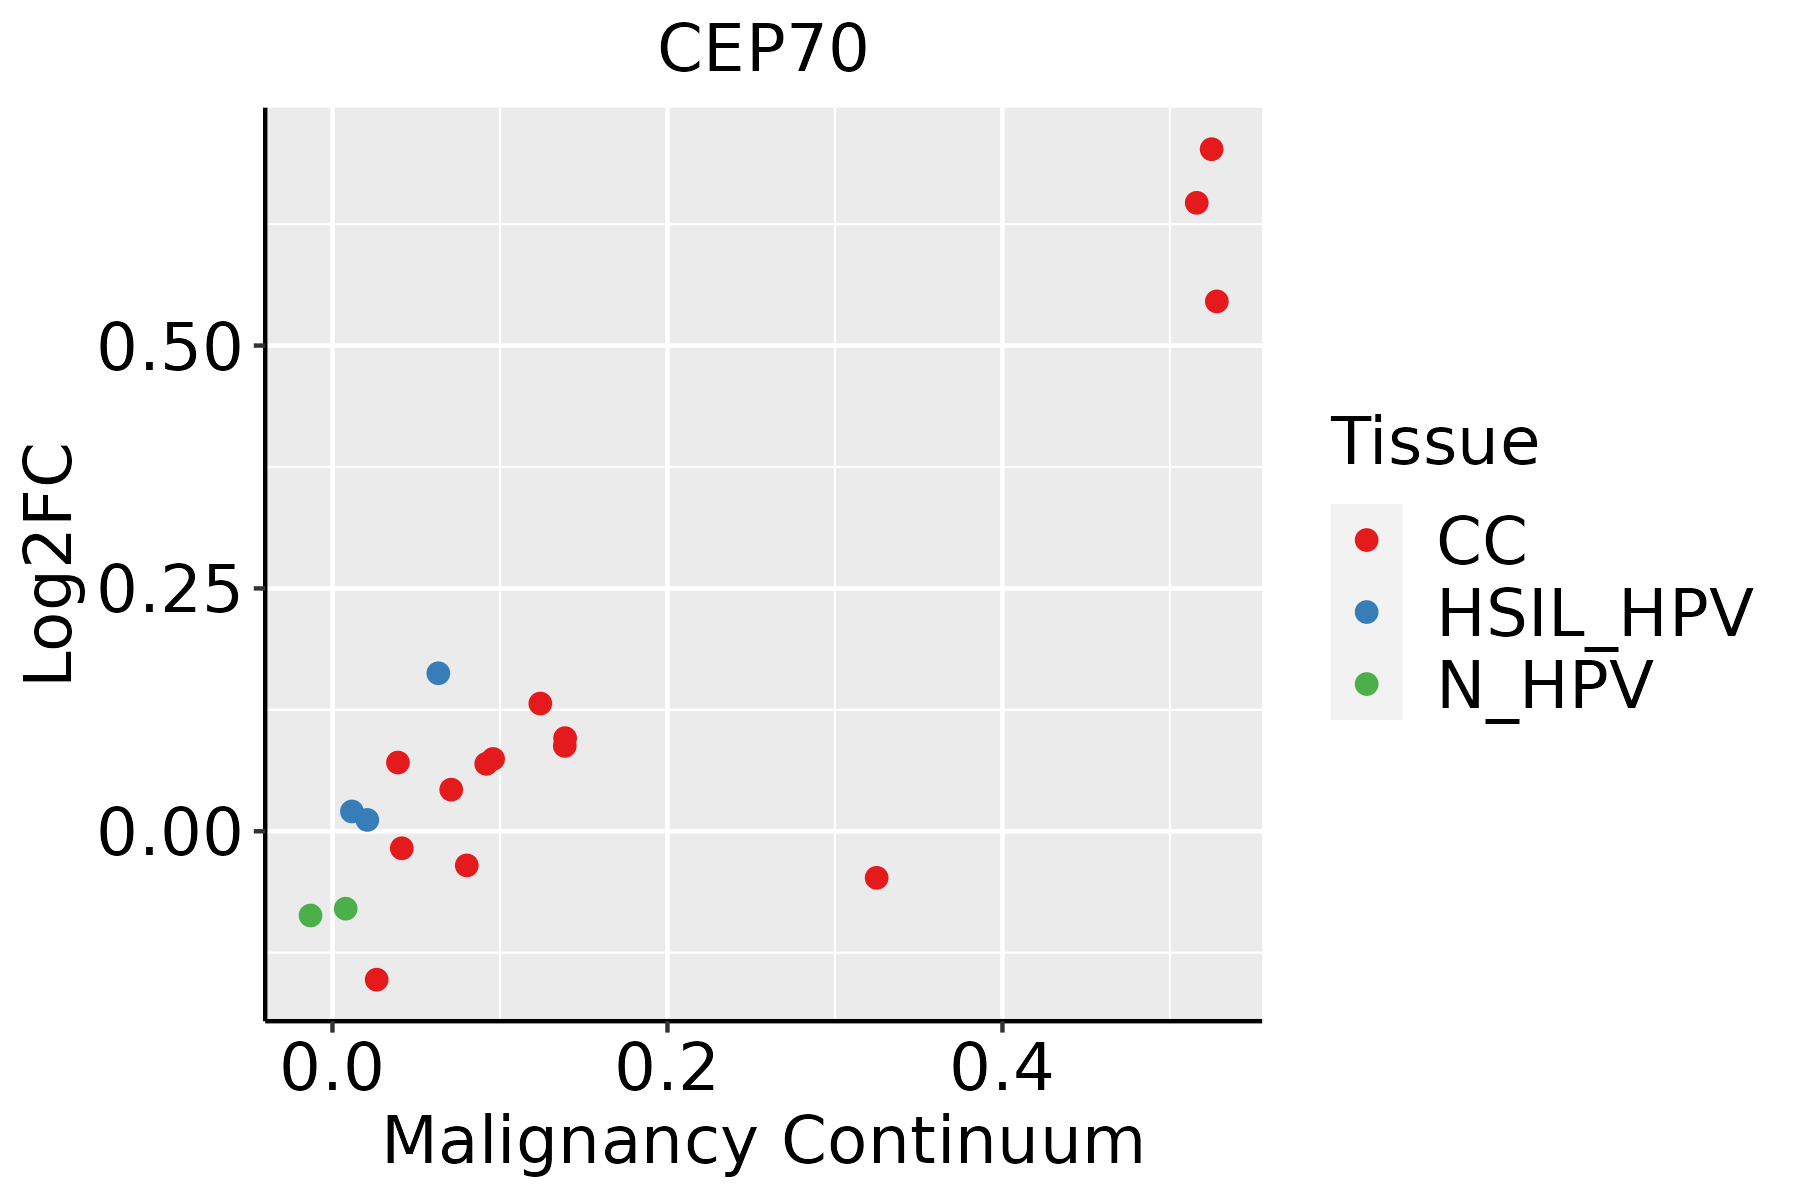 | CC: Cervix cancer |
| HSIL_HPV: HPV-infected high-grade squamous intraepithelial lesions |
| N_HPV: HPV-infected normal cervix |
| Colorectum (GSE201348) |  | FAP: Familial adenomatous polyposis |
| CRC: Colorectal cancer |
| Colorectum (HTA11) |  | AD: Adenomas |
| SER: Sessile serrated lesions |
| MSI-H: Microsatellite-high colorectal cancer |
| MSS: Microsatellite stable colorectal cancer |
| Esophagus |  | ESCC: Esophageal squamous cell carcinoma |
| HGIN: High-grade intraepithelial neoplasias |
| LGIN: Low-grade intraepithelial neoplasias |
| Lung | 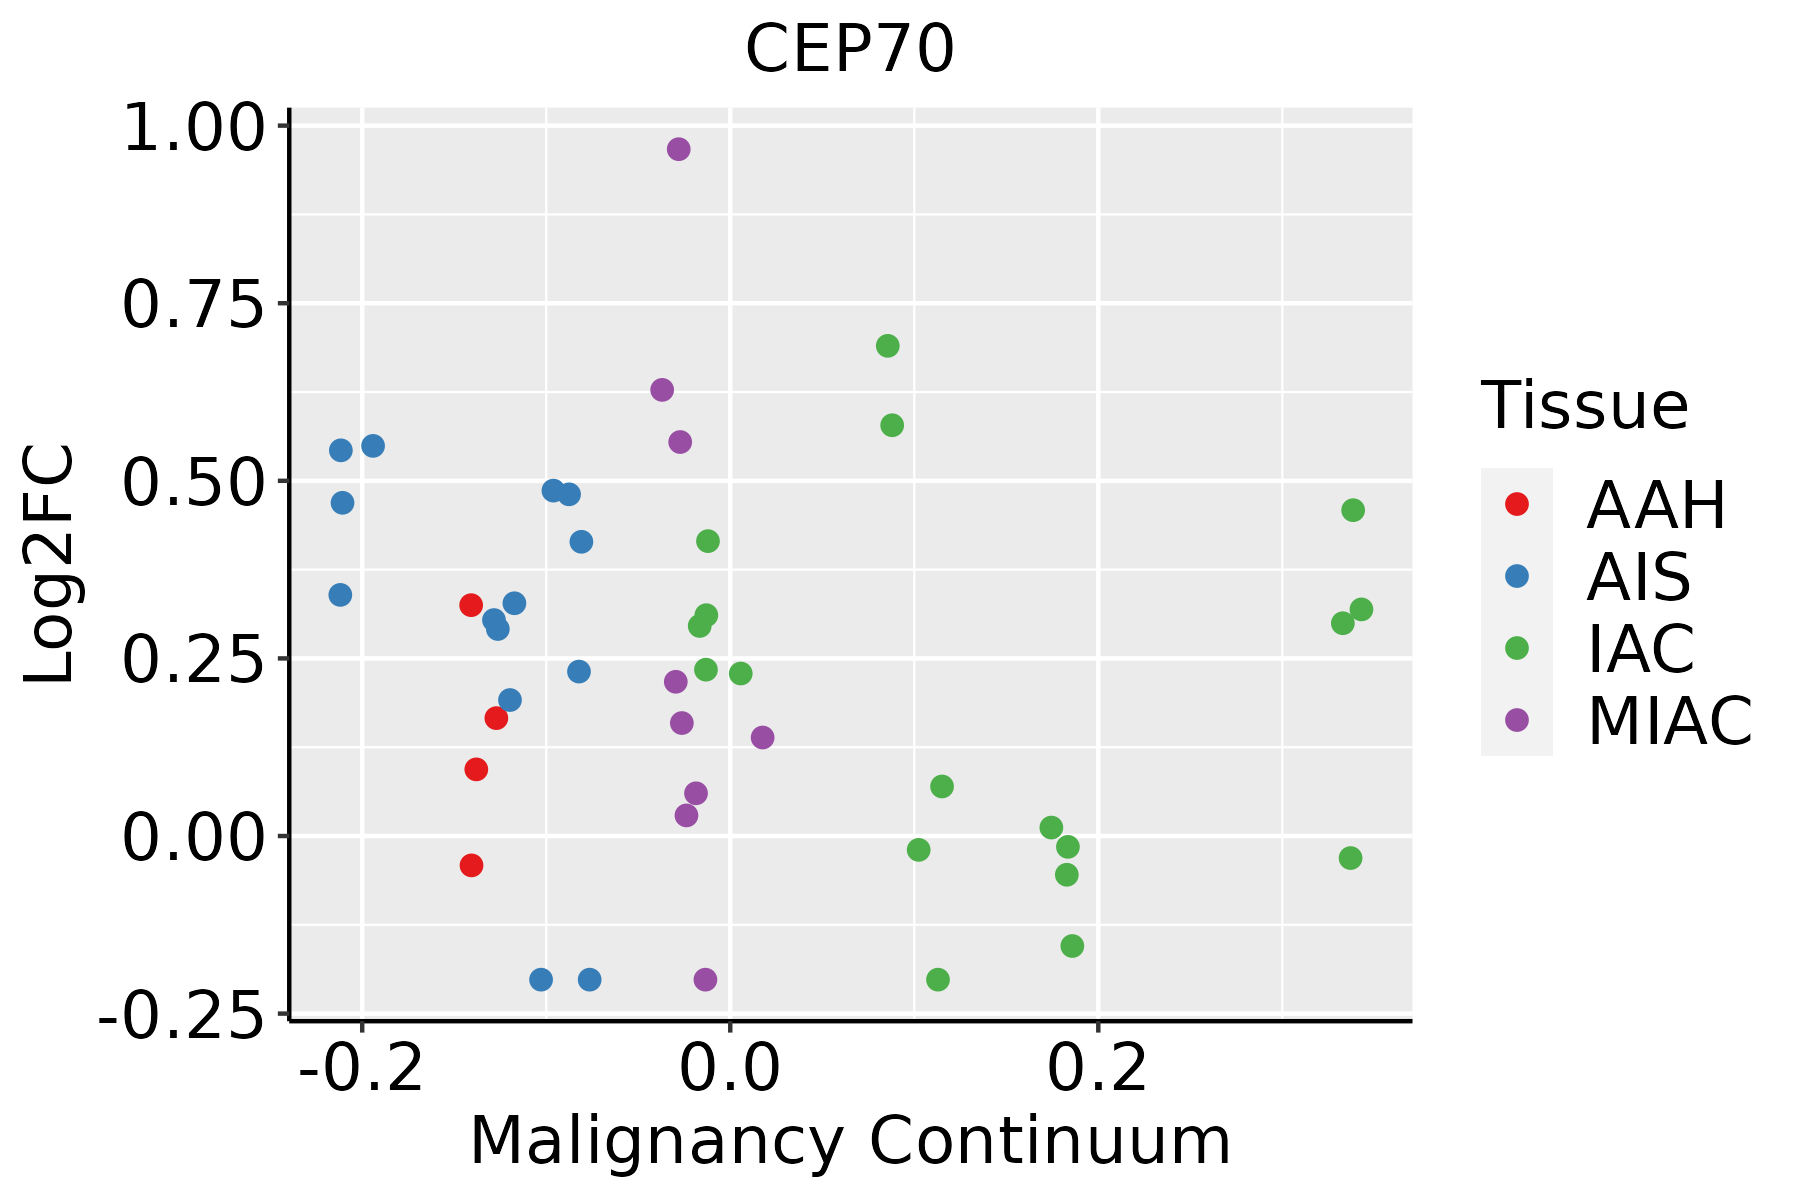 | AAH: Atypical adenomatous hyperplasia |
| AIS: Adenocarcinoma in situ |
| IAC: Invasive lung adenocarcinoma |
| MIA: Minimally invasive adenocarcinoma |
| Oral Cavity | 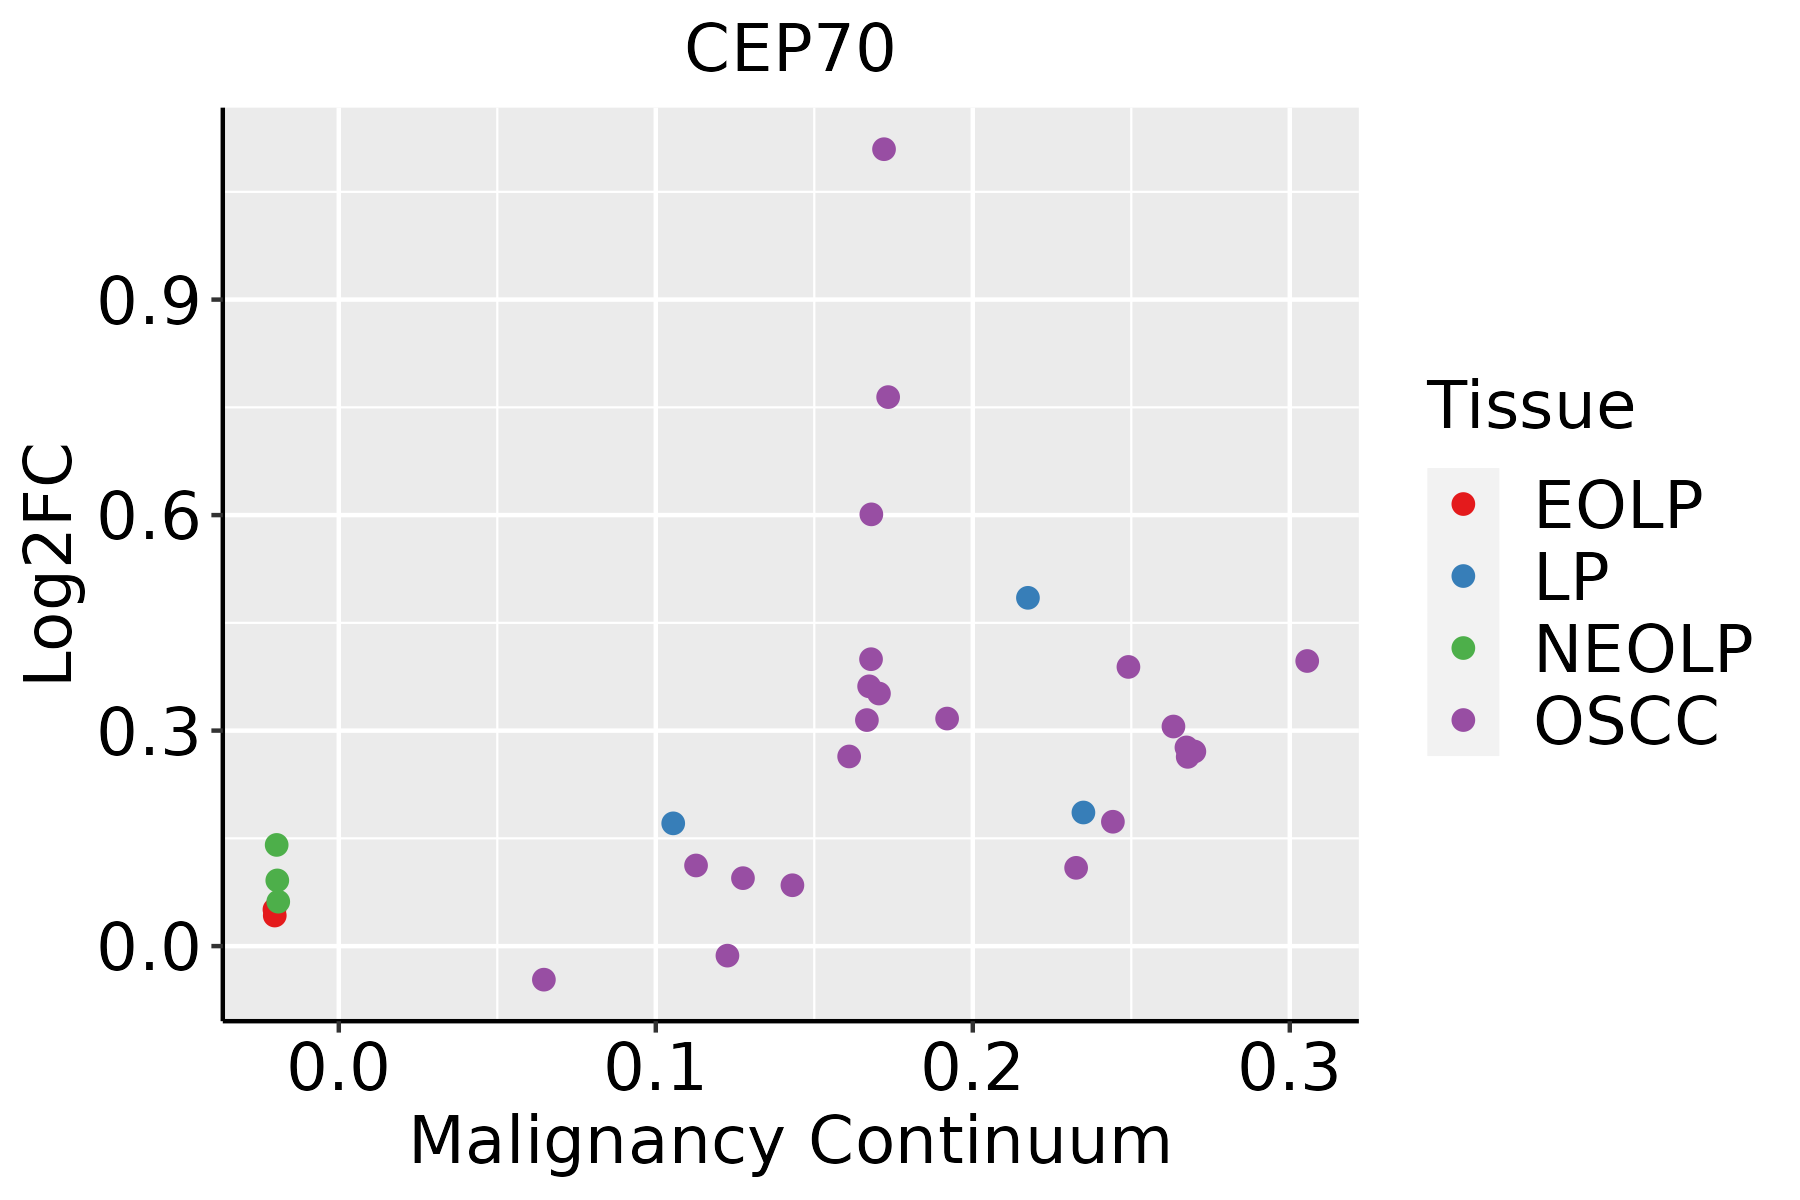 | EOLP: Erosive Oral lichen planus |
| LP: leukoplakia |
| NEOLP: Non-erosive oral lichen planus |
| OSCC: Oral squamous cell carcinoma |
| Prostate | 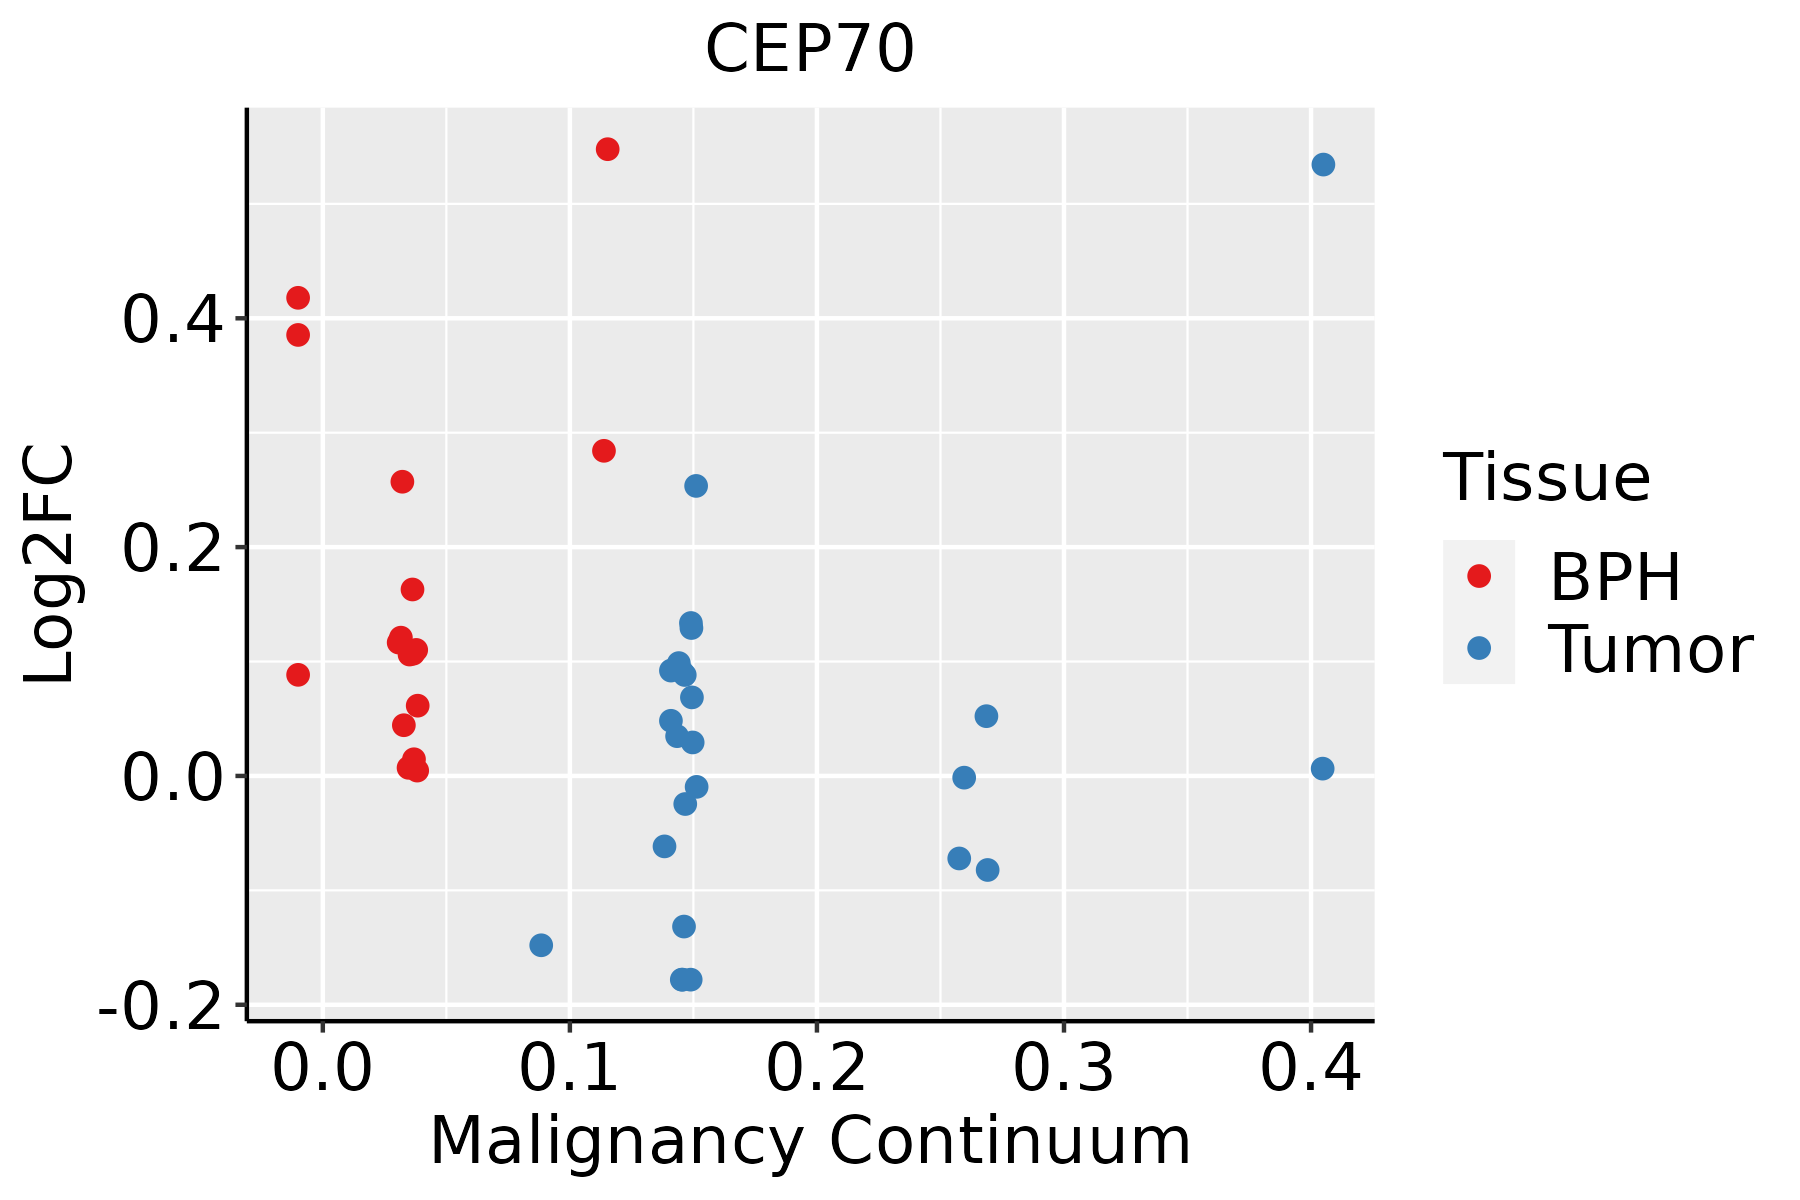 | BPH: Benign Prostatic Hyperplasia |
| Thyroid | 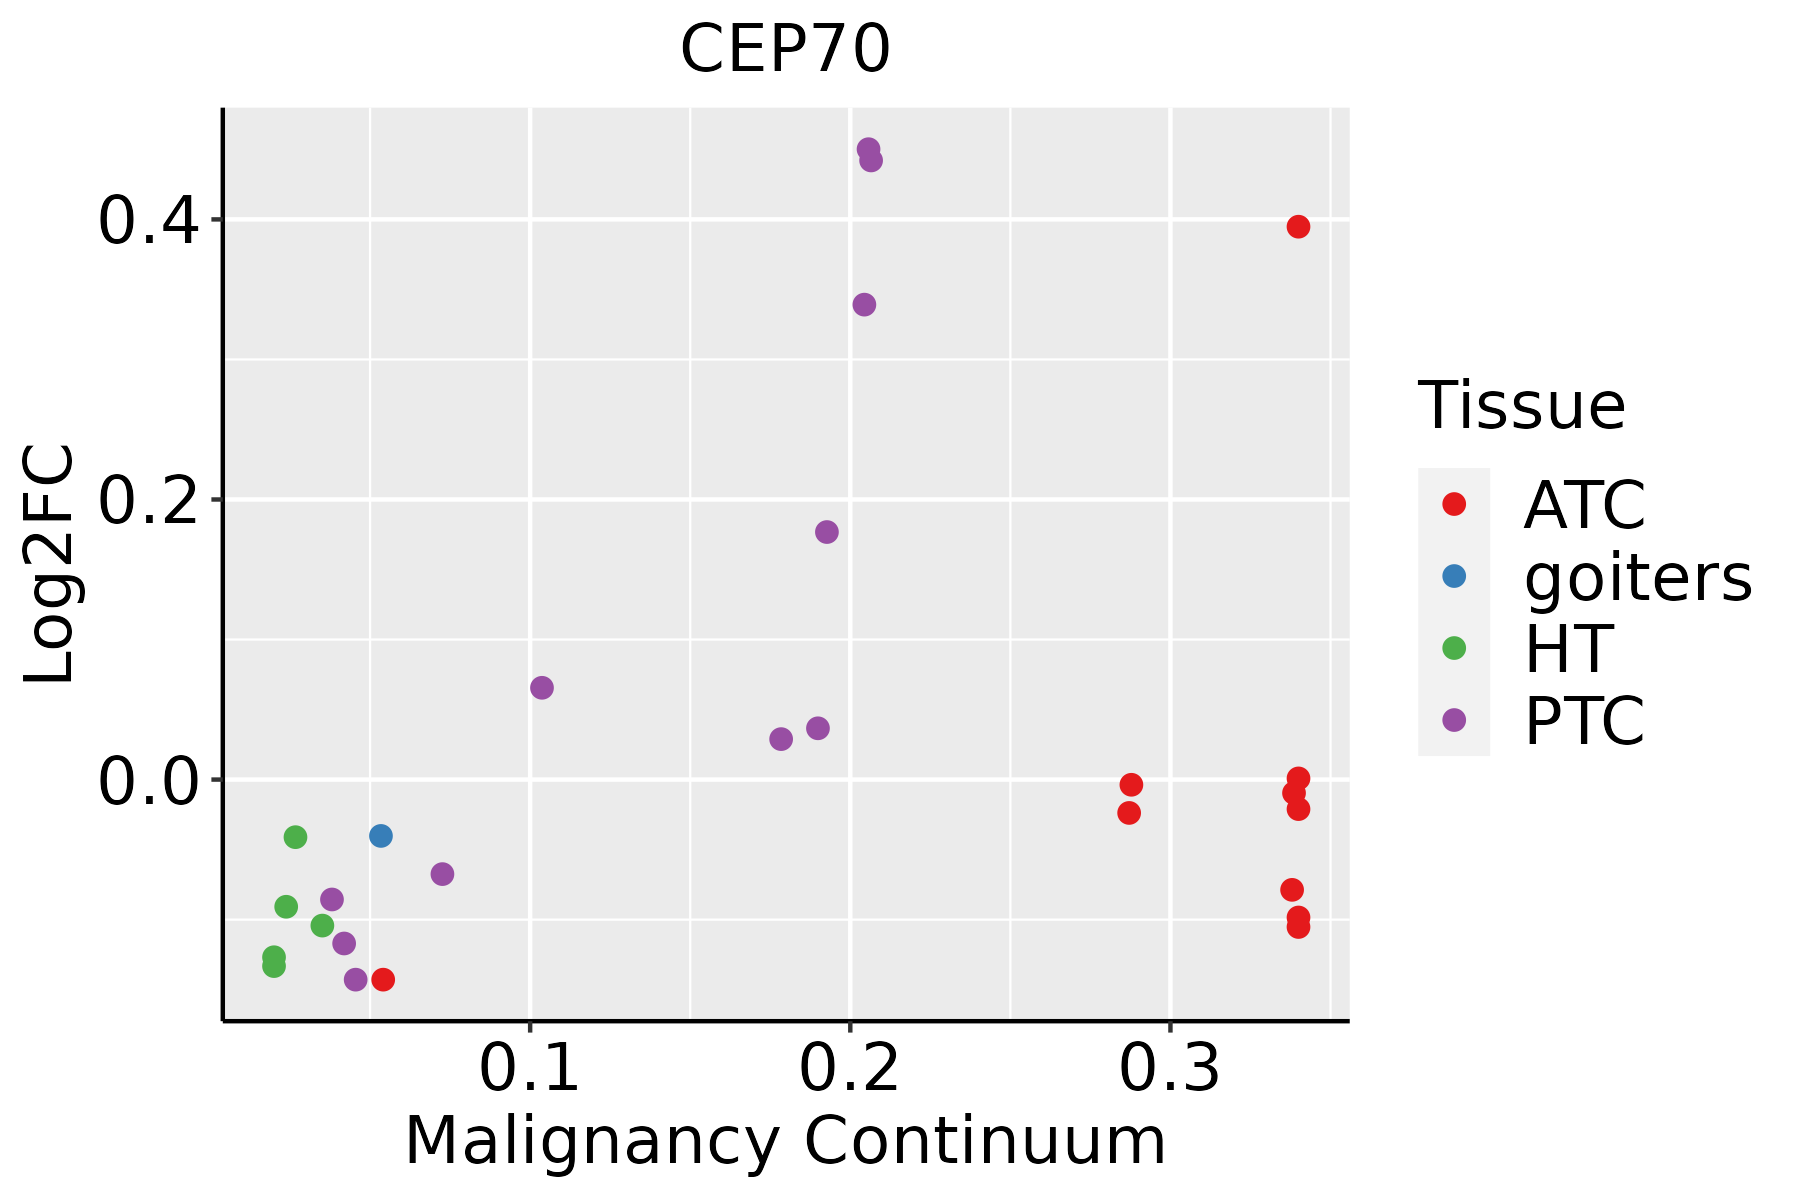 | ATC: Anaplastic thyroid cancer |
| HT: Hashimoto's thyroiditis |
| PTC: Papillary thyroid cancer |
| GO ID | Tissue | Disease Stage | Description | Gene Ratio | Bg Ratio | pvalue | p.adjust | Count |
| GO:00705074 | Cervix | CC | regulation of microtubule cytoskeleton organization | 32/2311 | 148/18723 | 1.02e-03 | 8.51e-03 | 32 |
| GO:0070507 | Colorectum | AD | regulation of microtubule cytoskeleton organization | 44/3918 | 148/18723 | 7.05e-03 | 4.31e-02 | 44 |
| GO:00705071 | Colorectum | CRC | regulation of microtubule cytoskeleton organization | 30/2078 | 148/18723 | 7.75e-04 | 9.87e-03 | 30 |
| GO:00705078 | Esophagus | ESCC | regulation of microtubule cytoskeleton organization | 99/8552 | 148/18723 | 1.43e-07 | 2.29e-06 | 99 |
| GO:00328864 | Esophagus | ESCC | regulation of microtubule-based process | 134/8552 | 240/18723 | 9.44e-04 | 4.80e-03 | 134 |
| GO:00705073 | Lung | IAC | regulation of microtubule cytoskeleton organization | 29/2061 | 148/18723 | 1.44e-03 | 1.55e-02 | 29 |
| GO:0060271 | Lung | IAC | cilium assembly | 55/2061 | 337/18723 | 1.84e-03 | 1.88e-02 | 55 |
| GO:0044782 | Lung | IAC | cilium organization | 58/2061 | 368/18723 | 3.15e-03 | 2.75e-02 | 58 |
| GO:007050712 | Lung | AIS | regulation of microtubule cytoskeleton organization | 28/1849 | 148/18723 | 5.69e-04 | 8.89e-03 | 28 |
| GO:00602711 | Lung | MIAC | cilium assembly | 37/967 | 337/18723 | 1.29e-05 | 9.85e-04 | 37 |
| GO:00447821 | Lung | MIAC | cilium organization | 38/967 | 368/18723 | 3.93e-05 | 2.08e-03 | 38 |
| GO:007050721 | Lung | MIAC | regulation of microtubule cytoskeleton organization | 18/967 | 148/18723 | 6.34e-04 | 1.55e-02 | 18 |
| GO:00328861 | Lung | MIAC | regulation of microtubule-based process | 23/967 | 240/18723 | 3.27e-03 | 4.31e-02 | 23 |
| GO:00705077 | Oral cavity | OSCC | regulation of microtubule cytoskeleton organization | 84/7305 | 148/18723 | 8.80e-06 | 9.33e-05 | 84 |
| GO:00328863 | Oral cavity | OSCC | regulation of microtubule-based process | 115/7305 | 240/18723 | 2.95e-03 | 1.28e-02 | 115 |
| GO:00705076 | Prostate | BPH | regulation of microtubule cytoskeleton organization | 48/3107 | 148/18723 | 1.57e-06 | 2.67e-05 | 48 |
| GO:00328862 | Prostate | BPH | regulation of microtubule-based process | 64/3107 | 240/18723 | 4.93e-05 | 5.11e-04 | 64 |
| GO:007050714 | Prostate | Tumor | regulation of microtubule cytoskeleton organization | 47/3246 | 148/18723 | 1.29e-05 | 1.78e-04 | 47 |
| GO:003288611 | Prostate | Tumor | regulation of microtubule-based process | 65/3246 | 240/18723 | 1.00e-04 | 9.73e-04 | 65 |
| GO:007050717 | Thyroid | PTC | regulation of microtubule cytoskeleton organization | 80/5968 | 148/18723 | 1.79e-08 | 4.19e-07 | 80 |
| Hugo Symbol | Variant Class | Variant Classification | dbSNP RS | HGVSc | HGVSp | HGVSp Short | SWISSPROT | BIOTYPE | SIFT | PolyPhen | Tumor Sample Barcode | Tissue | Histology | Sex | Age | Stage | Therapy Types | Drugs | Outcome |
| CEP70 | SNV | Missense_Mutation | novel | c.546N>T | p.Leu182Phe | p.L182F | Q8NHQ1 | protein_coding | tolerated(0.18) | benign(0.024) | TCGA-3C-AALI-01 | Breast | breast invasive carcinoma | Female | <65 | I/II | Unspecific | Poly E | Complete Response |
| CEP70 | SNV | Missense_Mutation | | c.1717N>G | p.Leu573Val | p.L573V | Q8NHQ1 | protein_coding | deleterious(0) | probably_damaging(0.939) | TCGA-A2-A0T0-01 | Breast | breast invasive carcinoma | Female | <65 | I/II | Chemotherapy | taxotere | SD |
| CEP70 | SNV | Missense_Mutation | | c.146G>A | p.Arg49Lys | p.R49K | Q8NHQ1 | protein_coding | tolerated(0.83) | benign(0.007) | TCGA-A2-A259-01 | Breast | breast invasive carcinoma | Female | >=65 | I/II | Hormone Therapy | arimidex | SD |
| CEP70 | SNV | Missense_Mutation | novel | c.1436N>A | p.Val479Glu | p.V479E | Q8NHQ1 | protein_coding | deleterious(0) | probably_damaging(0.997) | TCGA-A2-A4S1-01 | Breast | breast invasive carcinoma | Female | >=65 | I/II | Unknown | Unknown | SD |
| CEP70 | SNV | Missense_Mutation | rs779132771 | c.565N>T | p.Arg189Cys | p.R189C | Q8NHQ1 | protein_coding | deleterious(0) | probably_damaging(0.992) | TCGA-AN-A046-01 | Breast | breast invasive carcinoma | Female | >=65 | I/II | Unknown | Unknown | SD |
| CEP70 | SNV | Missense_Mutation | | c.1644N>G | p.Asp548Glu | p.D548E | Q8NHQ1 | protein_coding | deleterious(0) | benign(0.066) | TCGA-AR-A0TZ-01 | Breast | breast invasive carcinoma | Female | <65 | III/IV | Unspecific | Doxorubicin | PD |
| CEP70 | SNV | Missense_Mutation | | c.1199N>A | p.Ala400Glu | p.A400E | Q8NHQ1 | protein_coding | deleterious(0) | benign(0.354) | TCGA-BH-A18H-01 | Breast | breast invasive carcinoma | Female | <65 | I/II | Chemotherapy | adriamycin | CR |
| CEP70 | SNV | Missense_Mutation | novel | c.398C>T | p.Ser133Leu | p.S133L | Q8NHQ1 | protein_coding | tolerated(0.11) | probably_damaging(0.996) | TCGA-BH-A2L8-01 | Breast | breast invasive carcinoma | Female | <65 | I/II | Chemotherapy | cytoxan | CR |
| CEP70 | SNV | Missense_Mutation | novel | c.665N>G | p.Ser222Cys | p.S222C | Q8NHQ1 | protein_coding | tolerated(0.06) | benign(0.01) | TCGA-PE-A5DE-01 | Breast | breast invasive carcinoma | Female | <65 | I/II | Chemotherapy | taxotere | CR |
| CEP70 | insertion | Frame_Shift_Ins | novel | c.1127_1128insAACC | p.Gln377ThrfsTer5 | p.Q377Tfs*5 | Q8NHQ1 | protein_coding | | | TCGA-AR-A0U0-01 | Breast | breast invasive carcinoma | Female | >=65 | I/II | Unknown | Unknown | SD |


