
|
|||||
|
 | |
| |
| |
| |
| |
| |
|
Gene: CEP250 |
Gene summary for CEP250 |
| Gene information | Species | Human | Gene symbol | CEP250 | Gene ID | 11190 |
| Gene name | centrosomal protein 250 | |
| Gene Alias | C-NAP1 | |
| Cytomap | 20q11.22 | |
| Gene Type | protein-coding | GO ID | GO:0000226 | UniProtAcc | Q9BV73 |
Top |
Malignant transformation analysis |
| Identification of the aberrant gene expression in precancerous and cancerous lesions by comparing the gene expression of stem-like cells in diseased tissues with normal stem cells |
| Entrez ID | Symbol | Replicates | Species | Organ | Tissue | Adj P-value | Log2FC | Malignancy |
| 11190 | CEP250 | P24T-E | Human | Esophagus | ESCC | 2.28e-04 | 8.69e-02 | 0.1287 |
| 11190 | CEP250 | P26T-E | Human | Esophagus | ESCC | 1.58e-33 | 6.34e-01 | 0.1276 |
| 11190 | CEP250 | P27T-E | Human | Esophagus | ESCC | 5.58e-05 | 1.94e-01 | 0.1055 |
| 11190 | CEP250 | P28T-E | Human | Esophagus | ESCC | 5.28e-10 | 3.11e-01 | 0.1149 |
| 11190 | CEP250 | P30T-E | Human | Esophagus | ESCC | 4.63e-06 | 2.33e-01 | 0.137 |
| 11190 | CEP250 | P31T-E | Human | Esophagus | ESCC | 6.59e-12 | 2.43e-01 | 0.1251 |
| 11190 | CEP250 | P32T-E | Human | Esophagus | ESCC | 4.65e-15 | 3.86e-01 | 0.1666 |
| 11190 | CEP250 | P36T-E | Human | Esophagus | ESCC | 2.98e-10 | 3.81e-01 | 0.1187 |
| 11190 | CEP250 | P37T-E | Human | Esophagus | ESCC | 5.84e-15 | 3.30e-01 | 0.1371 |
| 11190 | CEP250 | P39T-E | Human | Esophagus | ESCC | 9.37e-05 | 1.22e-01 | 0.0894 |
| 11190 | CEP250 | P42T-E | Human | Esophagus | ESCC | 4.69e-05 | 1.69e-01 | 0.1175 |
| 11190 | CEP250 | P44T-E | Human | Esophagus | ESCC | 1.71e-02 | 1.56e-01 | 0.1096 |
| 11190 | CEP250 | P47T-E | Human | Esophagus | ESCC | 4.78e-06 | 1.99e-01 | 0.1067 |
| 11190 | CEP250 | P48T-E | Human | Esophagus | ESCC | 6.37e-10 | 2.70e-01 | 0.0959 |
| 11190 | CEP250 | P49T-E | Human | Esophagus | ESCC | 3.09e-15 | 8.26e-01 | 0.1768 |
| 11190 | CEP250 | P52T-E | Human | Esophagus | ESCC | 2.53e-16 | 4.04e-01 | 0.1555 |
| 11190 | CEP250 | P54T-E | Human | Esophagus | ESCC | 2.00e-10 | 2.53e-01 | 0.0975 |
| 11190 | CEP250 | P56T-E | Human | Esophagus | ESCC | 4.48e-09 | 8.51e-01 | 0.1613 |
| 11190 | CEP250 | P57T-E | Human | Esophagus | ESCC | 7.72e-05 | 1.37e-01 | 0.0926 |
| 11190 | CEP250 | P61T-E | Human | Esophagus | ESCC | 6.68e-19 | 4.62e-01 | 0.099 |
| Page: 1 2 3 4 |
| Tissue | Expression Dynamics | Abbreviation |
| Esophagus |  | ESCC: Esophageal squamous cell carcinoma |
| HGIN: High-grade intraepithelial neoplasias | ||
| LGIN: Low-grade intraepithelial neoplasias | ||
| Liver | 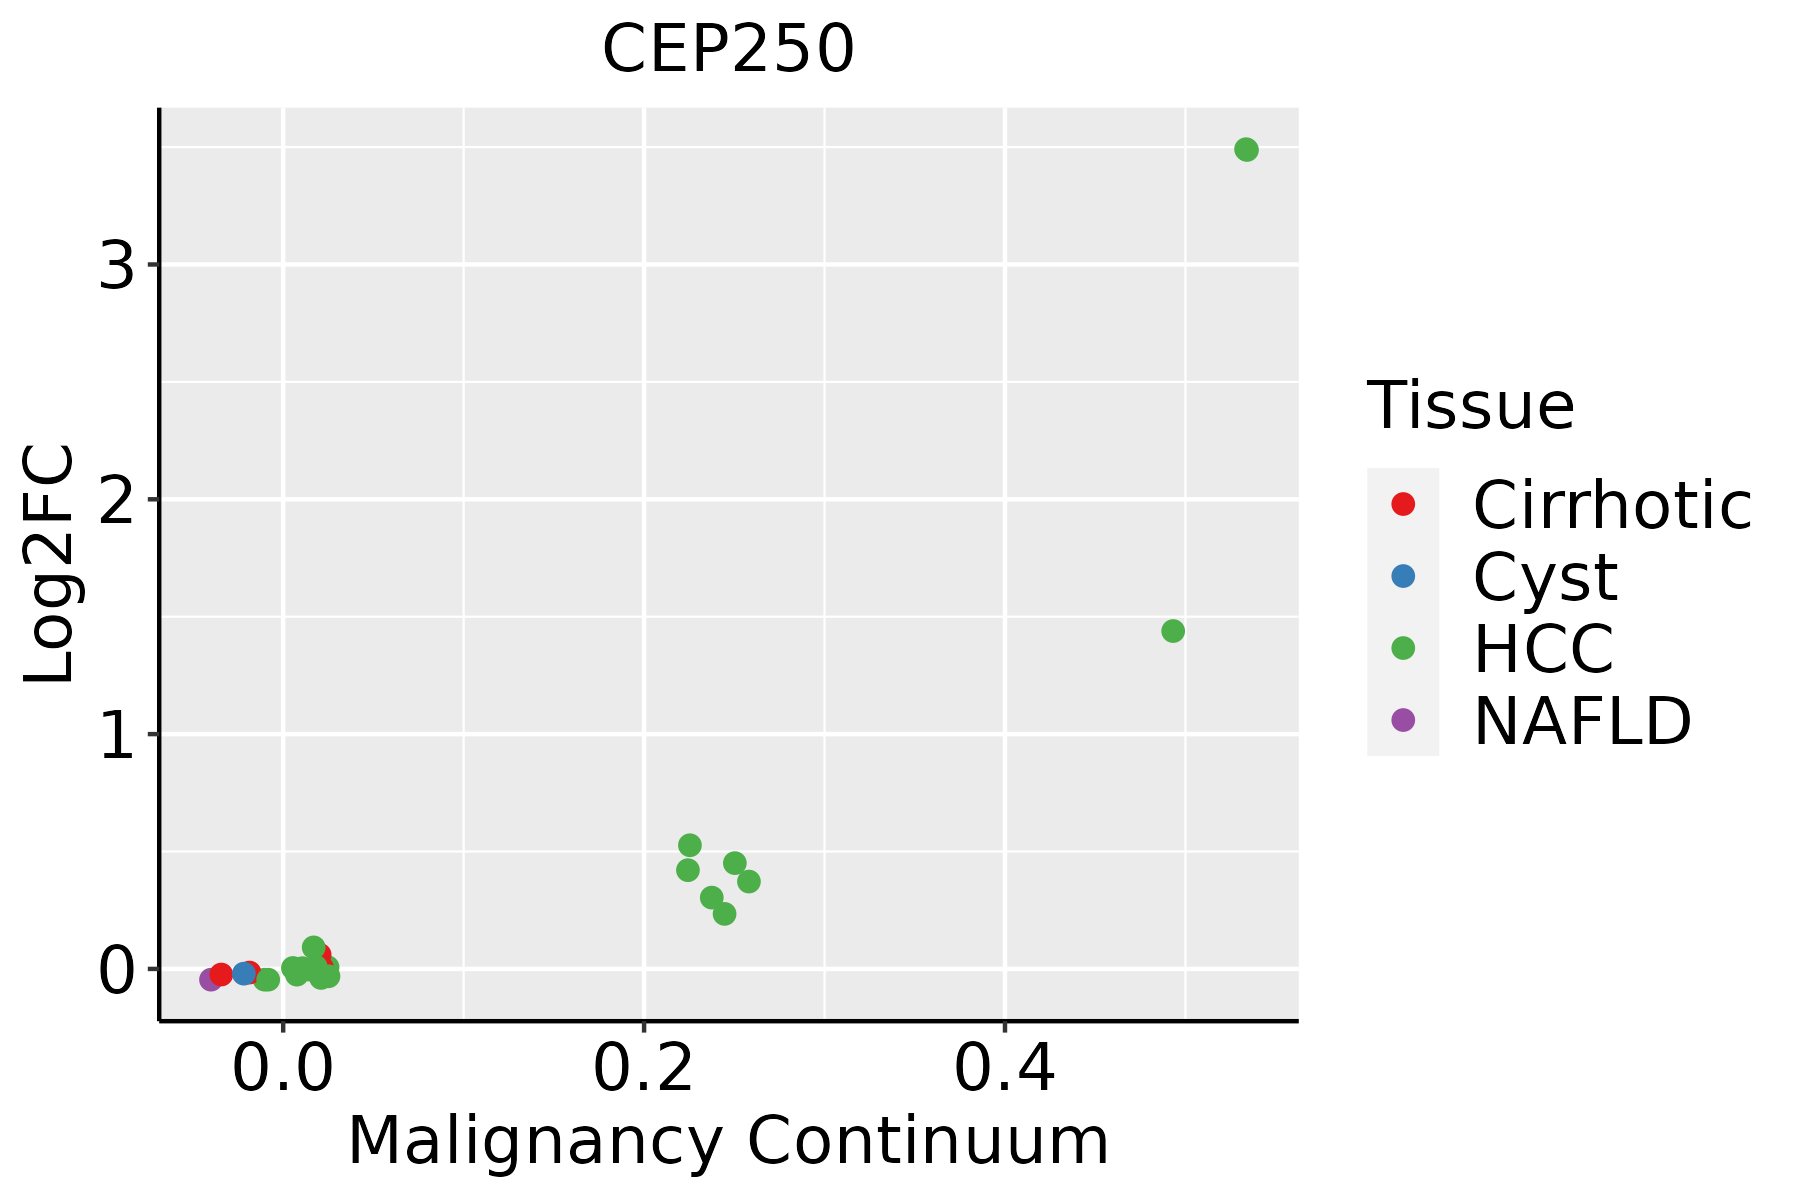 | HCC: Hepatocellular carcinoma |
| NAFLD: Non-alcoholic fatty liver disease |
| ∗log2FC in expression of this searched gene in stem-like cells from each diseased tissue sample relative to stem-like cells in normal samples in each tissue plotted against the malignancy continuum. Samples are colored based on if they are from different disease stage. |
Top |
Malignant transformation related pathway analysis |
| Find out the enriched GO biological processes and KEGG pathways involved in transition from healthy to precancer to cancer |
| Tissue | Disease Stage | Enriched GO biological Processes |
| Colorectum | AD |  |
| Colorectum | SER |  |
| Colorectum | MSS |  |
| Colorectum | MSI-H |  |
| Colorectum | FAP |  |
| ∗Top 15 enriched GO BP terms are showed in the bar plot of each disease state in each tissue. Each row represents a significant GO biological process which is colored according to the -log10(p.adjust). |
| Page: 1 2 3 4 5 6 7 8 9 |
| GO ID | Tissue | Disease Stage | Description | Gene Ratio | Bg Ratio | pvalue | p.adjust | Count |
| GO:1903829111 | Esophagus | ESCC | positive regulation of cellular protein localization | 199/8552 | 276/18723 | 2.99e-19 | 3.45e-17 | 199 |
| GO:000931419 | Esophagus | ESCC | response to radiation | 277/8552 | 456/18723 | 4.42e-11 | 1.43e-09 | 277 |
| GO:00726985 | Esophagus | ESCC | protein localization to microtubule cytoskeleton | 43/8552 | 54/18723 | 3.28e-07 | 4.61e-06 | 43 |
| GO:00443804 | Esophagus | ESCC | protein localization to cytoskeleton | 45/8552 | 58/18723 | 6.89e-07 | 8.99e-06 | 45 |
| GO:00070982 | Esophagus | ESCC | centrosome cycle | 85/8552 | 130/18723 | 4.41e-06 | 4.69e-05 | 85 |
| GO:00310233 | Esophagus | ESCC | microtubule organizing center organization | 92/8552 | 143/18723 | 5.04e-06 | 5.31e-05 | 92 |
| GO:000941611 | Esophagus | ESCC | response to light stimulus | 183/8552 | 320/18723 | 2.03e-05 | 1.76e-04 | 183 |
| GO:19055086 | Esophagus | ESCC | protein localization to microtubule organizing center | 28/8552 | 35/18723 | 3.40e-05 | 2.78e-04 | 28 |
| GO:00715396 | Esophagus | ESCC | protein localization to centrosome | 26/8552 | 33/18723 | 1.06e-04 | 7.43e-04 | 26 |
| GO:0010457 | Esophagus | ESCC | centriole-centriole cohesion | 12/8552 | 14/18723 | 2.51e-03 | 1.08e-02 | 12 |
| GO:19055153 | Esophagus | ESCC | non-motile cilium assembly | 39/8552 | 61/18723 | 3.08e-03 | 1.28e-02 | 39 |
| GO:190382922 | Liver | HCC | positive regulation of cellular protein localization | 199/7958 | 276/18723 | 1.15e-23 | 2.62e-21 | 199 |
| GO:0031023 | Liver | HCC | microtubule organizing center organization | 82/7958 | 143/18723 | 2.38e-04 | 1.79e-03 | 82 |
| GO:0007098 | Liver | HCC | centrosome cycle | 75/7958 | 130/18723 | 3.33e-04 | 2.34e-03 | 75 |
| GO:00443802 | Liver | HCC | protein localization to cytoskeleton | 38/7958 | 58/18723 | 3.37e-04 | 2.36e-03 | 38 |
| GO:007269811 | Liver | HCC | protein localization to microtubule cytoskeleton | 35/7958 | 54/18723 | 7.73e-04 | 4.65e-03 | 35 |
| GO:00093146 | Liver | HCC | response to radiation | 223/7958 | 456/18723 | 3.08e-03 | 1.43e-02 | 223 |
| GO:190550811 | Liver | HCC | protein localization to microtubule organizing center | 23/7958 | 35/18723 | 4.72e-03 | 2.02e-02 | 23 |
| GO:007153911 | Liver | HCC | protein localization to centrosome | 21/7958 | 33/18723 | 1.16e-02 | 4.28e-02 | 21 |
| Page: 1 |
| Pathway ID | Tissue | Disease Stage | Description | Gene Ratio | Bg Ratio | pvalue | p.adjust | qvalue | Count |
| Page: 1 |
Top |
Cell-cell communication analysis |
| Identification of potential cell-cell interactions between two cell types and their ligand-receptor pairs for different disease states |
| Ligand | Receptor | LRpair | Pathway | Tissue | Disease Stage |
| Page: 1 |
Top |
Single-cell gene regulatory network inference analysis |
| Find out the significant the regulons (TFs) and the target genes of each regulon across cell types for different disease states |
| TF | Cell Type | Tissue | Disease Stage | Target Gene | RSS | Regulon Activity |
| ∗The dot plots of a searched regulon are shown for all cell subpopulations in each disease state of each tissue based on the regulon specific score inferred using pySCENIC and by calculating the average expression. |
| Page: 1 |
Top |
Somatic mutation of malignant transformation related genes |
| Annotation of somatic variants for genes involved in malignant transformation |
| Hugo Symbol | Variant Class | Variant Classification | dbSNP RS | HGVSc | HGVSp | HGVSp Short | SWISSPROT | BIOTYPE | SIFT | PolyPhen | Tumor Sample Barcode | Tissue | Histology | Sex | Age | Stage | Therapy Types | Drugs | Outcome |
| CEP250 | SNV | Missense_Mutation | c.3691N>A | p.Pro1231Thr | p.P1231T | Q9BV73 | protein_coding | tolerated(0.23) | benign(0.073) | TCGA-A2-A0CX-01 | Breast | breast invasive carcinoma | Female | <65 | I/II | Chemotherapy | adriamycin | SD | |
| CEP250 | SNV | Missense_Mutation | c.1636N>G | p.Arg546Gly | p.R546G | Q9BV73 | protein_coding | deleterious(0.01) | benign(0.188) | TCGA-A8-A079-01 | Breast | breast invasive carcinoma | Female | >=65 | III/IV | Chemotherapy | 5-fluorouracil | SD | |
| CEP250 | SNV | Missense_Mutation | novel | c.1045A>C | p.Thr349Pro | p.T349P | Q9BV73 | protein_coding | deleterious(0) | possibly_damaging(0.839) | TCGA-A8-A09E-01 | Breast | breast invasive carcinoma | Female | >=65 | III/IV | Hormone Therapy | anastrozole | SD |
| CEP250 | SNV | Missense_Mutation | c.4303G>C | p.Glu1435Gln | p.E1435Q | Q9BV73 | protein_coding | tolerated(0.2) | benign(0.045) | TCGA-AC-A23H-01 | Breast | breast invasive carcinoma | Female | >=65 | I/II | Unknown | Unknown | PD | |
| CEP250 | SNV | Missense_Mutation | rs542508593 | c.6479N>C | p.Arg2160Thr | p.R2160T | Q9BV73 | protein_coding | deleterious(0) | possibly_damaging(0.647) | TCGA-AC-A62V-01 | Breast | breast invasive carcinoma | Male | <65 | III/IV | Targeted Molecular therapy | denosumab | PD |
| CEP250 | SNV | Missense_Mutation | rs759294916 | c.6449N>A | p.Arg2150Gln | p.R2150Q | Q9BV73 | protein_coding | tolerated(0.93) | benign(0.001) | TCGA-AN-A0FY-01 | Breast | breast invasive carcinoma | Female | <65 | I/II | Unknown | Unknown | SD |
| CEP250 | SNV | Missense_Mutation | c.3067G>A | p.Asp1023Asn | p.D1023N | Q9BV73 | protein_coding | tolerated(0.06) | benign(0.003) | TCGA-AN-A0XW-01 | Breast | breast invasive carcinoma | Female | <65 | III/IV | Unknown | Unknown | SD | |
| CEP250 | SNV | Missense_Mutation | c.416A>G | p.Glu139Gly | p.E139G | Q9BV73 | protein_coding | tolerated(1) | benign(0.01) | TCGA-AO-A128-01 | Breast | breast invasive carcinoma | Female | <65 | I/II | Chemotherapy | doxorubicin | SD | |
| CEP250 | SNV | Missense_Mutation | novel | c.6974N>C | p.Ile2325Thr | p.I2325T | Q9BV73 | protein_coding | tolerated(0.36) | benign(0.001) | TCGA-B6-A0IJ-01 | Breast | breast invasive carcinoma | Female | <65 | I/II | Unknown | Unknown | SD |
| CEP250 | SNV | Missense_Mutation | rs377120249 | c.3517G>A | p.Gly1173Arg | p.G1173R | Q9BV73 | protein_coding | deleterious(0.01) | benign(0.035) | TCGA-BH-A5J0-01 | Breast | breast invasive carcinoma | Female | <65 | I/II | Unknown | Unknown | SD |
| Page: 1 2 3 4 5 6 7 8 9 10 11 12 13 14 15 16 17 18 19 |
Top |
Related drugs of malignant transformation related genes |
| Identification of chemicals and drugs interact with genes involved in malignant transfromation |
| (DGIdb 4.0) |
| Entrez ID | Symbol | Category | Interaction Types | Drug Claim Name | Drug Name | PMIDs |
| Page: 1 |

Copyright 2023-Present -The University of Texas Health Science Center at Houston |