
|
|||||
|
 | |
| |
| |
| |
| |
| |
|
Gene: CENPU |
Gene summary for CENPU |
| Gene information | Species | Human | Gene symbol | CENPU | Gene ID | 79682 |
| Gene name | centromere protein U | |
| Gene Alias | CENP50 | |
| Cytomap | 4q35.1 | |
| Gene Type | protein-coding | GO ID | GO:0007275 | UniProtAcc | Q71F23 |
Top |
Malignant transformation analysis |
| Identification of the aberrant gene expression in precancerous and cancerous lesions by comparing the gene expression of stem-like cells in diseased tissues with normal stem cells |
| Entrez ID | Symbol | Replicates | Species | Organ | Tissue | Adj P-value | Log2FC | Malignancy |
| 79682 | CENPU | P36T-E | Human | Esophagus | ESCC | 3.77e-05 | 4.41e-01 | 0.1187 |
| 79682 | CENPU | P37T-E | Human | Esophagus | ESCC | 1.79e-08 | 2.83e-01 | 0.1371 |
| 79682 | CENPU | P38T-E | Human | Esophagus | ESCC | 1.50e-06 | 3.96e-01 | 0.127 |
| 79682 | CENPU | P39T-E | Human | Esophagus | ESCC | 3.97e-04 | 1.84e-01 | 0.0894 |
| 79682 | CENPU | P42T-E | Human | Esophagus | ESCC | 4.31e-05 | 3.13e-01 | 0.1175 |
| 79682 | CENPU | P47T-E | Human | Esophagus | ESCC | 3.75e-03 | 1.16e-01 | 0.1067 |
| 79682 | CENPU | P48T-E | Human | Esophagus | ESCC | 1.78e-03 | 1.55e-01 | 0.0959 |
| 79682 | CENPU | P49T-E | Human | Esophagus | ESCC | 4.13e-05 | 7.98e-01 | 0.1768 |
| 79682 | CENPU | P52T-E | Human | Esophagus | ESCC | 1.75e-25 | 6.39e-01 | 0.1555 |
| 79682 | CENPU | P54T-E | Human | Esophagus | ESCC | 4.05e-12 | 4.47e-01 | 0.0975 |
| 79682 | CENPU | P62T-E | Human | Esophagus | ESCC | 2.41e-04 | 3.01e-01 | 0.1302 |
| 79682 | CENPU | P65T-E | Human | Esophagus | ESCC | 3.11e-09 | 3.20e-01 | 0.0978 |
| 79682 | CENPU | P74T-E | Human | Esophagus | ESCC | 1.89e-21 | 7.92e-01 | 0.1479 |
| 79682 | CENPU | P75T-E | Human | Esophagus | ESCC | 4.41e-07 | 2.23e-01 | 0.1125 |
| 79682 | CENPU | P76T-E | Human | Esophagus | ESCC | 1.35e-23 | 6.71e-01 | 0.1207 |
| 79682 | CENPU | P79T-E | Human | Esophagus | ESCC | 4.19e-25 | 6.28e-01 | 0.1154 |
| 79682 | CENPU | P80T-E | Human | Esophagus | ESCC | 1.19e-10 | 5.02e-01 | 0.155 |
| 79682 | CENPU | P82T-E | Human | Esophagus | ESCC | 9.18e-03 | 4.55e-01 | 0.1072 |
| 79682 | CENPU | P83T-E | Human | Esophagus | ESCC | 2.47e-22 | 8.34e-01 | 0.1738 |
| 79682 | CENPU | P89T-E | Human | Esophagus | ESCC | 9.28e-07 | 5.09e-01 | 0.1752 |
| Page: 1 2 3 4 |
| Tissue | Expression Dynamics | Abbreviation |
| Esophagus | 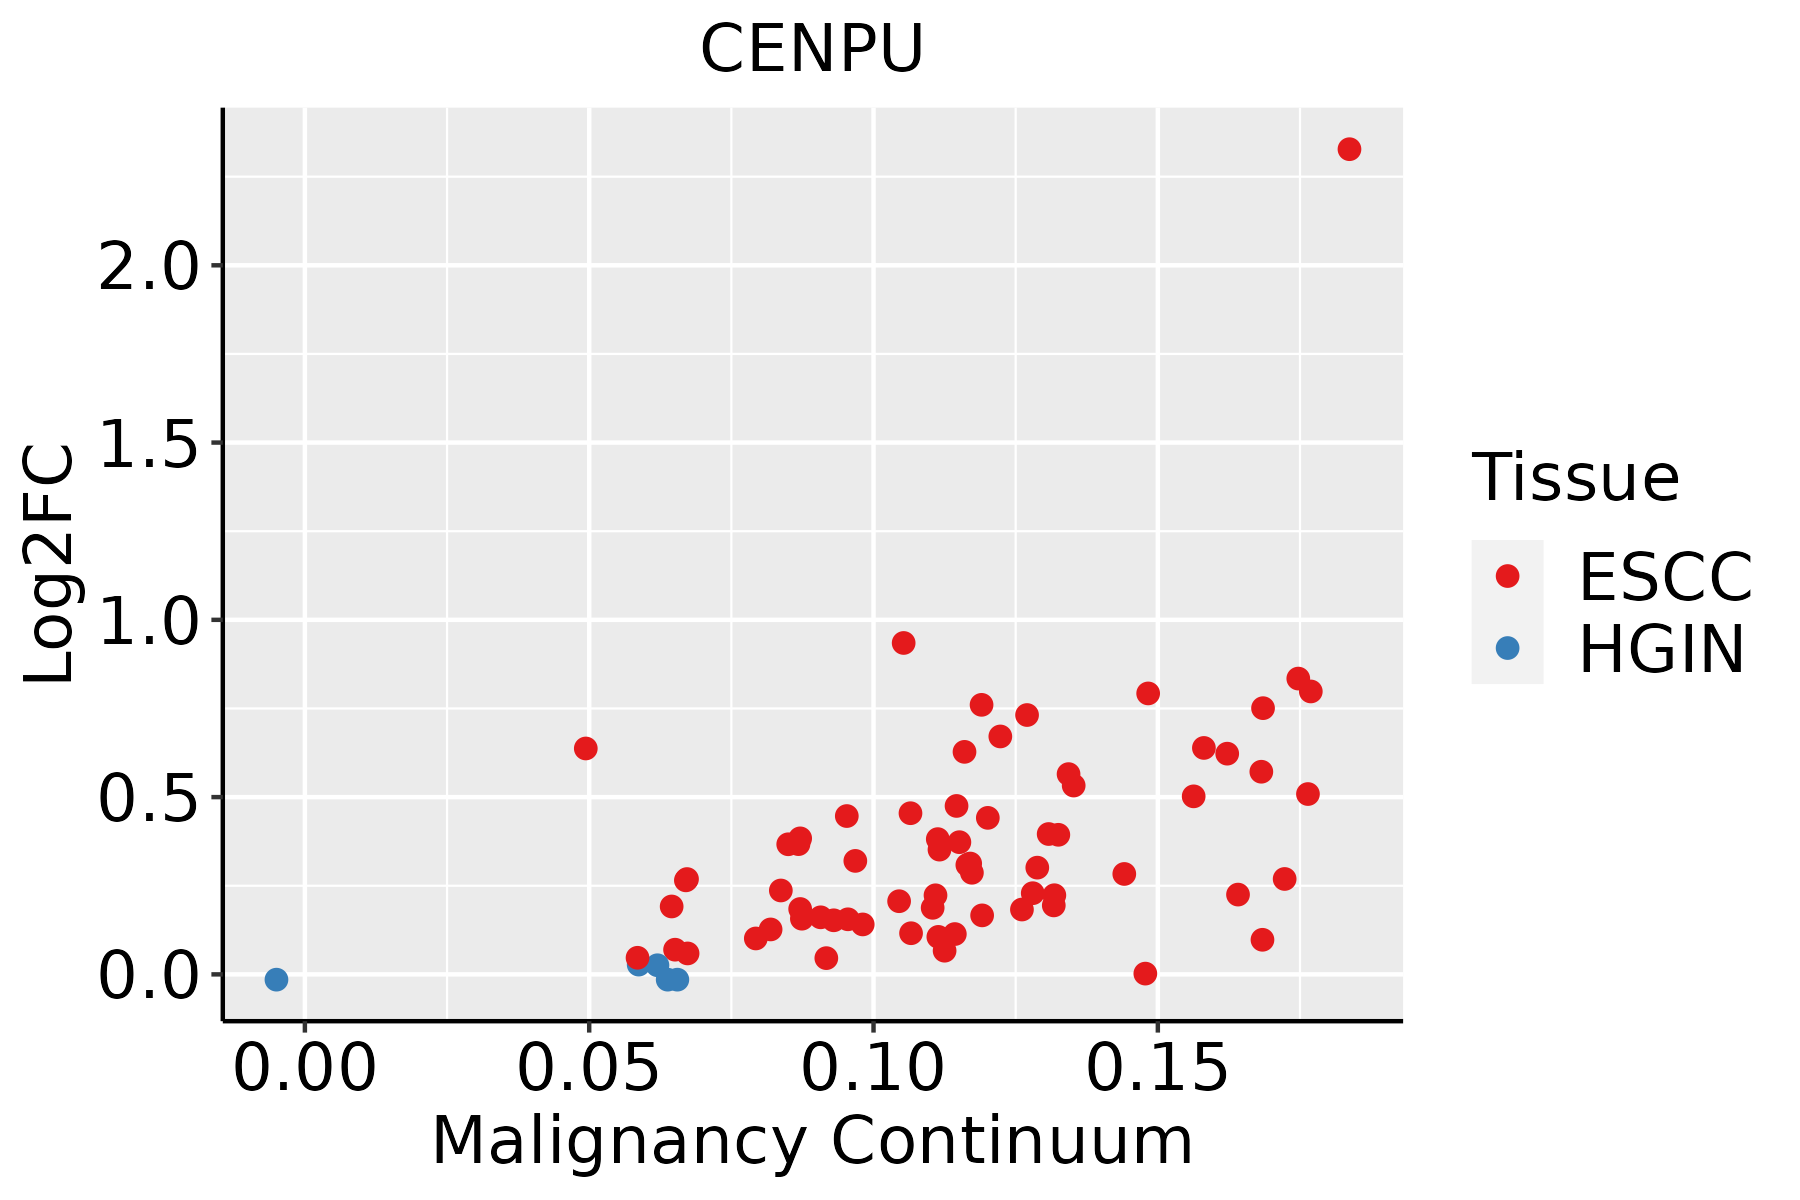 | ESCC: Esophageal squamous cell carcinoma |
| HGIN: High-grade intraepithelial neoplasias | ||
| LGIN: Low-grade intraepithelial neoplasias | ||
| Liver | 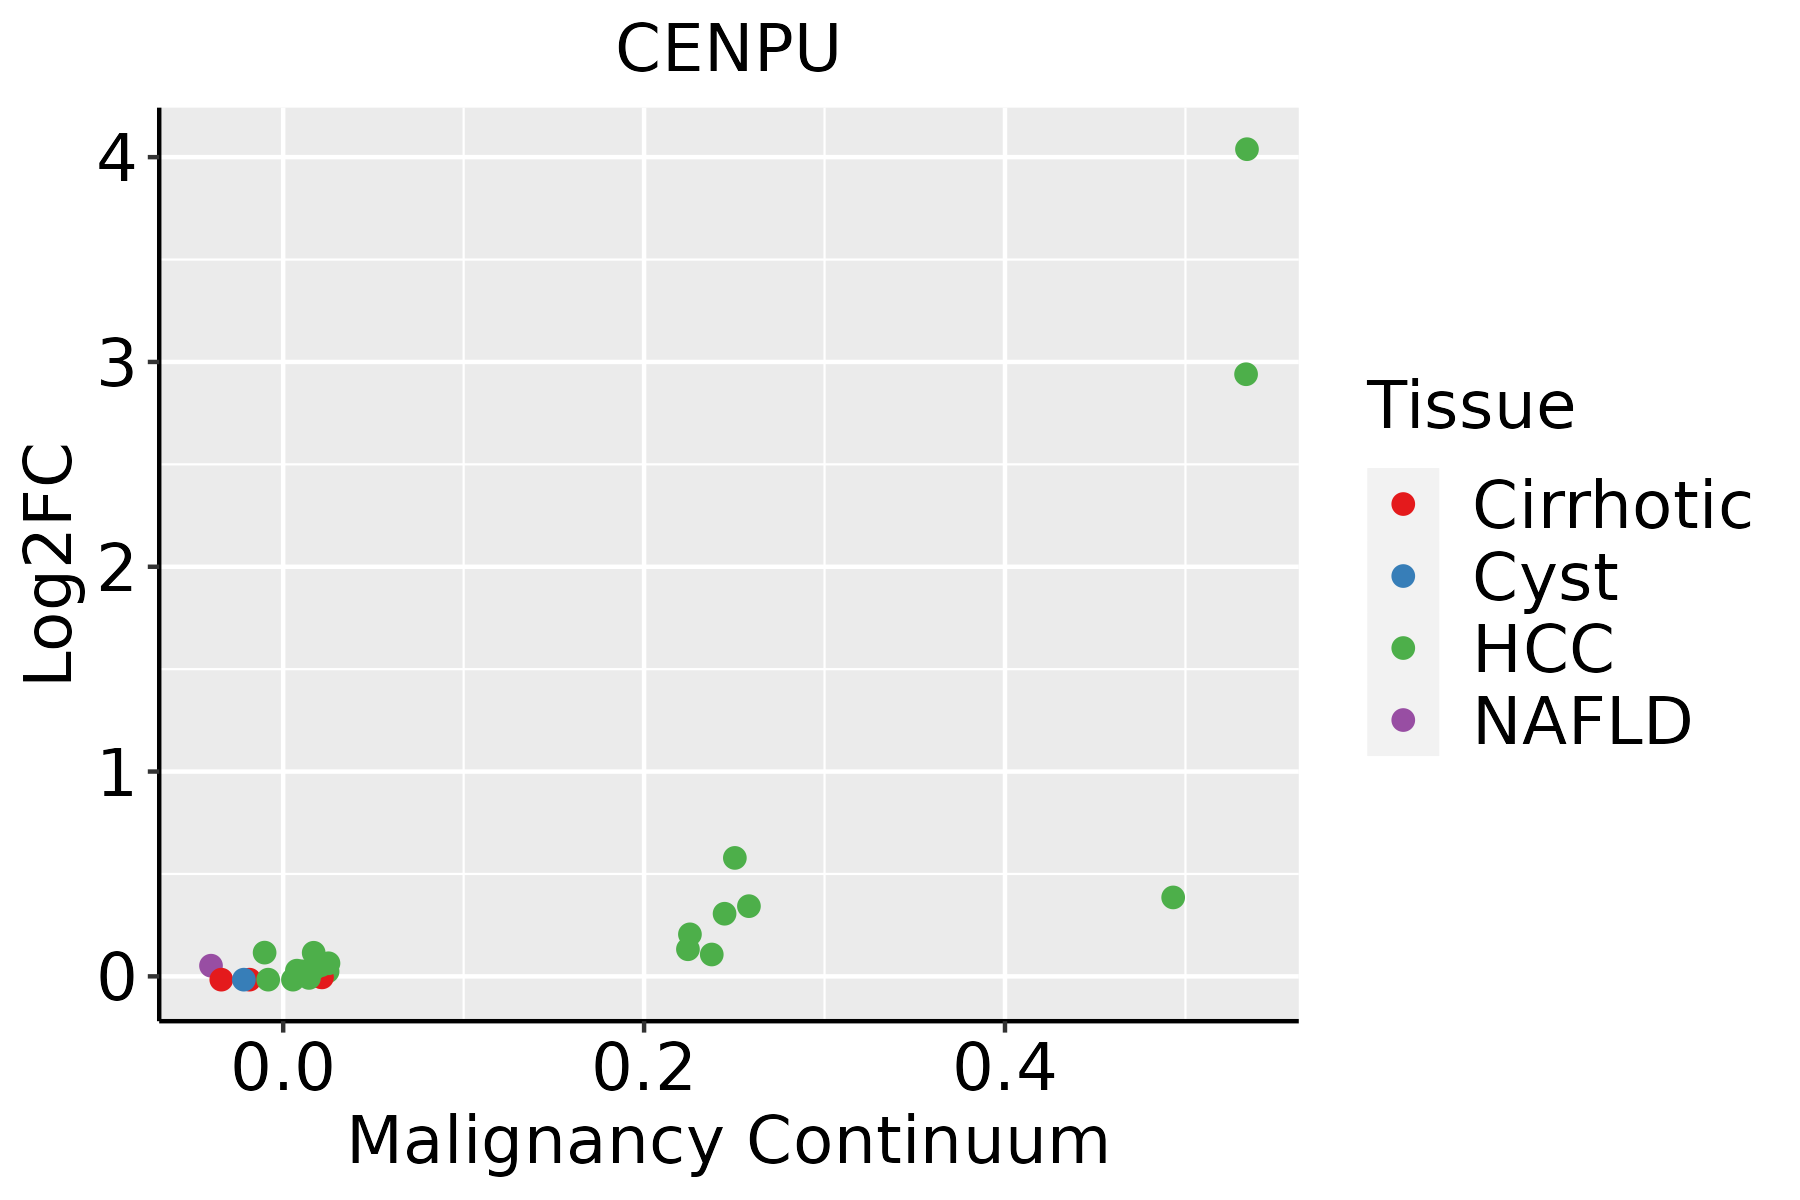 | HCC: Hepatocellular carcinoma |
| NAFLD: Non-alcoholic fatty liver disease | ||
| Oral Cavity | 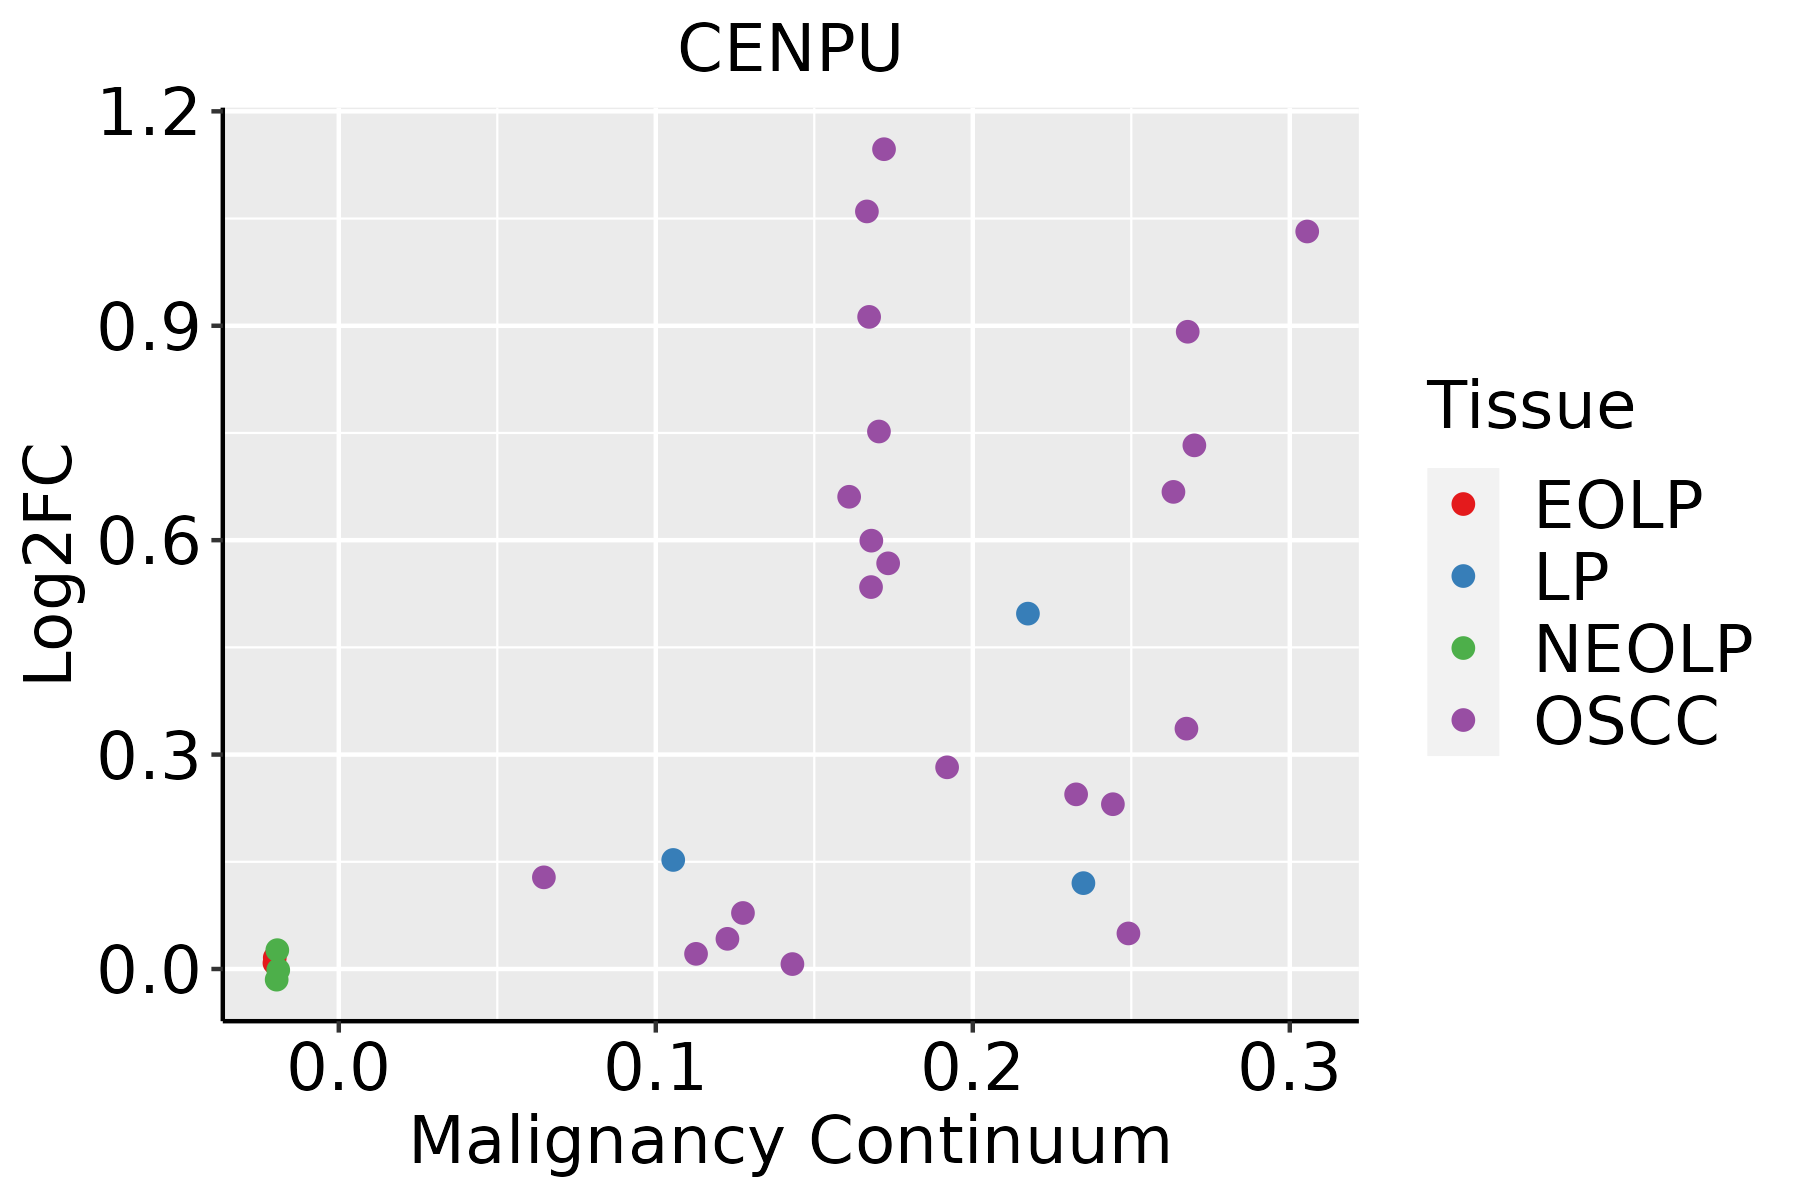 | EOLP: Erosive Oral lichen planus |
| LP: leukoplakia | ||
| NEOLP: Non-erosive oral lichen planus | ||
| OSCC: Oral squamous cell carcinoma | ||
| Skin | 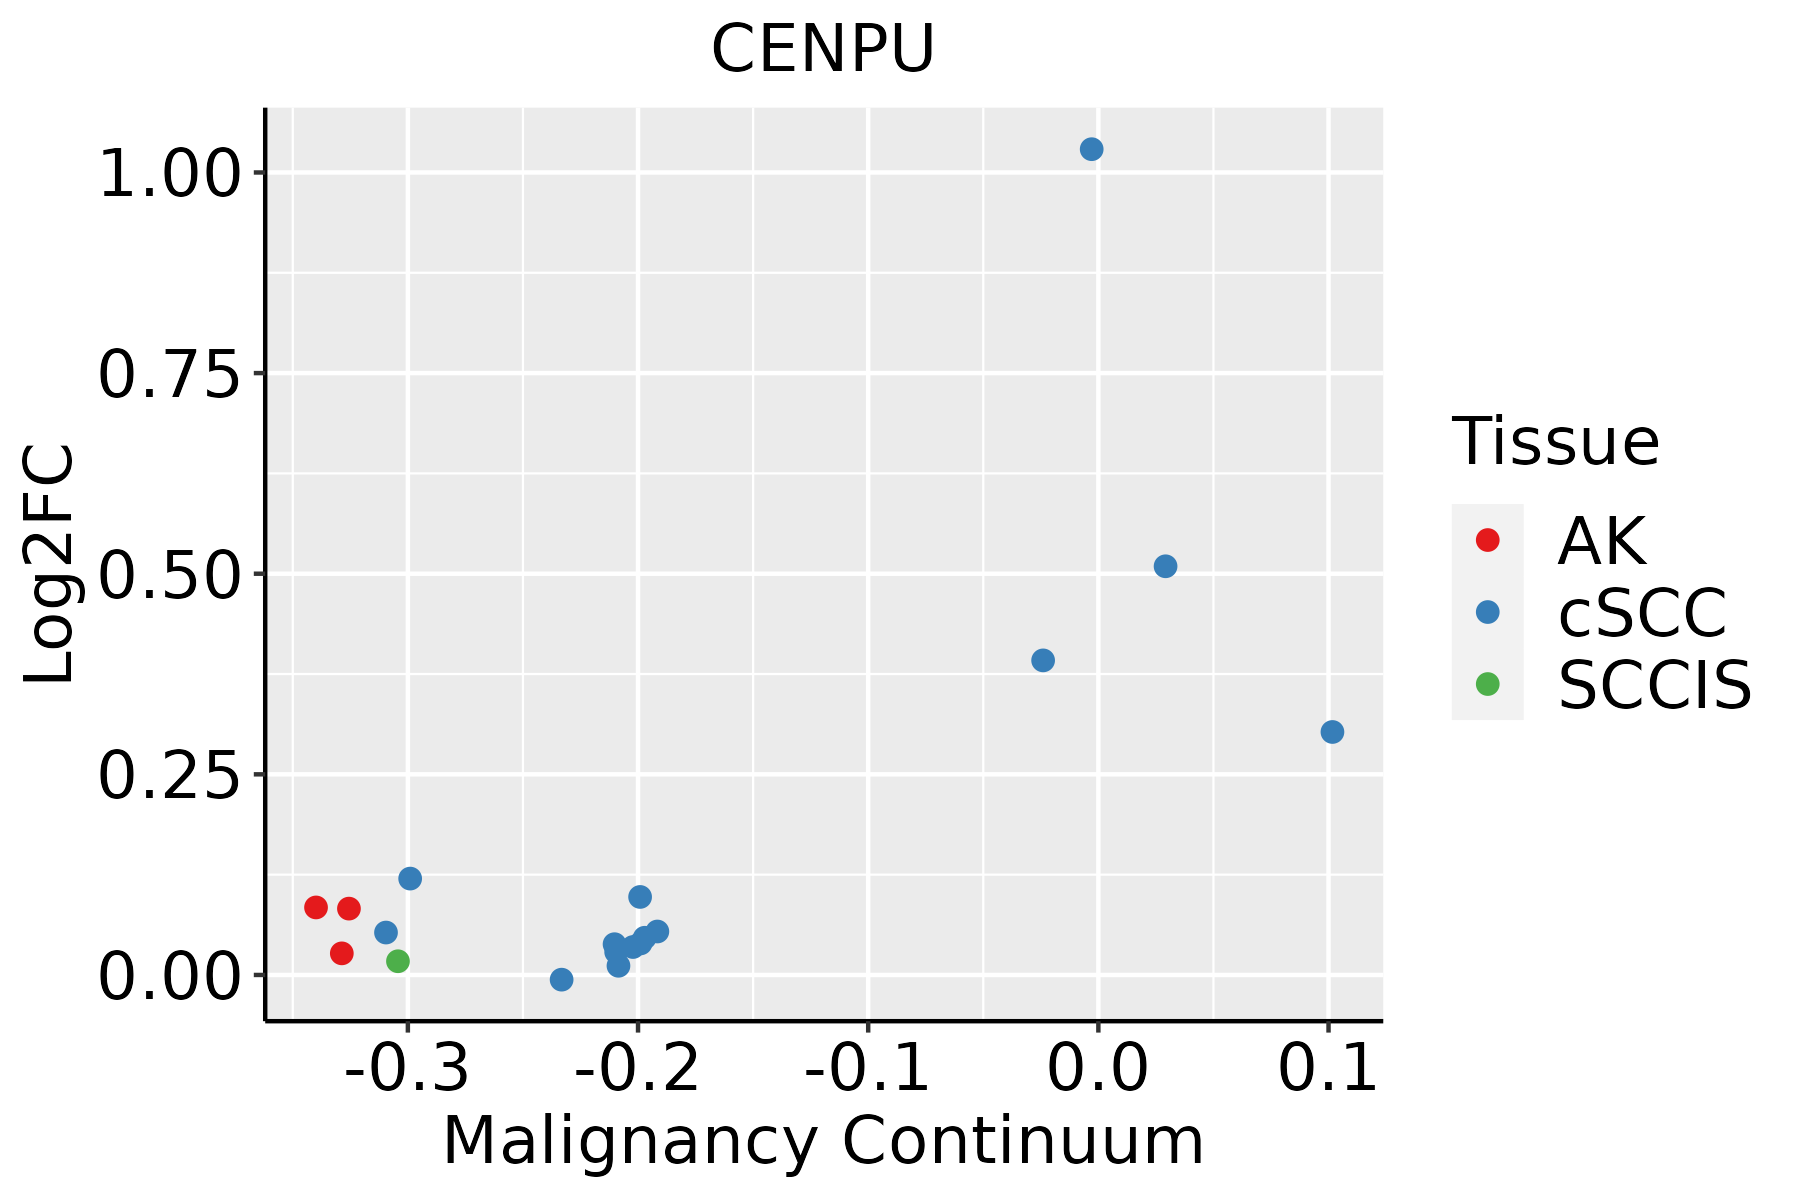 | AK: Actinic keratosis |
| cSCC: Cutaneous squamous cell carcinoma | ||
| SCCIS:squamous cell carcinoma in situ | ||
| Thyroid |  | ATC: Anaplastic thyroid cancer |
| HT: Hashimoto's thyroiditis | ||
| PTC: Papillary thyroid cancer |
| ∗log2FC in expression of this searched gene in stem-like cells from each diseased tissue sample relative to stem-like cells in normal samples in each tissue plotted against the malignancy continuum. Samples are colored based on if they are from different disease stage. |
Top |
Malignant transformation related pathway analysis |
| Find out the enriched GO biological processes and KEGG pathways involved in transition from healthy to precancer to cancer |
| Tissue | Disease Stage | Enriched GO biological Processes |
| Colorectum | AD |  |
| Colorectum | SER |  |
| Colorectum | MSS |  |
| Colorectum | MSI-H |  |
| Colorectum | FAP |  |
| ∗Top 15 enriched GO BP terms are showed in the bar plot of each disease state in each tissue. Each row represents a significant GO biological process which is colored according to the -log10(p.adjust). |
| Page: 1 2 3 4 5 6 7 8 9 |
| GO ID | Tissue | Disease Stage | Description | Gene Ratio | Bg Ratio | pvalue | p.adjust | Count |
| Page: 1 |
| Pathway ID | Tissue | Disease Stage | Description | Gene Ratio | Bg Ratio | pvalue | p.adjust | qvalue | Count |
| Page: 1 |
Top |
Cell-cell communication analysis |
| Identification of potential cell-cell interactions between two cell types and their ligand-receptor pairs for different disease states |
| Ligand | Receptor | LRpair | Pathway | Tissue | Disease Stage |
| Page: 1 |
Top |
Single-cell gene regulatory network inference analysis |
| Find out the significant the regulons (TFs) and the target genes of each regulon across cell types for different disease states |
| TF | Cell Type | Tissue | Disease Stage | Target Gene | RSS | Regulon Activity |
| ∗The dot plots of a searched regulon are shown for all cell subpopulations in each disease state of each tissue based on the regulon specific score inferred using pySCENIC and by calculating the average expression. |
| Page: 1 |
Top |
Somatic mutation of malignant transformation related genes |
| Annotation of somatic variants for genes involved in malignant transformation |
| Hugo Symbol | Variant Class | Variant Classification | dbSNP RS | HGVSc | HGVSp | HGVSp Short | SWISSPROT | BIOTYPE | SIFT | PolyPhen | Tumor Sample Barcode | Tissue | Histology | Sex | Age | Stage | Therapy Types | Drugs | Outcome |
| CENPU | SNV | Missense_Mutation | novel | c.1102N>G | p.Tyr368Asp | p.Y368D | Q71F23 | protein_coding | deleterious(0.01) | probably_damaging(0.998) | TCGA-A7-A26I-01 | Breast | breast invasive carcinoma | Female | >=65 | I/II | Chemotherapy | cytoxan | SD |
| CENPU | insertion | Nonsense_Mutation | novel | c.1103_1104insAA | p.Tyr368Ter | p.Y368* | Q71F23 | protein_coding | TCGA-A7-A26I-01 | Breast | breast invasive carcinoma | Female | >=65 | I/II | Chemotherapy | cytoxan | SD | ||
| CENPU | insertion | Frame_Shift_Ins | novel | c.129_130insACGTG | p.Phe44ThrfsTer80 | p.F44Tfs*80 | Q71F23 | protein_coding | TCGA-C8-A131-01 | Breast | breast invasive carcinoma | Female | >=65 | III/IV | Chemotherapy | 5-fluorouracil | CR | ||
| CENPU | SNV | Missense_Mutation | c.945N>T | p.Lys315Asn | p.K315N | Q71F23 | protein_coding | deleterious(0) | probably_damaging(0.972) | TCGA-FU-A3HZ-01 | Cervix | cervical & endocervical cancer | Female | <65 | I/II | Chemotherapy | cisplatin | CR | |
| CENPU | SNV | Missense_Mutation | rs200975207 | c.1132N>A | p.Val378Ile | p.V378I | Q71F23 | protein_coding | tolerated(0.23) | benign(0) | TCGA-A6-3809-01 | Colorectum | colon adenocarcinoma | Female | >=65 | I/II | Unknown | Unknown | SD |
| CENPU | SNV | Missense_Mutation | c.77G>T | p.Arg26Ile | p.R26I | Q71F23 | protein_coding | deleterious(0) | possibly_damaging(0.548) | TCGA-AA-3510-01 | Colorectum | colon adenocarcinoma | Male | >=65 | I/II | Unknown | Unknown | SD | |
| CENPU | SNV | Missense_Mutation | c.955N>T | p.Arg319Cys | p.R319C | Q71F23 | protein_coding | deleterious(0.05) | benign(0.3) | TCGA-AA-3672-01 | Colorectum | colon adenocarcinoma | Female | >=65 | III/IV | Unknown | Unknown | SD | |
| CENPU | SNV | Missense_Mutation | c.439A>G | p.Thr147Ala | p.T147A | Q71F23 | protein_coding | tolerated(0.06) | benign(0.061) | TCGA-AA-3811-01 | Colorectum | colon adenocarcinoma | Female | >=65 | III/IV | Unknown | Unknown | PD | |
| CENPU | SNV | Missense_Mutation | novel | c.527N>G | p.Lys176Arg | p.K176R | Q71F23 | protein_coding | tolerated(0.14) | benign(0.031) | TCGA-AA-3950-01 | Colorectum | colon adenocarcinoma | Female | >=65 | I/II | Unknown | Unknown | SD |
| CENPU | SNV | Missense_Mutation | novel | c.317N>T | p.Arg106Ile | p.R106I | Q71F23 | protein_coding | tolerated(0.09) | benign(0.276) | TCGA-AA-3984-01 | Colorectum | colon adenocarcinoma | Female | <65 | I/II | Unknown | Unknown | SD |
| Page: 1 2 3 4 |
Top |
Related drugs of malignant transformation related genes |
| Identification of chemicals and drugs interact with genes involved in malignant transfromation |
| (DGIdb 4.0) |
| Entrez ID | Symbol | Category | Interaction Types | Drug Claim Name | Drug Name | PMIDs |
| Page: 1 |

Copyright 2023-Present -The University of Texas Health Science Center at Houston |