Schematic overview of the cellular and molecular mechanisms involved in the cancer progression, including the proposed cellular and molecular mechanisms in cancer cells trajectory. AT1: alveolar type 1 cells; AT2: alveolar type 2 cells; AAH: atypical adenomatous hyperplasia; AIS: adenocarcinoma in situ; MIA: minimally invasive adenocarcinoma; IA: invasive adenocarcinoma; EMT: epithelial-mesenchymal transition

Home

Download

Statistics

Help

Contact

Center for Computational Systems Medicine
leaf

Gene summary

leaf

Malignant transformation analysis

leaf

Malignant transformation related pathway analysis

leaf

Cell-cell communication analysis

leaf

Single-cell gene regulatory network inference analysis

leaf

Somatic mutation of malignant transformation related genes

leaf

Related drugs of malignant transformation related genes

Gene: CDK16

Gene summary for CDK16

check button Gene summary.

Gene informationSpeciesHuman
Gene symbol

CDK16

Gene ID

5127

Gene namecyclin dependent kinase 16
Gene AliasPCTAIRE
CytomapXp11.3
Gene Typeprotein-coding
GO ID

GO:0000003

UniProtAcc

Q00536


Top

Malignant transformation analysis

check button Identification of the aberrant gene expression in precancerous and cancerous lesions by comparing the gene expression of stem-like cells in diseased tissues with normal stem cells
check button Malignant transformation involving gene list.
Entrez IDSymbolReplicatesSpeciesOrganTissueAdj P-valueLog2FCMalignancy
5127CDK16HTA11_10623_2000001011HumanColorectumAD1.07e-107.08e-01-0.0177
5127CDK16HTA11_6801_2000001011HumanColorectumSER1.84e-065.89e-010.0171
5127CDK16HTA11_10711_2000001011HumanColorectumAD2.69e-042.76e-010.0338
5127CDK16HTA11_7696_3000711011HumanColorectumAD6.51e-143.59e-010.0674
5127CDK16HTA11_6818_2000001011HumanColorectumAD3.09e-043.39e-010.0112
5127CDK16HTA11_7469_2000001011HumanColorectumAD1.11e-045.00e-01-0.0124
5127CDK16HTA11_6818_2000001021HumanColorectumAD5.85e-124.44e-010.0588
5127CDK16HTA11_99999970781_79442HumanColorectumMSS1.66e-022.40e-010.294
5127CDK16HTA11_99999965062_69753HumanColorectumMSI-H1.33e-025.75e-010.3487
5127CDK16HTA11_99999965104_69814HumanColorectumMSS1.54e-073.90e-010.281
5127CDK16HTA11_99999971662_82457HumanColorectumMSS2.74e-113.71e-010.3859
5127CDK16HTA11_99999974143_84620HumanColorectumMSS3.09e-214.82e-010.3005
5127CDK16LZE4THumanEsophagusESCC6.27e-052.11e-010.0811
5127CDK16LZE5THumanEsophagusESCC3.83e-042.63e-010.0514
5127CDK16LZE7THumanEsophagusESCC1.07e-022.79e-010.0667
5127CDK16LZE20THumanEsophagusESCC1.17e-114.98e-010.0662
5127CDK16LZE22THumanEsophagusESCC9.76e-067.78e-010.068
5127CDK16LZE24THumanEsophagusESCC5.59e-206.32e-010.0596
5127CDK16LZE21THumanEsophagusESCC6.89e-055.74e-010.0655
5127CDK16P1T-EHumanEsophagusESCC3.99e-117.93e-010.0875
Page: 1 2 3 4 5 6 7 8 

check button Transcriptomic changes along malignancy continuum.
TissueExpression DynamicsAbbreviation
Colorectum (GSE201348)The image shows the transcriptomic changes along malignancy continuum.log2FC in expression of this searched gene in stem-like cells from each diseased tissue sample relative to stem-like cells in normal samples in each tissue plotted against the malignancy continuum. Samples are colored based on if they are from different disease stage.FAP: Familial adenomatous polyposis
CRC: Colorectal cancer
Colorectum (HTA11)The image shows the transcriptomic changes along malignancy continuum.log2FC in expression of this searched gene in stem-like cells from each diseased tissue sample relative to stem-like cells in normal samples in each tissue plotted against the malignancy continuum. Samples are colored based on if they are from different disease stage.AD: Adenomas
SER: Sessile serrated lesions
MSI-H: Microsatellite-high colorectal cancer
MSS: Microsatellite stable colorectal cancer
EsophagusThe image shows the transcriptomic changes along malignancy continuum.log2FC in expression of this searched gene in stem-like cells from each diseased tissue sample relative to stem-like cells in normal samples in each tissue plotted against the malignancy continuum. Samples are colored based on if they are from different disease stage.
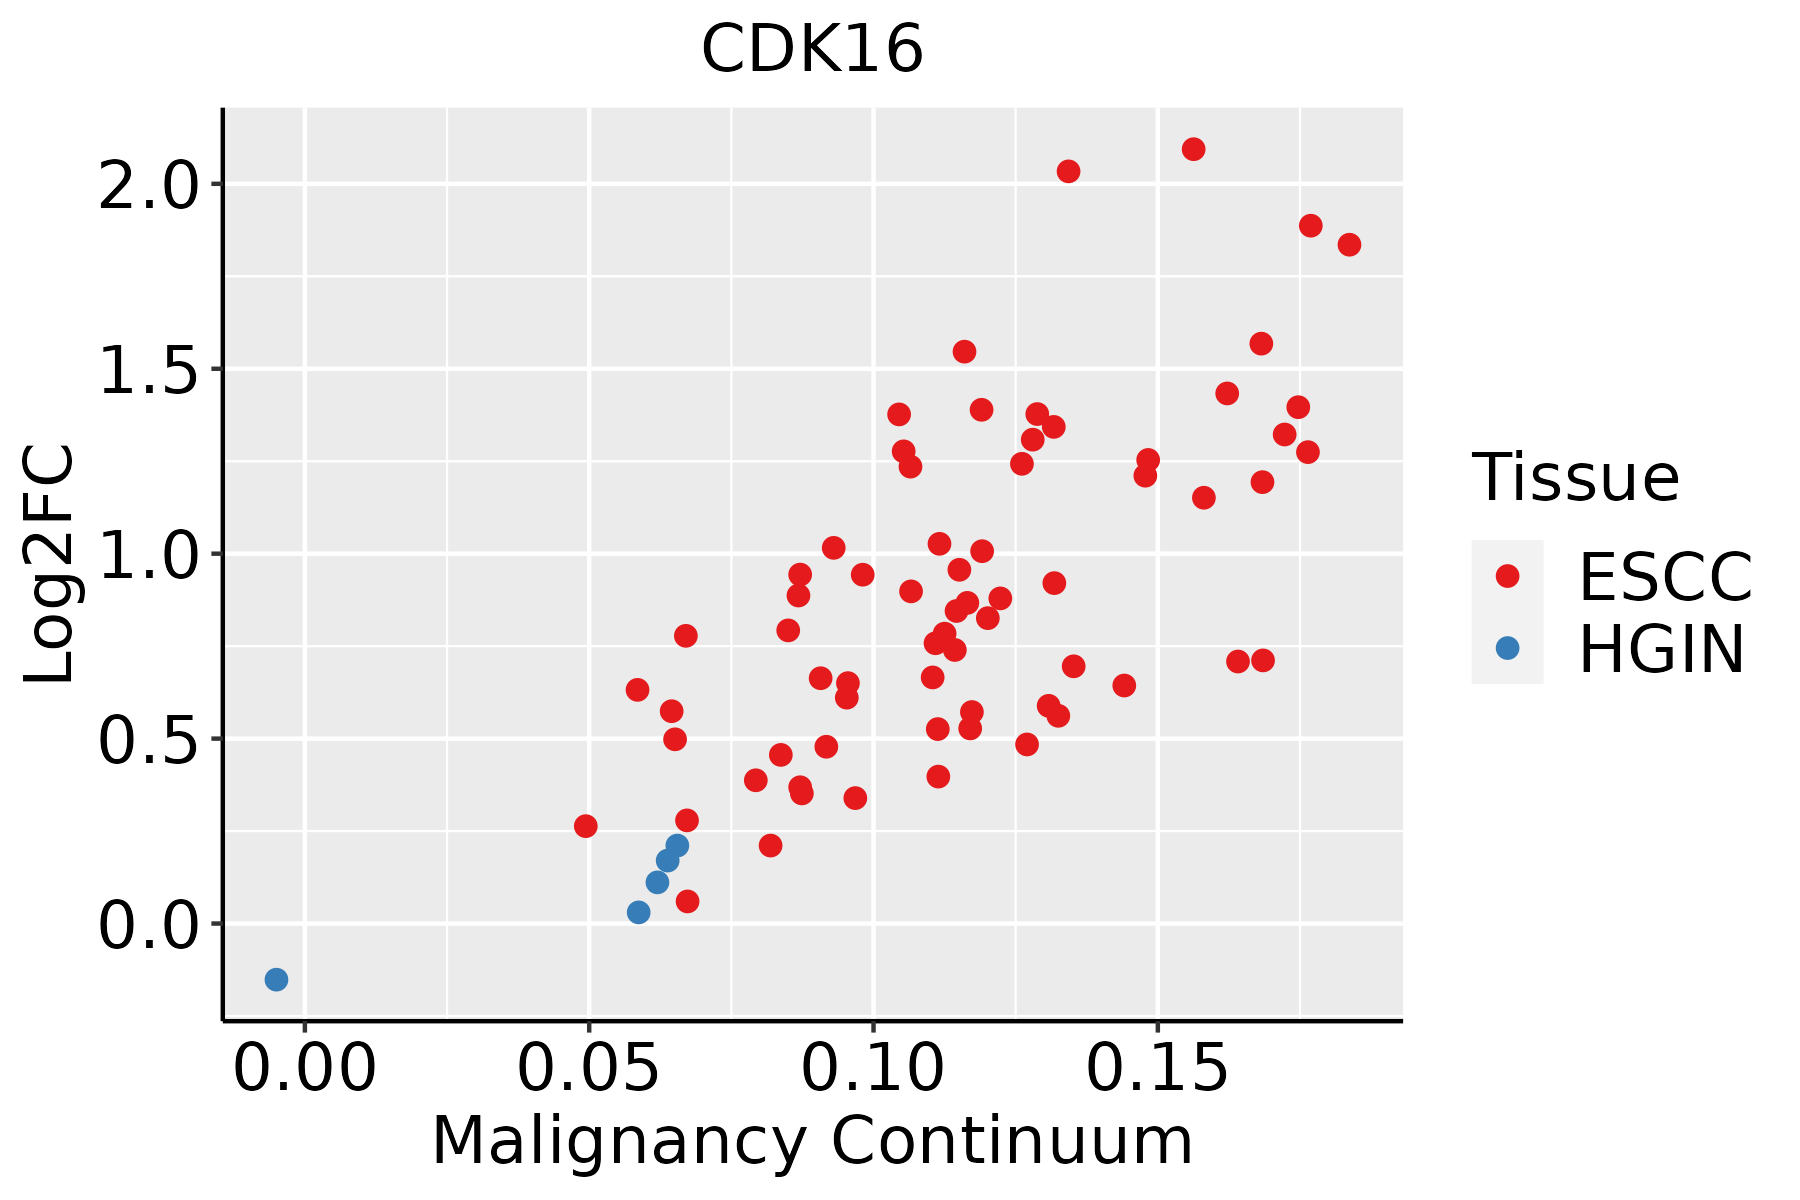
ESCC: Esophageal squamous cell carcinoma
HGIN: High-grade intraepithelial neoplasias
LGIN: Low-grade intraepithelial neoplasias
LiverThe image shows the transcriptomic changes along malignancy continuum.log2FC in expression of this searched gene in stem-like cells from each diseased tissue sample relative to stem-like cells in normal samples in each tissue plotted against the malignancy continuum. Samples are colored based on if they are from different disease stage.
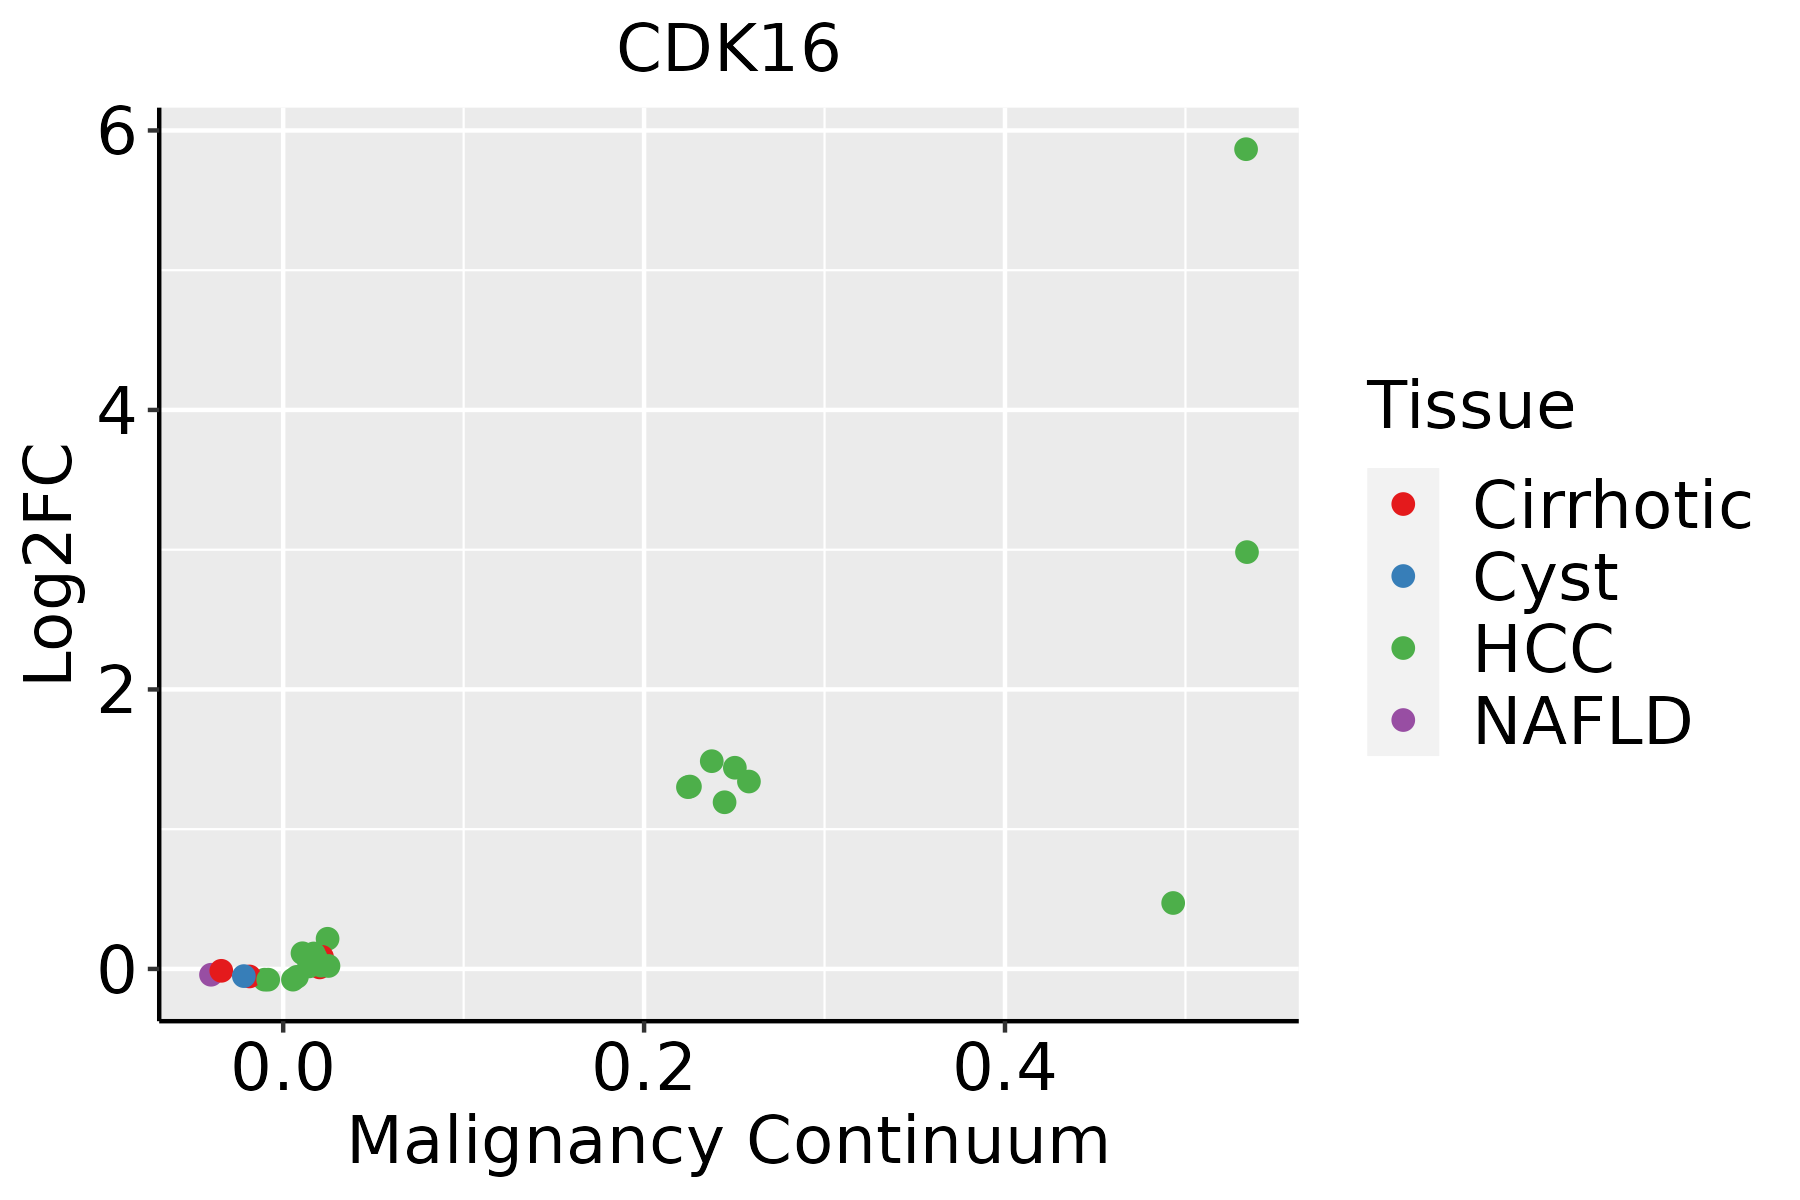
HCC: Hepatocellular carcinoma
NAFLD: Non-alcoholic fatty liver disease
Oral CavityThe image shows the transcriptomic changes along malignancy continuum.log2FC in expression of this searched gene in stem-like cells from each diseased tissue sample relative to stem-like cells in normal samples in each tissue plotted against the malignancy continuum. Samples are colored based on if they are from different disease stage.
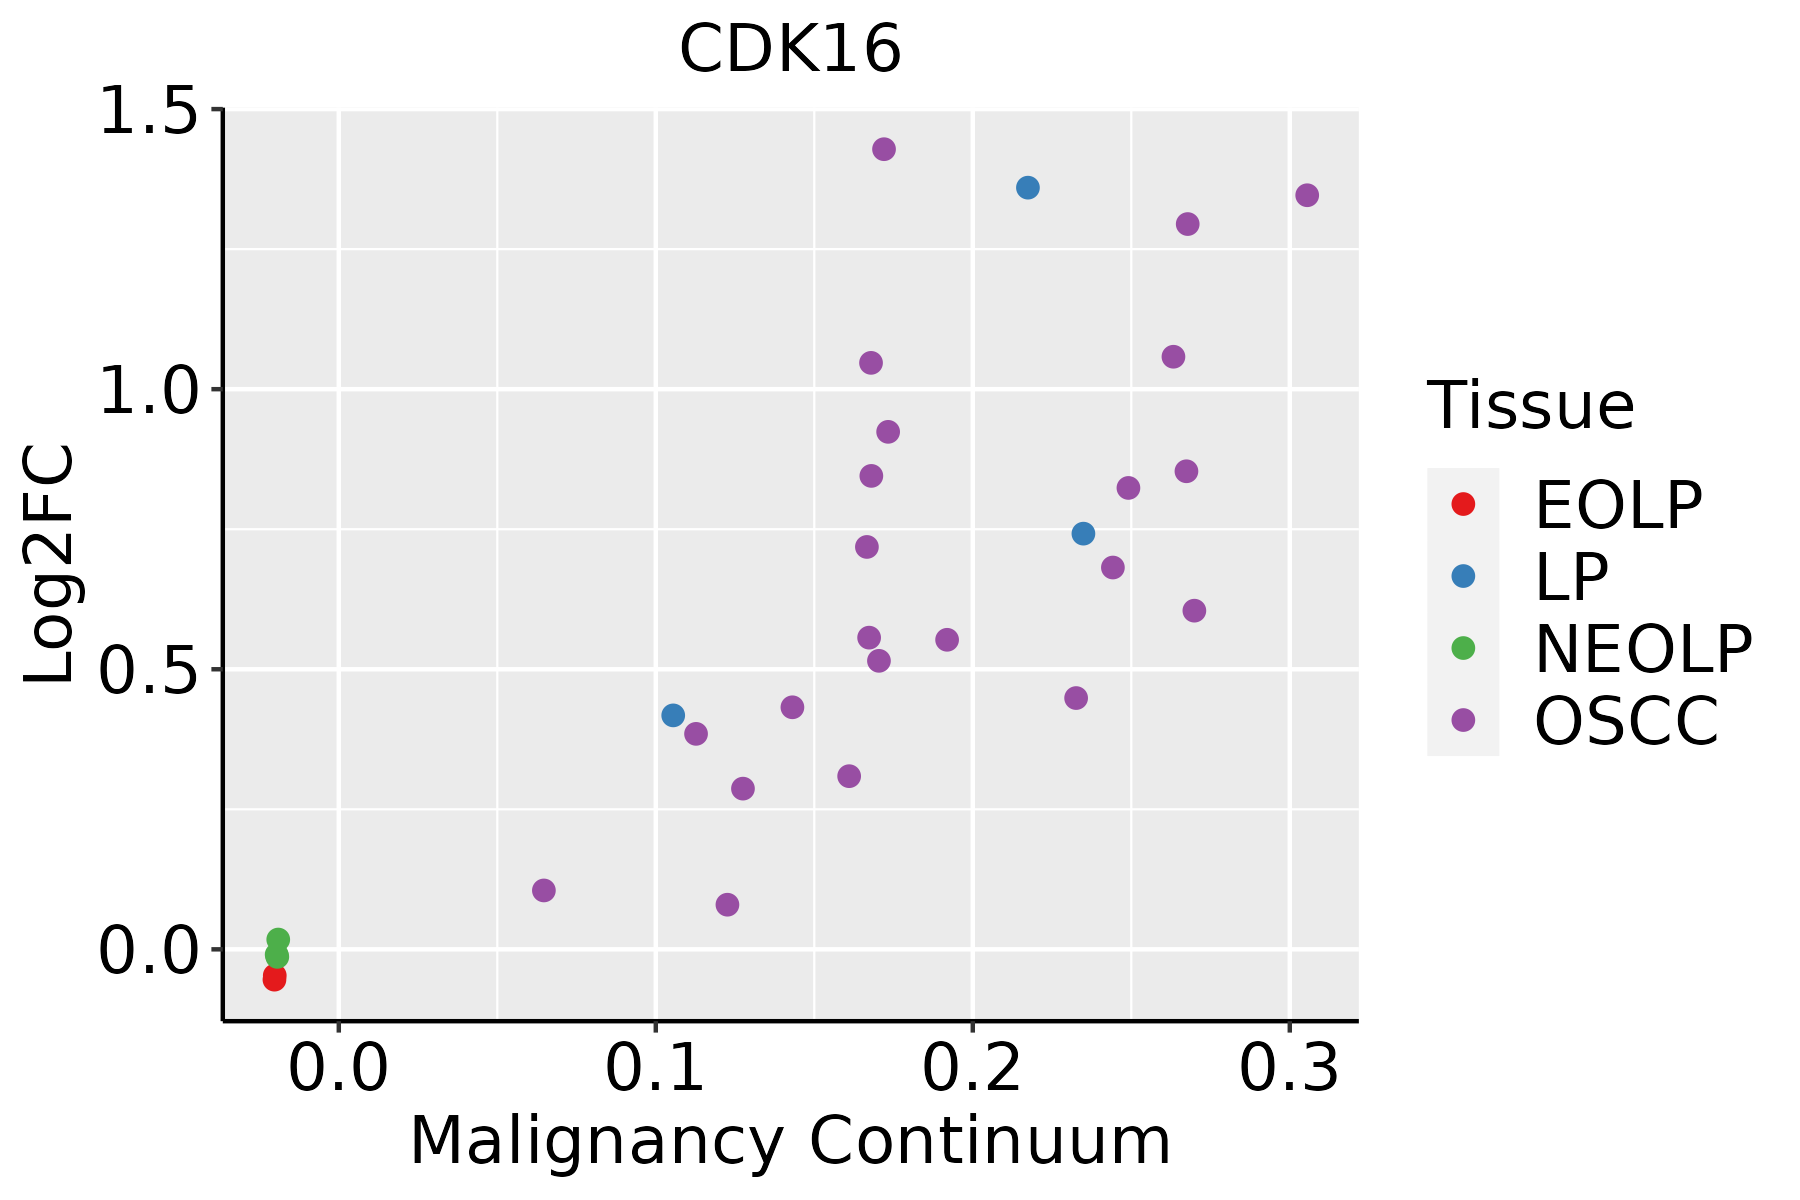
EOLP: Erosive Oral lichen planus
LP: leukoplakia
NEOLP: Non-erosive oral lichen planus
OSCC: Oral squamous cell carcinoma
SkinThe image shows the transcriptomic changes along malignancy continuum.log2FC in expression of this searched gene in stem-like cells from each diseased tissue sample relative to stem-like cells in normal samples in each tissue plotted against the malignancy continuum. Samples are colored based on if they are from different disease stage.
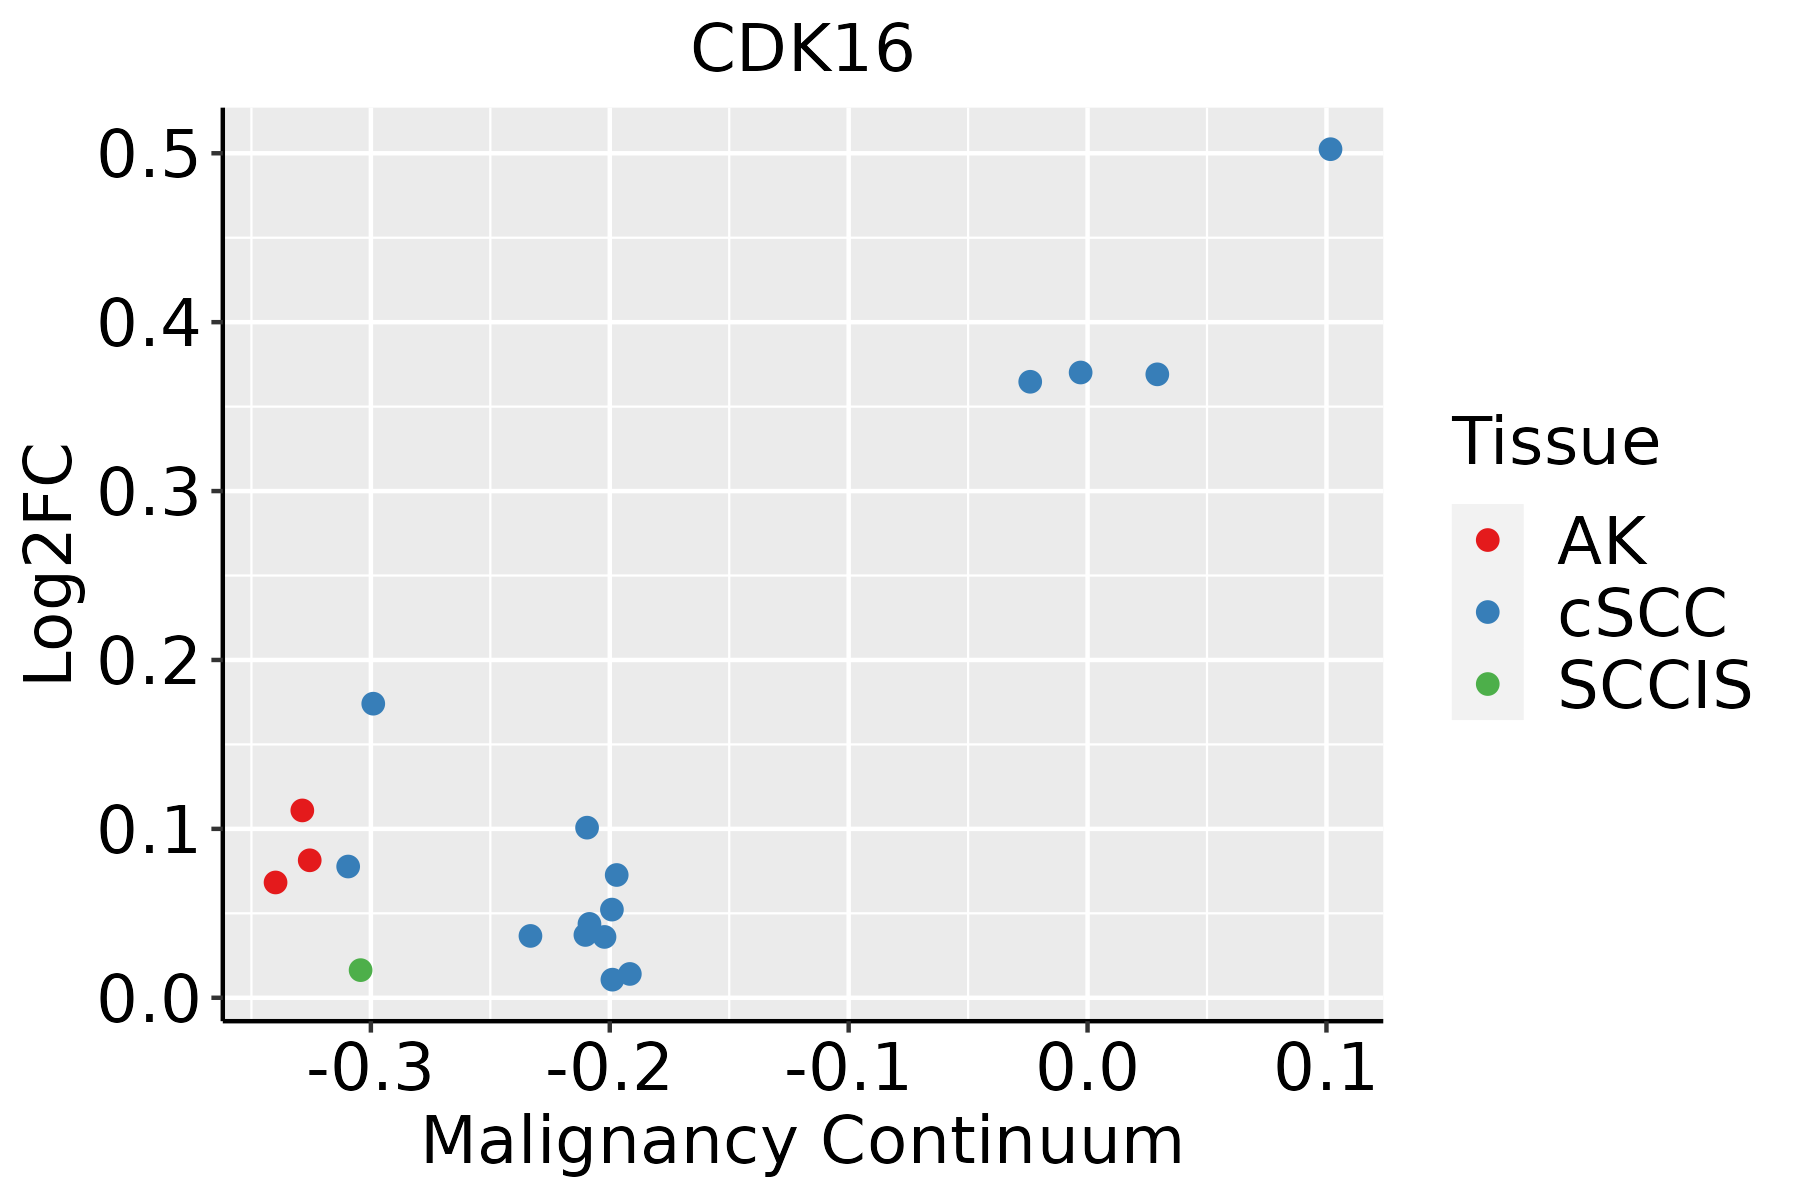
AK: Actinic keratosis
cSCC: Cutaneous squamous cell carcinoma
SCCIS:squamous cell carcinoma in situ
ThyroidThe image shows the transcriptomic changes along malignancy continuum.log2FC in expression of this searched gene in stem-like cells from each diseased tissue sample relative to stem-like cells in normal samples in each tissue plotted against the malignancy continuum. Samples are colored based on if they are from different disease stage.ATC: Anaplastic thyroid cancer
HT: Hashimoto's thyroiditis
PTC: Papillary thyroid cancer
∗log2FC in expression of this searched gene in stem-like cells from each diseased tissue sample relative to stem-like cells in normal samples in each tissue plotted against the malignancy continuum. Samples are colored based on if they are from different disease stage.

Top

Malignant transformation related pathway analysis

check buttonFind out the enriched GO biological processes and KEGG pathways involved in transition from healthy to precancer to cancer
check button Figure of enriched GO biological processes.
TissueDisease StageEnriched GO biological Processes
ColorectumADGO analysis - Figure of enriched GO biological processes: Top 15 enriched GO BP terms are showed in the bar plot of each disease state in each tissue. Each row represents a significant GO biological process which is colored according to the -log10(p.adjust).
ColorectumSERGO analysis - Figure of enriched GO biological processes: Top 15 enriched GO BP terms are showed in the bar plot of each disease state in each tissue. Each row represents a significant GO biological process which is colored according to the -log10(p.adjust).
ColorectumMSSGO analysis - Figure of enriched GO biological processes: Top 15 enriched GO BP terms are showed in the bar plot of each disease state in each tissue. Each row represents a significant GO biological process which is colored according to the -log10(p.adjust).
ColorectumMSI-HGO analysis - Figure of enriched GO biological processes: Top 15 enriched GO BP terms are showed in the bar plot of each disease state in each tissue. Each row represents a significant GO biological process which is colored according to the -log10(p.adjust).
ColorectumFAPGO analysis - Figure of enriched GO biological processes: Top 15 enriched GO BP terms are showed in the bar plot of each disease state in each tissue. Each row represents a significant GO biological process which is colored according to the -log10(p.adjust).
∗Top 15 enriched GO BP terms are showed in the bar plot of each disease state in each tissue. Each row represents a significant GO biological process which is colored according to the -log10(p.adjust).
Page: 1 2 3 4 5 6 7 8 9 

check button Enriched GO biological processes.
GO IDTissueDisease StageDescriptionGene RatioBg Ratiopvaluep.adjustCount
GO:0009743ColorectumADresponse to carbohydrate86/3918253/187238.43e-072.90e-0586
GO:0034284ColorectumADresponse to monosaccharide76/3918225/187234.64e-061.23e-0476
GO:0033500ColorectumADcarbohydrate homeostasis84/3918259/187239.10e-062.15e-0484
GO:0009746ColorectumADresponse to hexose73/3918219/187231.20e-052.65e-0473
GO:0009749ColorectumADresponse to glucose71/3918212/187231.31e-052.85e-0471
GO:0042593ColorectumADglucose homeostasis83/3918258/187231.44e-053.11e-0483
GO:0001678ColorectumADcellular glucose homeostasis60/3918172/187231.49e-053.18e-0460
GO:0071322ColorectumADcellular response to carbohydrate stimulus56/3918163/187234.61e-057.97e-0456
GO:0050708ColorectumADregulation of protein secretion83/3918268/187236.59e-051.07e-0383
GO:0071333ColorectumADcellular response to glucose stimulus52/3918151/187237.88e-051.25e-0352
GO:0009306ColorectumADprotein secretion105/3918359/187231.05e-041.57e-03105
GO:0071331ColorectumADcellular response to hexose stimulus52/3918153/187231.16e-041.71e-0352
GO:0035592ColorectumADestablishment of protein localization to extracellular region105/3918360/187231.18e-041.73e-03105
GO:0071326ColorectumADcellular response to monosaccharide stimulus52/3918154/187231.40e-041.98e-0352
GO:0071692ColorectumADprotein localization to extracellular region106/3918368/187231.86e-042.49e-03106
GO:0050796ColorectumADregulation of insulin secretion54/3918165/187232.60e-043.25e-0354
GO:0030073ColorectumADinsulin secretion61/3918195/187234.28e-044.81e-0361
GO:0061178ColorectumADregulation of insulin secretion involved in cellular response to glucose stimulus25/391864/187236.98e-047.10e-0325
GO:0015833ColorectumADpeptide transport77/3918264/187238.90e-048.60e-0377
GO:0035773ColorectumADinsulin secretion involved in cellular response to glucose stimulus27/391873/187231.17e-031.05e-0227
Page: 1 2 3 4 5 6 7 8 9 

check button Enriched KEGG pathways.
Pathway IDTissueDisease StageDescriptionGene RatioBg Ratiopvaluep.adjustqvalueCount
Page: 1 

Top

Cell-cell communication analysis

check buttonIdentification of potential cell-cell interactions between two cell types and their ligand-receptor pairs for different disease states
LigandReceptorLRpairPathwayTissueDisease Stage
Page: 1 

Top

Single-cell gene regulatory network inference analysis

check buttonFind out the significant the regulons (TFs) and the target genes of each regulon across cell types for different disease states
TFCell TypeTissueDisease StageTarget GeneRSSRegulon Activity
∗The dot plots of a searched regulon are shown for all cell subpopulations in each disease state of each tissue based on the regulon specific score inferred using pySCENIC and by calculating the average expression.
Page: 1 

Top

Somatic mutation of malignant transformation related genes

check buttonAnnotation of somatic variants for genes involved in malignant transformation
Hugo SymbolVariant ClassVariant ClassificationdbSNP RSHGVScHGVSpHGVSp ShortSWISSPROTBIOTYPESIFTPolyPhenTumor Sample BarcodeTissueHistologySexAgeStageTherapy TypesDrugsOutcome
CDK16SNVMissense_Mutationc.1255N>Cp.Met419Leup.M419LQ00536protein_codingdeleterious(0.03)probably_damaging(0.978)TCGA-A8-A092-01Breastbreast invasive carcinomaFemale<65III/IVChemotherapypaclitaxelCR
CDK16SNVMissense_Mutationrs142251178c.371N>Ap.Arg124Hisp.R124HQ00536protein_codingtolerated_low_confidence(0.17)benign(0.006)TCGA-B6-A0I8-01Breastbreast invasive carcinomaFemale<65I/IIUnknownUnknownPD
CDK16SNVMissense_Mutationc.1545N>Tp.Met515Ilep.M515IQ00536protein_codingdeleterious(0.01)probably_damaging(0.984)TCGA-BH-A18V-01Breastbreast invasive carcinomaFemale<65I/IIUnknownUnknownSD
CDK16SNVMissense_Mutationc.1575N>Cp.Glu525Aspp.E525DQ00536protein_codingtolerated(0.33)benign(0)TCGA-C8-A12T-01Breastbreast invasive carcinomaFemale<65I/IIUnknownUnknownSD
CDK16SNVMissense_Mutationc.1676N>Tp.Gly559Valp.G559VQ00536protein_codingdeleterious_low_confidence(0.01)benign(0.041)TCGA-D8-A1JG-01Breastbreast invasive carcinomaFemale<65I/IIChemotherapydoxorubicinSD
CDK16SNVMissense_Mutationnovelc.305N>Ap.Pro102Hisp.P102HQ00536protein_codingtolerated_low_confidence(0.07)benign(0.393)TCGA-2W-A8YY-01Cervixcervical & endocervical cancerFemale<65I/IIChemotherapycisplatinCR
CDK16SNVMissense_Mutationnovelc.59G>Ap.Arg20Hisp.R20HQ00536protein_codingtolerated_low_confidence(0.2)benign(0.229)TCGA-EA-A410-01Cervixcervical & endocervical cancerFemale<65I/IIUnknownUnknownSD
CDK16SNVMissense_Mutationrs187232602c.278N>Ap.Arg93Glnp.R93QQ00536protein_codingtolerated_low_confidence(0.28)possibly_damaging(0.881)TCGA-Q1-A73O-01Cervixcervical & endocervical cancerFemale<65I/IIChemotherapycisplatinCR
CDK16SNVMissense_Mutationc.1295N>Ap.Gly432Aspp.G432DQ00536protein_codingdeleterious(0)probably_damaging(0.991)TCGA-A6-6781-01Colorectumcolon adenocarcinomaMale<65III/IVChemotherapyoxaliplatinSD
CDK16SNVMissense_Mutationc.1690N>Ap.Arg564Serp.R564SQ00536protein_codingdeleterious_low_confidence(0.03)benign(0.303)TCGA-AA-3672-01Colorectumcolon adenocarcinomaFemale>=65III/IVUnknownUnknownSD
Page: 1 2 3 4 5 

Top

Related drugs of malignant transformation related genes

check buttonIdentification of chemicals and drugs interact with genes involved in malignant transfromation
(DGIdb 4.0)
Entrez IDSymbolCategoryInteraction TypesDrug Claim NameDrug NamePMIDs
5127CDK16SERINE THREONINE KINASE, TUMOR SUPPRESSOR, KINASE, DRUGGABLE GENOME, ENZYMEinhibitorHESPERADINHESPERADIN19035792
5127CDK16SERINE THREONINE KINASE, TUMOR SUPPRESSOR, KINASE, DRUGGABLE GENOME, ENZYMEinhibitorCHEMBL3544942RONICICLIB
5127CDK16SERINE THREONINE KINASE, TUMOR SUPPRESSOR, KINASE, DRUGGABLE GENOME, ENZYMEinhibitorCHEMBL445813AT-7519
5127CDK16SERINE THREONINE KINASE, TUMOR SUPPRESSOR, KINASE, DRUGGABLE GENOME, ENZYMEinhibitorCHEMBL1230607PHA-793887
5127CDK16SERINE THREONINE KINASE, TUMOR SUPPRESSOR, KINASE, DRUGGABLE GENOME, ENZYMEinhibitorCHEMBL488436AZD-5438
Page: 1