
|
|||||
|
 | |
| |
| |
| |
| |
| |
|
Gene: CDH1 |
Gene summary for CDH1 |
| Gene information | Species | Human | Gene symbol | CDH1 | Gene ID | 999 |
| Gene name | cadherin 1 | |
| Gene Alias | Arc-1 | |
| Cytomap | 16q22.1 | |
| Gene Type | protein-coding | GO ID | GO:0006139 | UniProtAcc | B3GN61 |
Top |
Malignant transformation analysis |
| Identification of the aberrant gene expression in precancerous and cancerous lesions by comparing the gene expression of stem-like cells in diseased tissues with normal stem cells |
| Entrez ID | Symbol | Replicates | Species | Organ | Tissue | Adj P-value | Log2FC | Malignancy |
| 999 | CDH1 | HTA11_7862_2000001011 | Human | Colorectum | AD | 2.96e-11 | 9.37e-01 | -0.0179 |
| 999 | CDH1 | HTA11_866_3004761011 | Human | Colorectum | AD | 1.66e-09 | 8.21e-01 | 0.096 |
| 999 | CDH1 | HTA11_7663_2000001011 | Human | Colorectum | SER | 9.22e-07 | 8.50e-01 | 0.0131 |
| 999 | CDH1 | HTA11_10623_2000001011 | Human | Colorectum | AD | 1.39e-05 | 7.42e-01 | -0.0177 |
| 999 | CDH1 | HTA11_6801_2000001011 | Human | Colorectum | SER | 1.05e-03 | 7.93e-01 | 0.0171 |
| 999 | CDH1 | HTA11_7696_3000711011 | Human | Colorectum | AD | 1.20e-06 | 7.11e-01 | 0.0674 |
| 999 | CDH1 | HTA11_7469_2000001011 | Human | Colorectum | AD | 1.31e-15 | 1.24e+00 | -0.0124 |
| 999 | CDH1 | HTA11_6818_2000001021 | Human | Colorectum | AD | 3.52e-04 | 6.00e-01 | 0.0588 |
| 999 | CDH1 | HTA11_99999970781_79442 | Human | Colorectum | MSS | 4.09e-24 | 1.06e+00 | 0.294 |
| 999 | CDH1 | HTA11_99999965062_69753 | Human | Colorectum | MSI-H | 1.60e-09 | 1.15e+00 | 0.3487 |
| 999 | CDH1 | HTA11_99999965104_69814 | Human | Colorectum | MSS | 3.14e-25 | 1.33e+00 | 0.281 |
| 999 | CDH1 | HTA11_99999971662_82457 | Human | Colorectum | MSS | 5.58e-29 | 1.55e+00 | 0.3859 |
| 999 | CDH1 | F007 | Human | Colorectum | FAP | 5.78e-03 | -3.06e-01 | 0.1176 |
| 999 | CDH1 | A001-C-207 | Human | Colorectum | FAP | 2.08e-03 | -1.17e-01 | 0.1278 |
| 999 | CDH1 | A015-C-203 | Human | Colorectum | FAP | 3.67e-22 | -3.62e-01 | -0.1294 |
| 999 | CDH1 | A015-C-204 | Human | Colorectum | FAP | 1.09e-08 | -2.96e-01 | -0.0228 |
| 999 | CDH1 | A014-C-040 | Human | Colorectum | FAP | 4.38e-06 | -4.63e-01 | -0.1184 |
| 999 | CDH1 | A002-C-201 | Human | Colorectum | FAP | 3.32e-14 | -2.96e-01 | 0.0324 |
| 999 | CDH1 | A001-C-119 | Human | Colorectum | FAP | 6.58e-07 | -5.03e-02 | -0.1557 |
| 999 | CDH1 | A001-C-108 | Human | Colorectum | FAP | 2.79e-08 | -6.06e-02 | -0.0272 |
| Page: 1 2 3 4 5 6 7 8 9 10 11 12 13 |
| Tissue | Expression Dynamics | Abbreviation |
| Cervix |  | CC: Cervix cancer |
| HSIL_HPV: HPV-infected high-grade squamous intraepithelial lesions | ||
| N_HPV: HPV-infected normal cervix | ||
| Colorectum (GSE201348) |  | FAP: Familial adenomatous polyposis |
| CRC: Colorectal cancer | ||
| Colorectum (HTA11) | 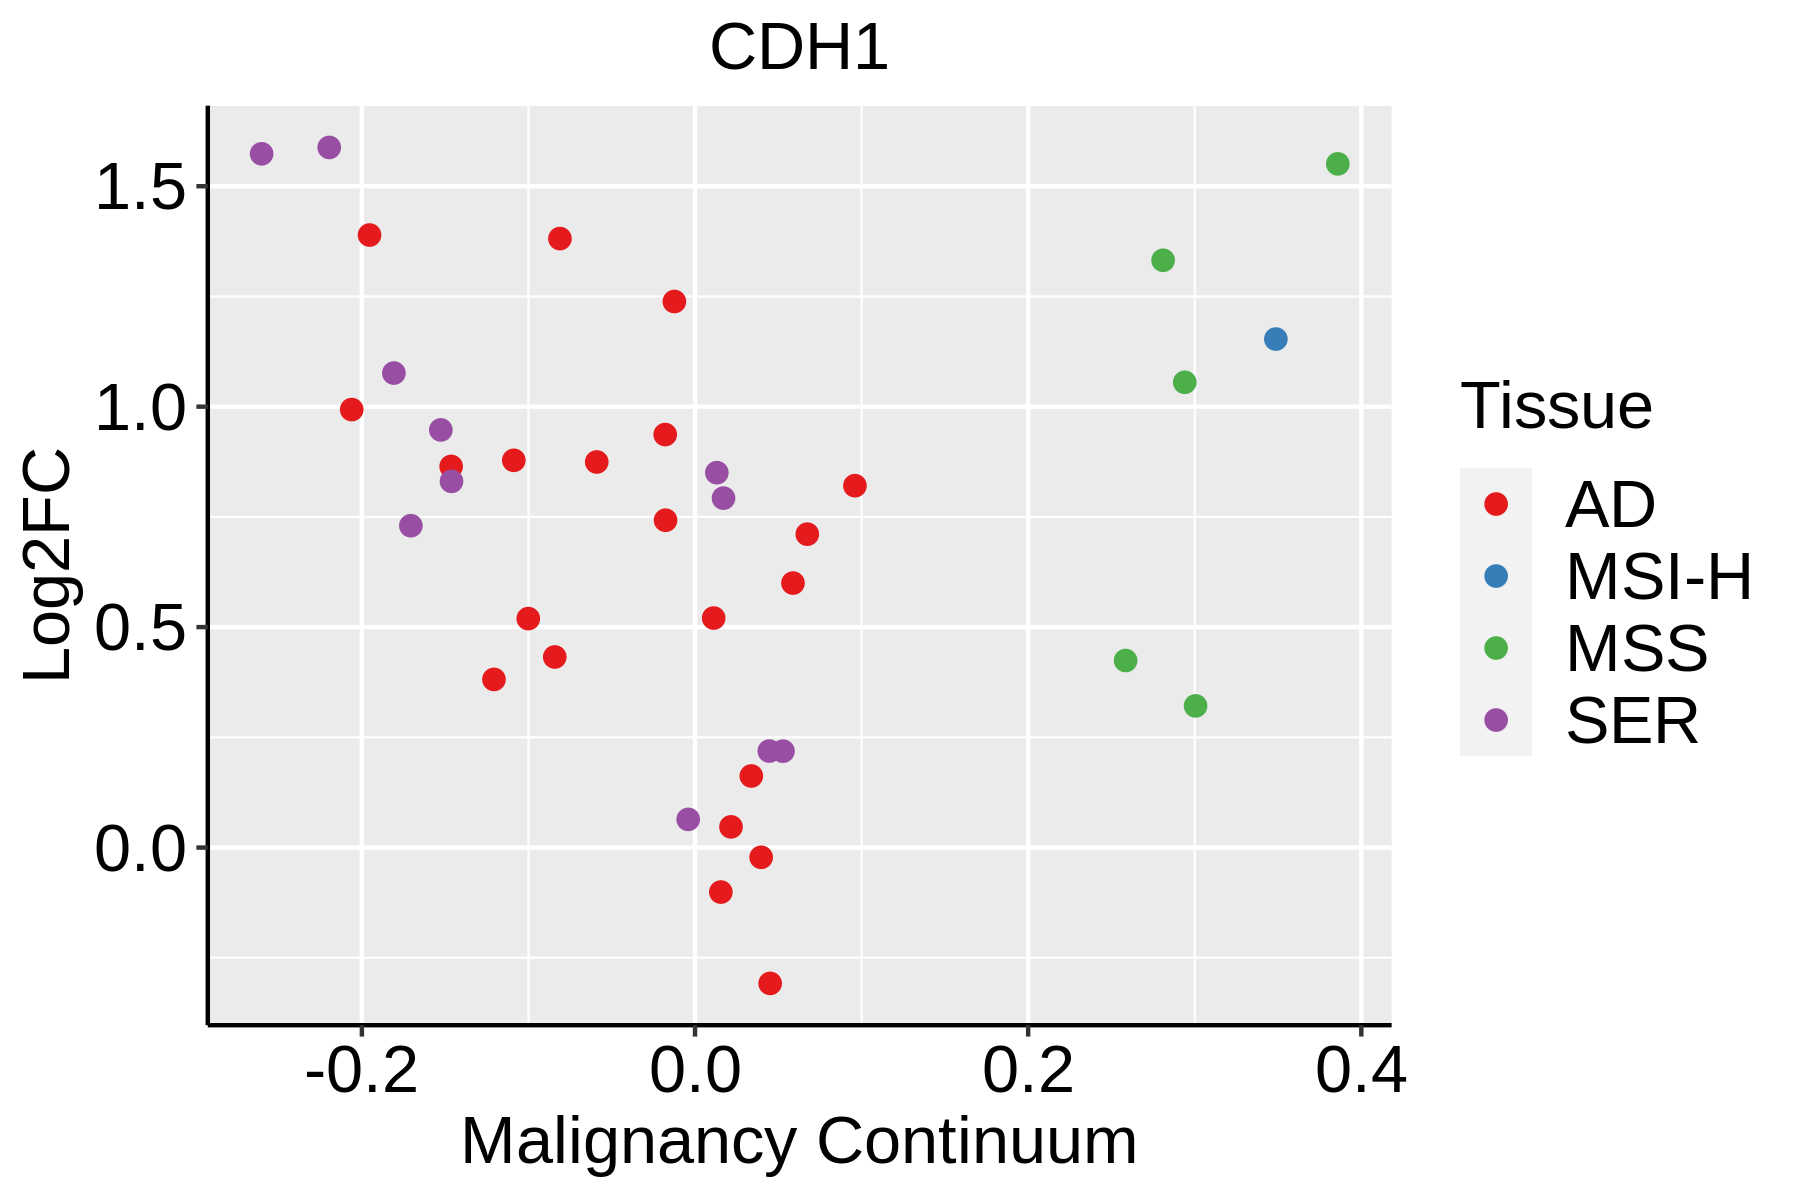 | AD: Adenomas |
| SER: Sessile serrated lesions | ||
| MSI-H: Microsatellite-high colorectal cancer | ||
| MSS: Microsatellite stable colorectal cancer | ||
| Endometrium | 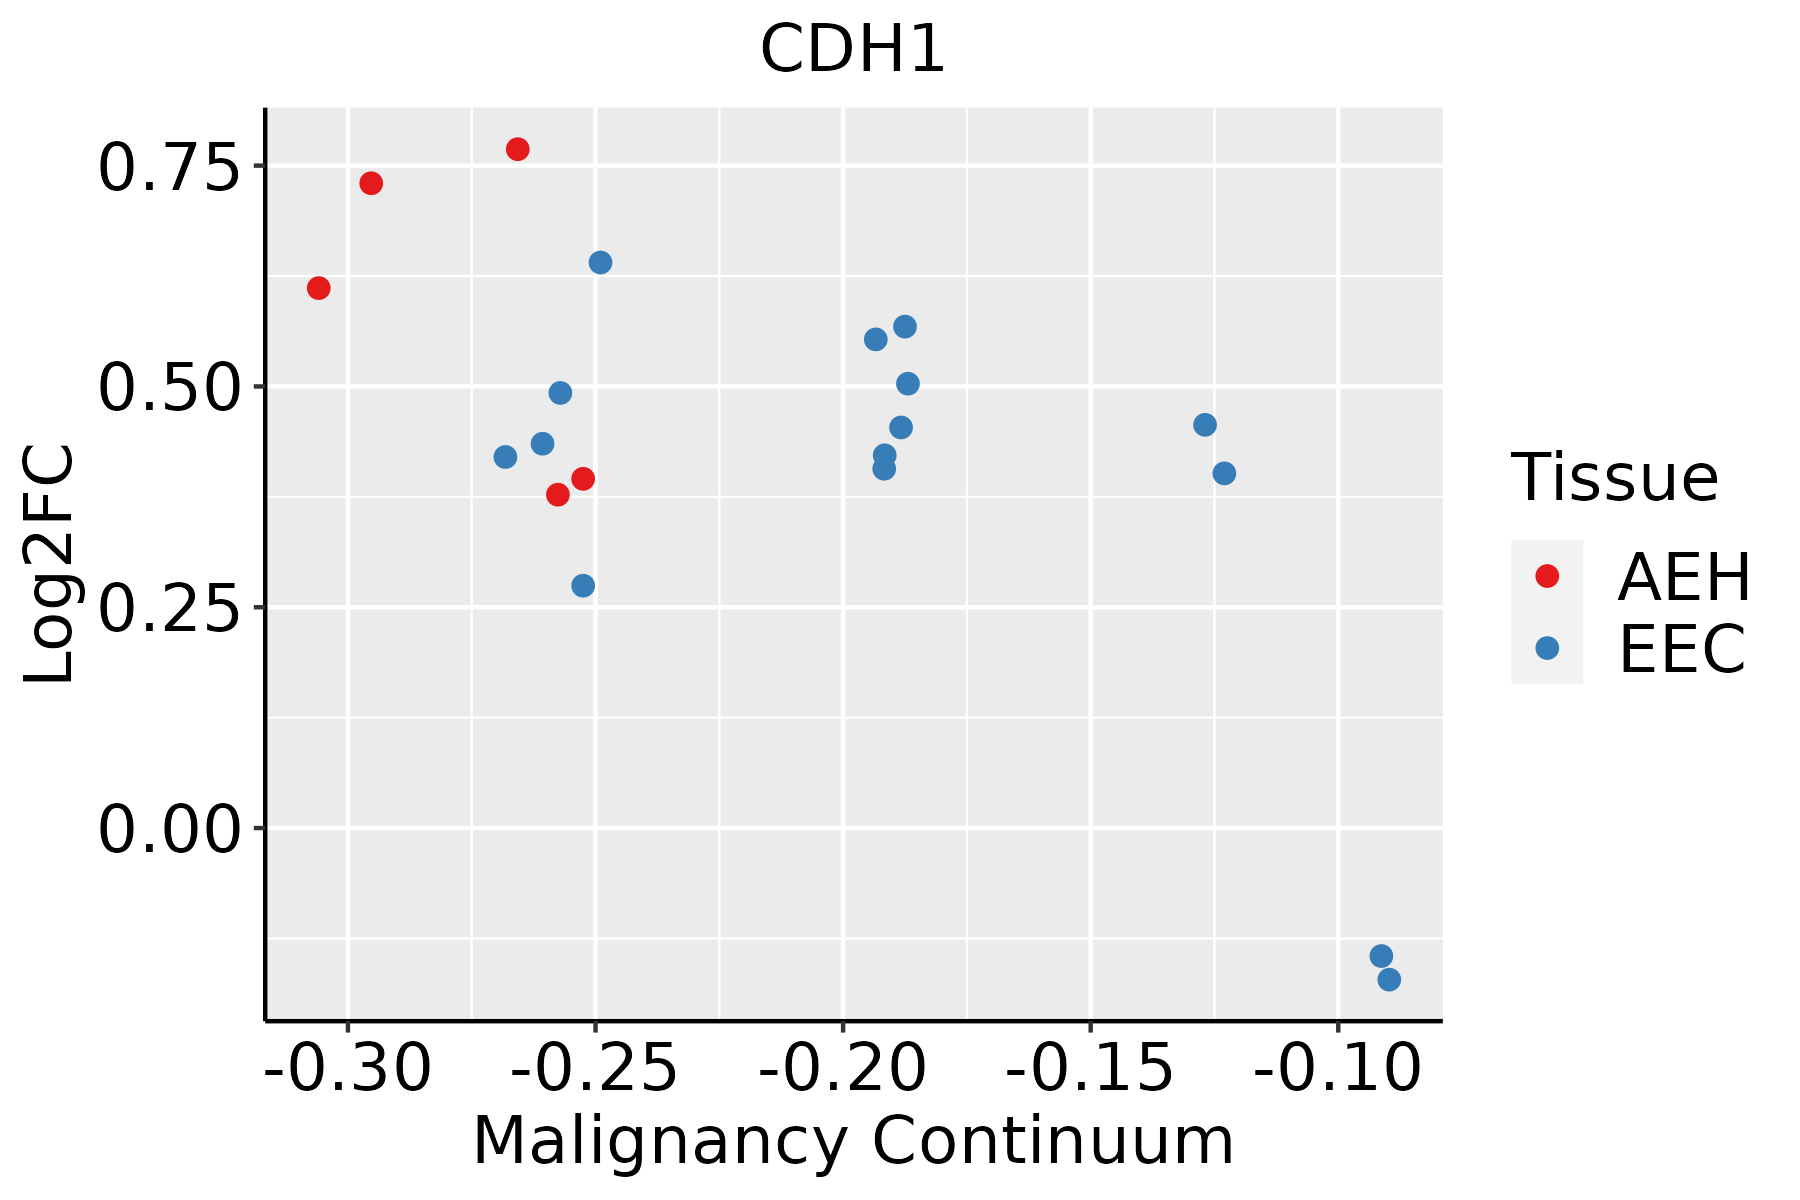 | AEH: Atypical endometrial hyperplasia |
| EEC: Endometrioid Cancer | ||
| Esophagus |  | ESCC: Esophageal squamous cell carcinoma |
| HGIN: High-grade intraepithelial neoplasias | ||
| LGIN: Low-grade intraepithelial neoplasias | ||
| GC | 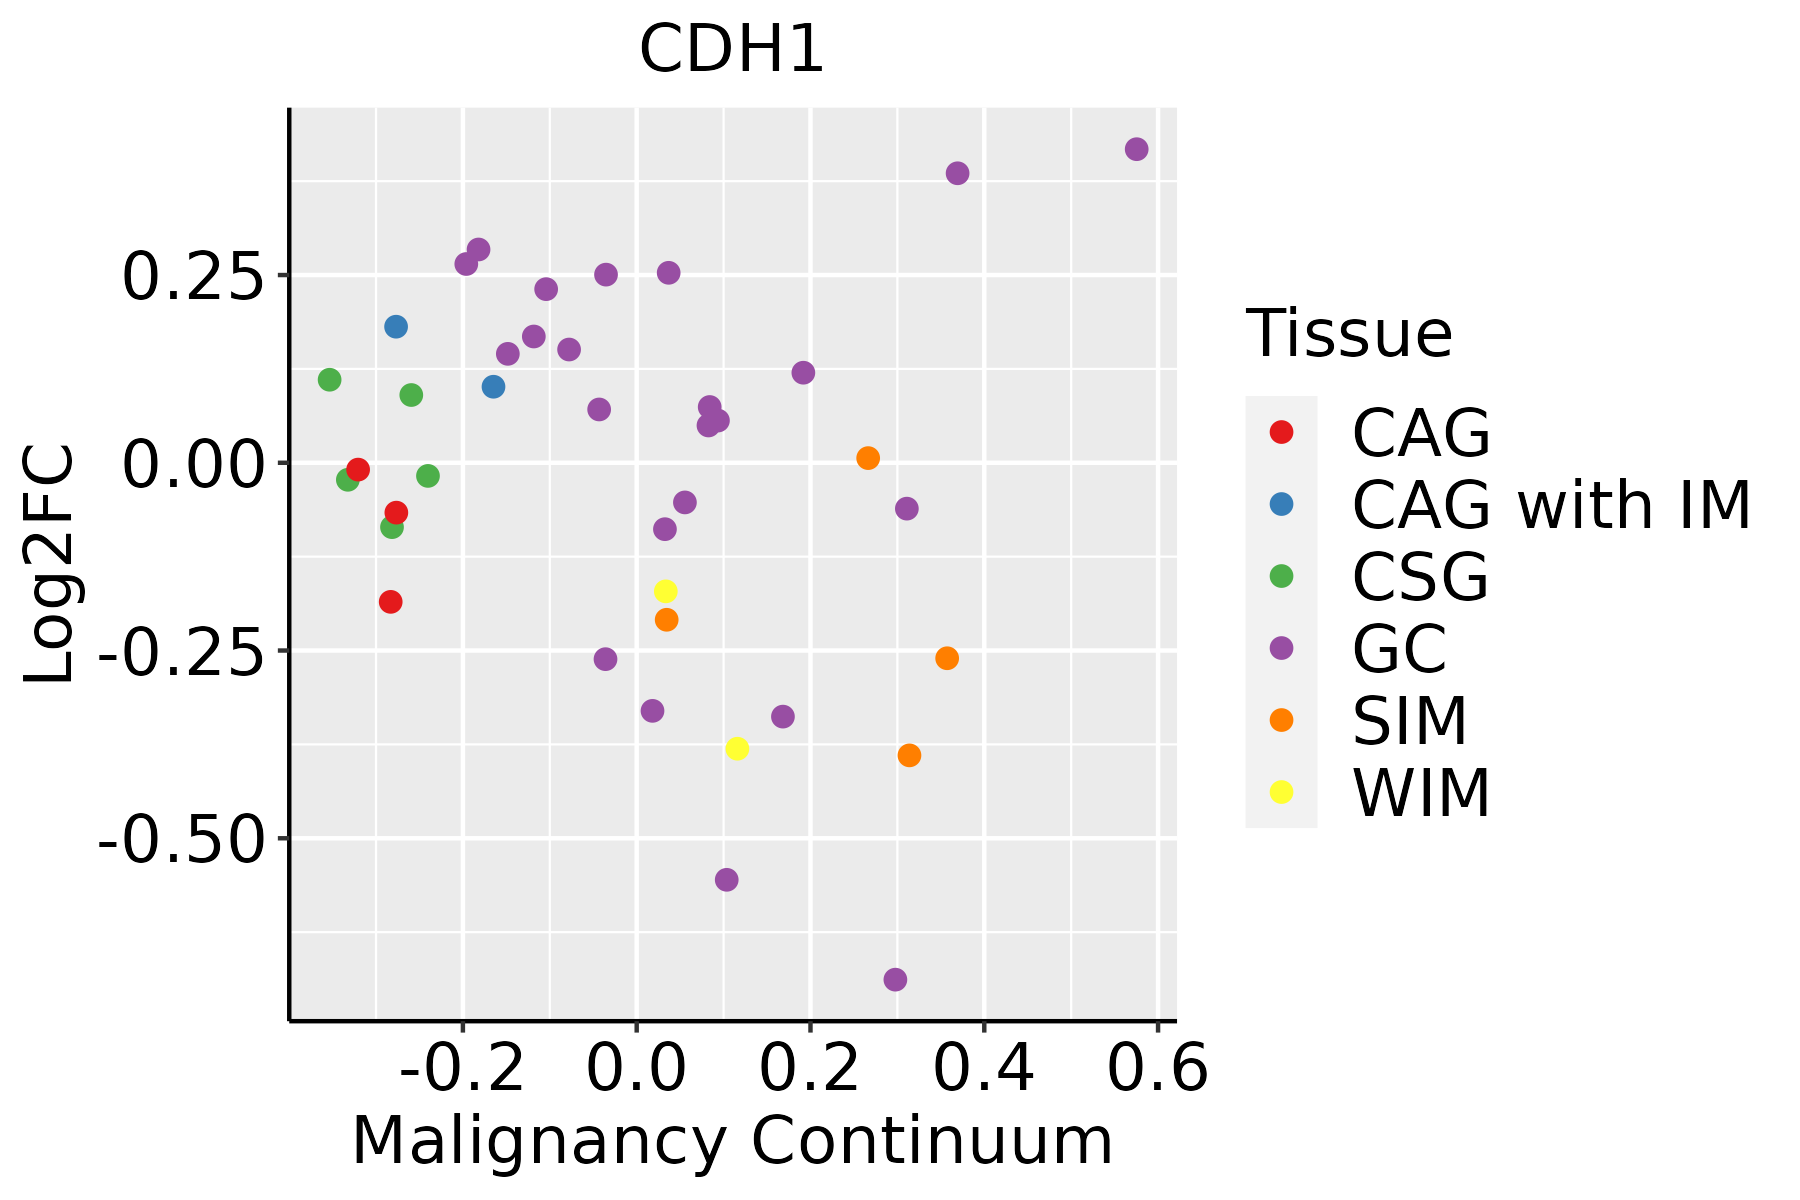 | CAG: Chronic atrophic gastritis |
| CAG with IM: Chronic atrophic gastritis with intestinal metaplasia | ||
| CSG: Chronic superficial gastritis | ||
| GC: Gastric cancer | ||
| SIM: Severe intestinal metaplasia | ||
| WIM: Wild intestinal metaplasia | ||
| Liver | 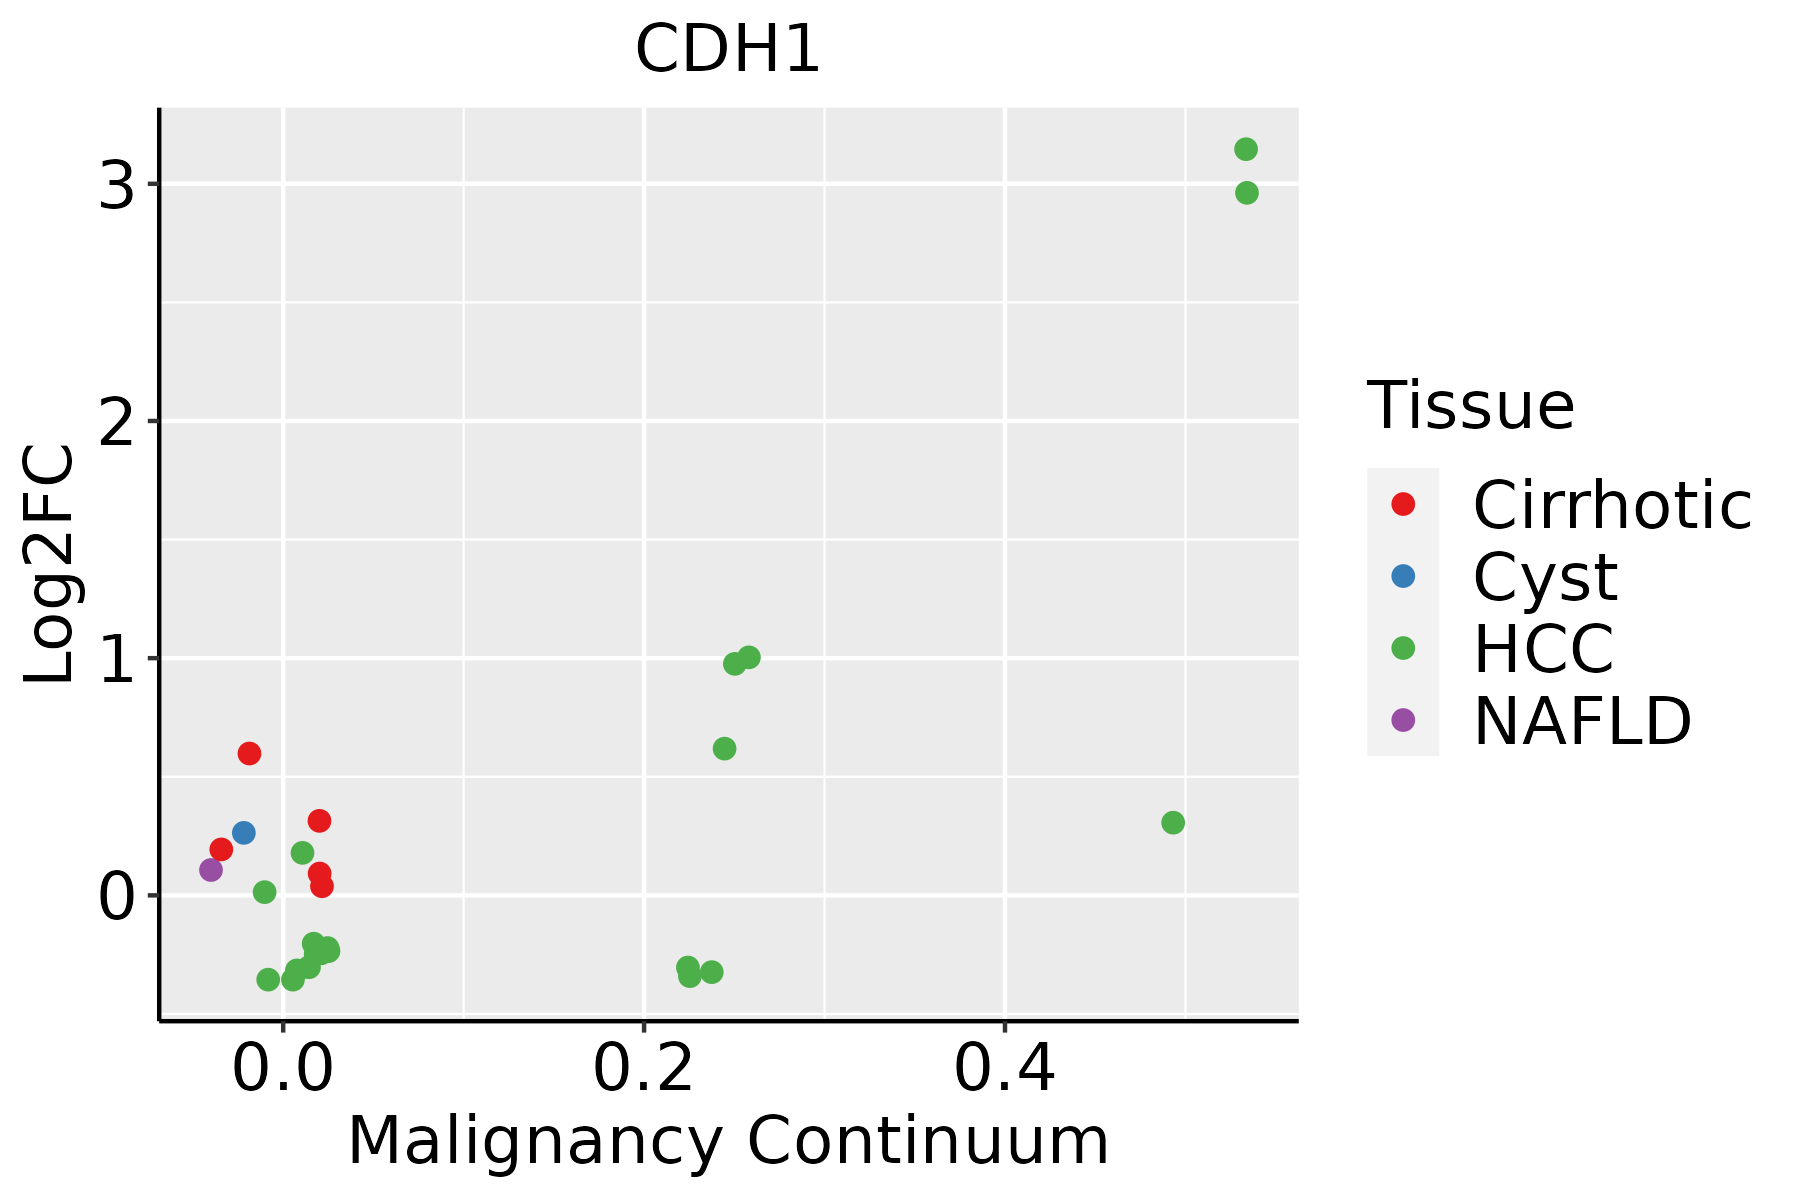 | HCC: Hepatocellular carcinoma |
| NAFLD: Non-alcoholic fatty liver disease | ||
| Lung | 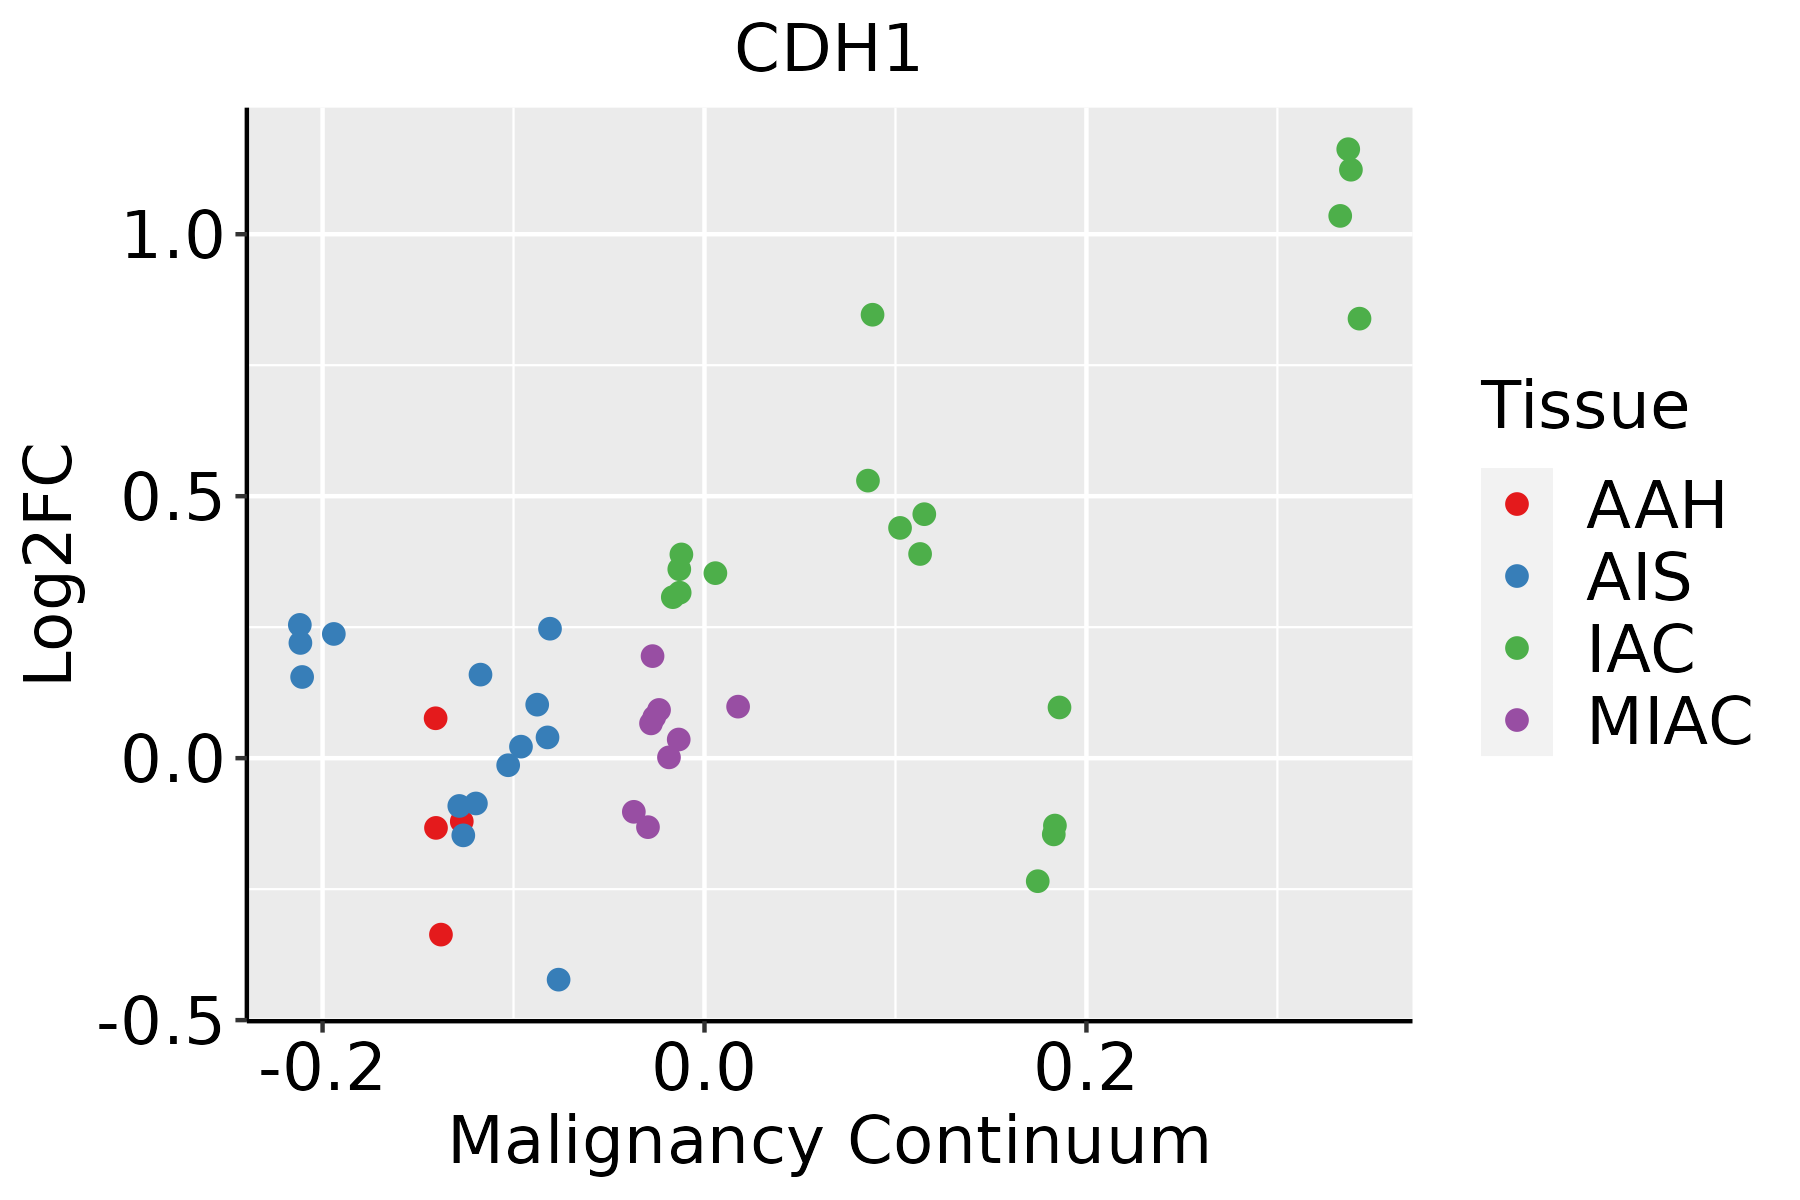 | AAH: Atypical adenomatous hyperplasia |
| AIS: Adenocarcinoma in situ | ||
| IAC: Invasive lung adenocarcinoma | ||
| MIA: Minimally invasive adenocarcinoma | ||
| Oral Cavity |  | EOLP: Erosive Oral lichen planus |
| LP: leukoplakia | ||
| NEOLP: Non-erosive oral lichen planus | ||
| OSCC: Oral squamous cell carcinoma | ||
| Prostate | 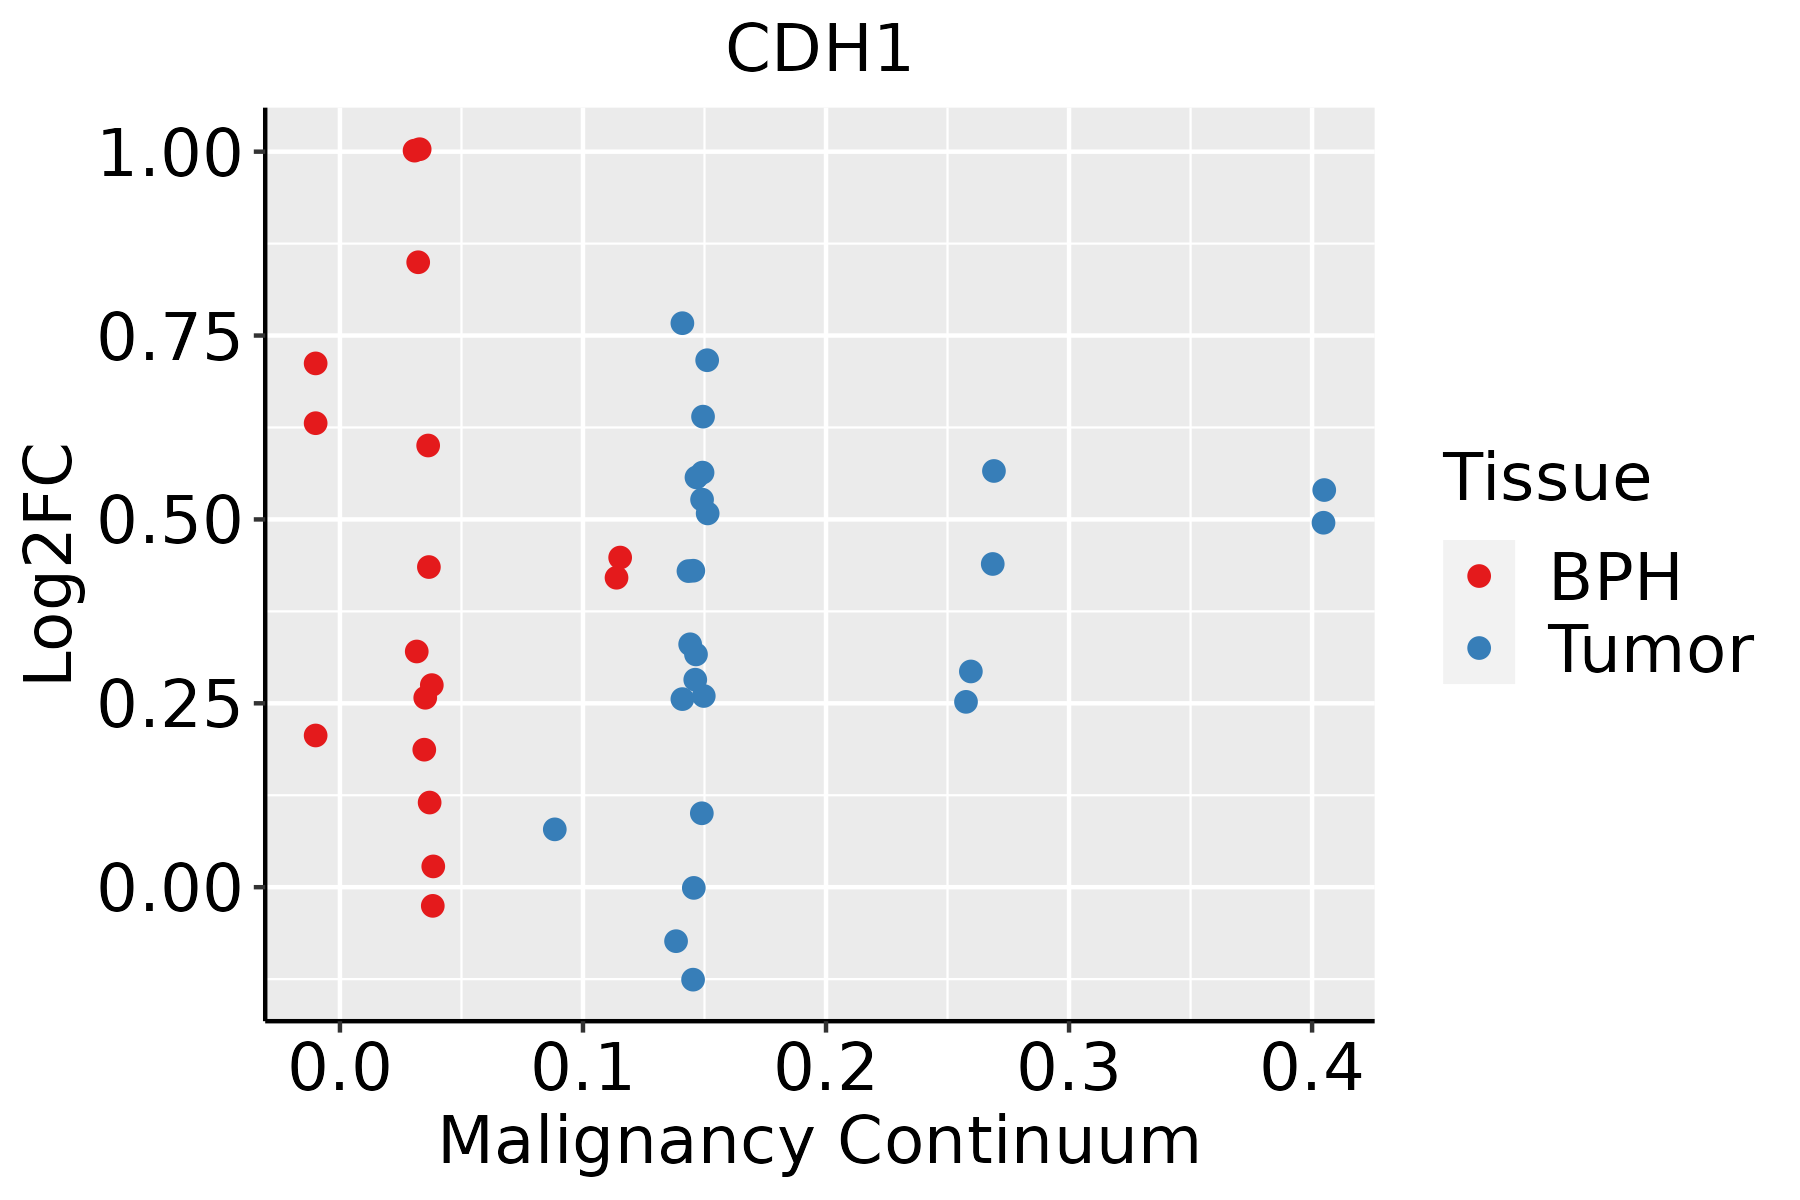 | BPH: Benign Prostatic Hyperplasia |
| Skin | 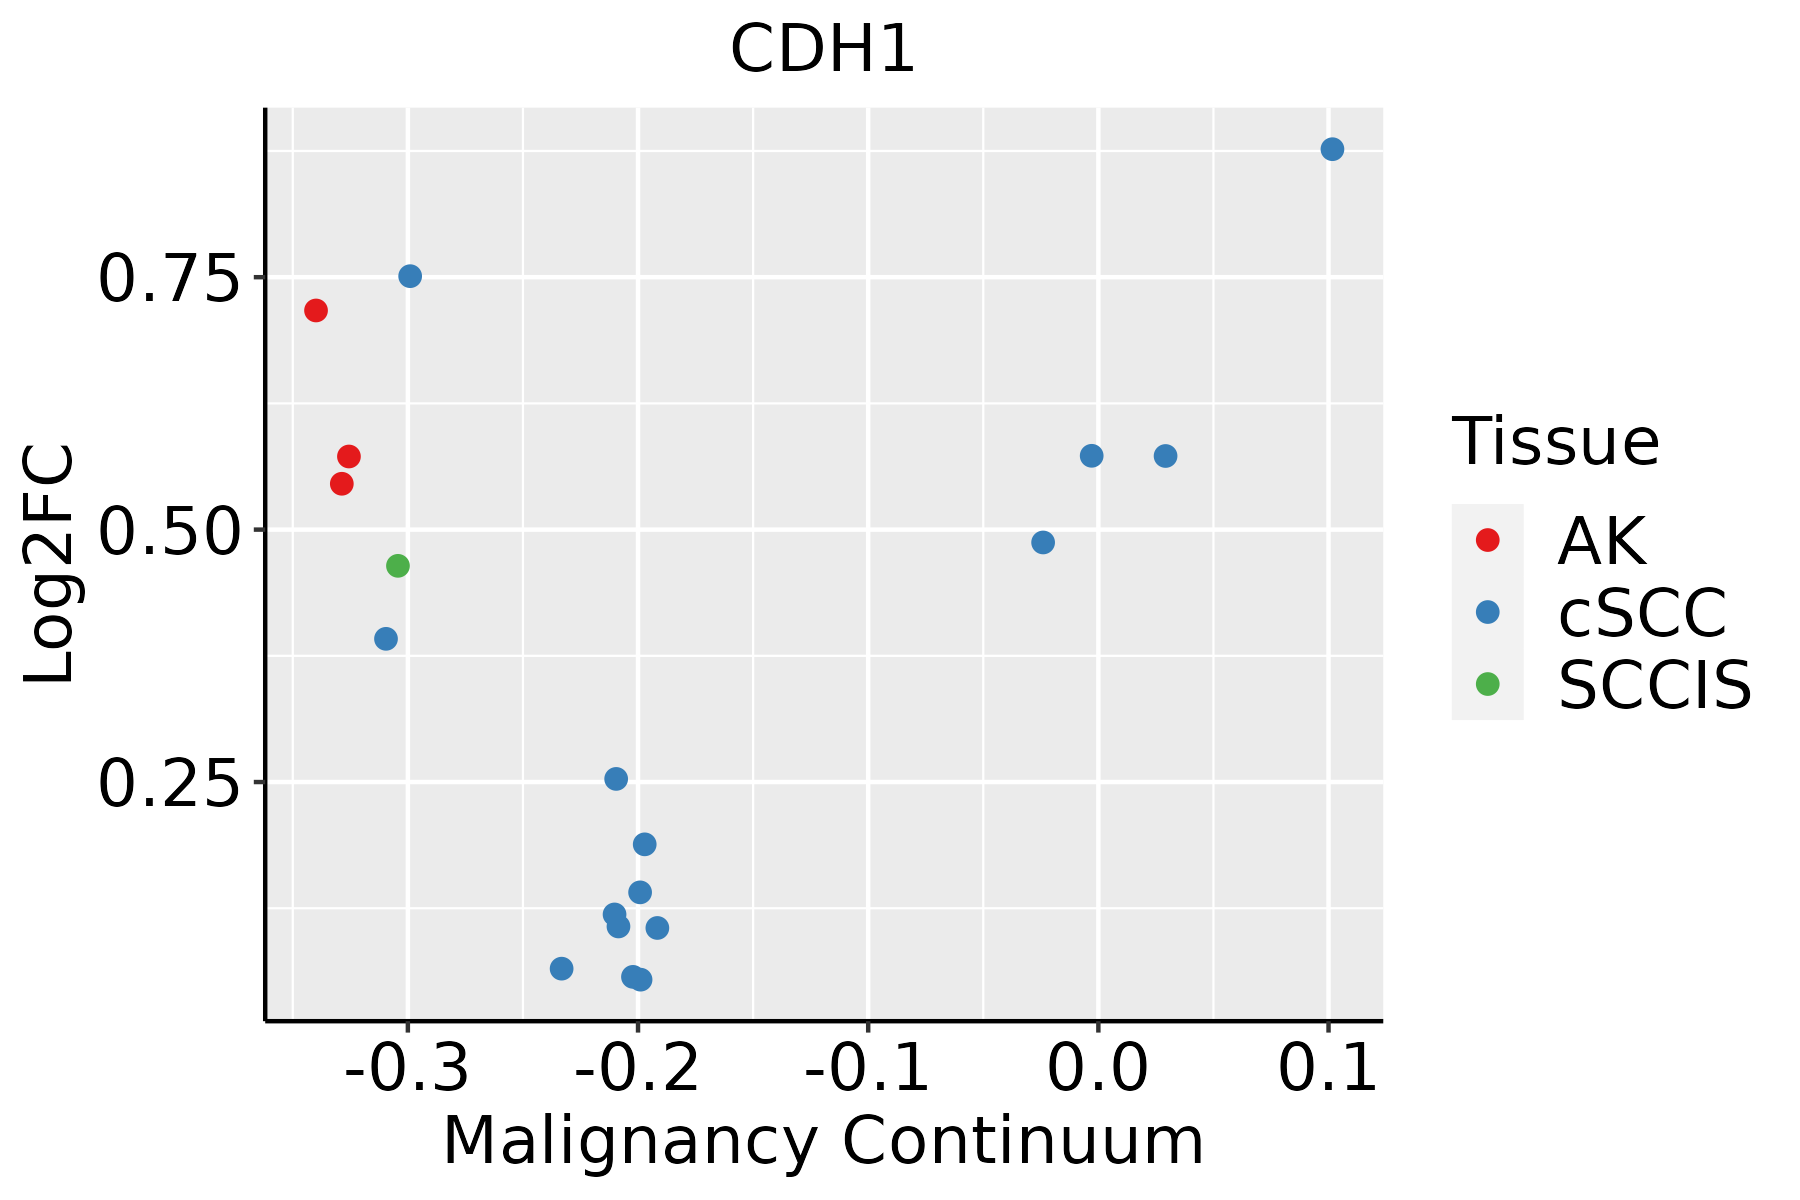 | AK: Actinic keratosis |
| cSCC: Cutaneous squamous cell carcinoma | ||
| SCCIS:squamous cell carcinoma in situ | ||
| Thyroid | 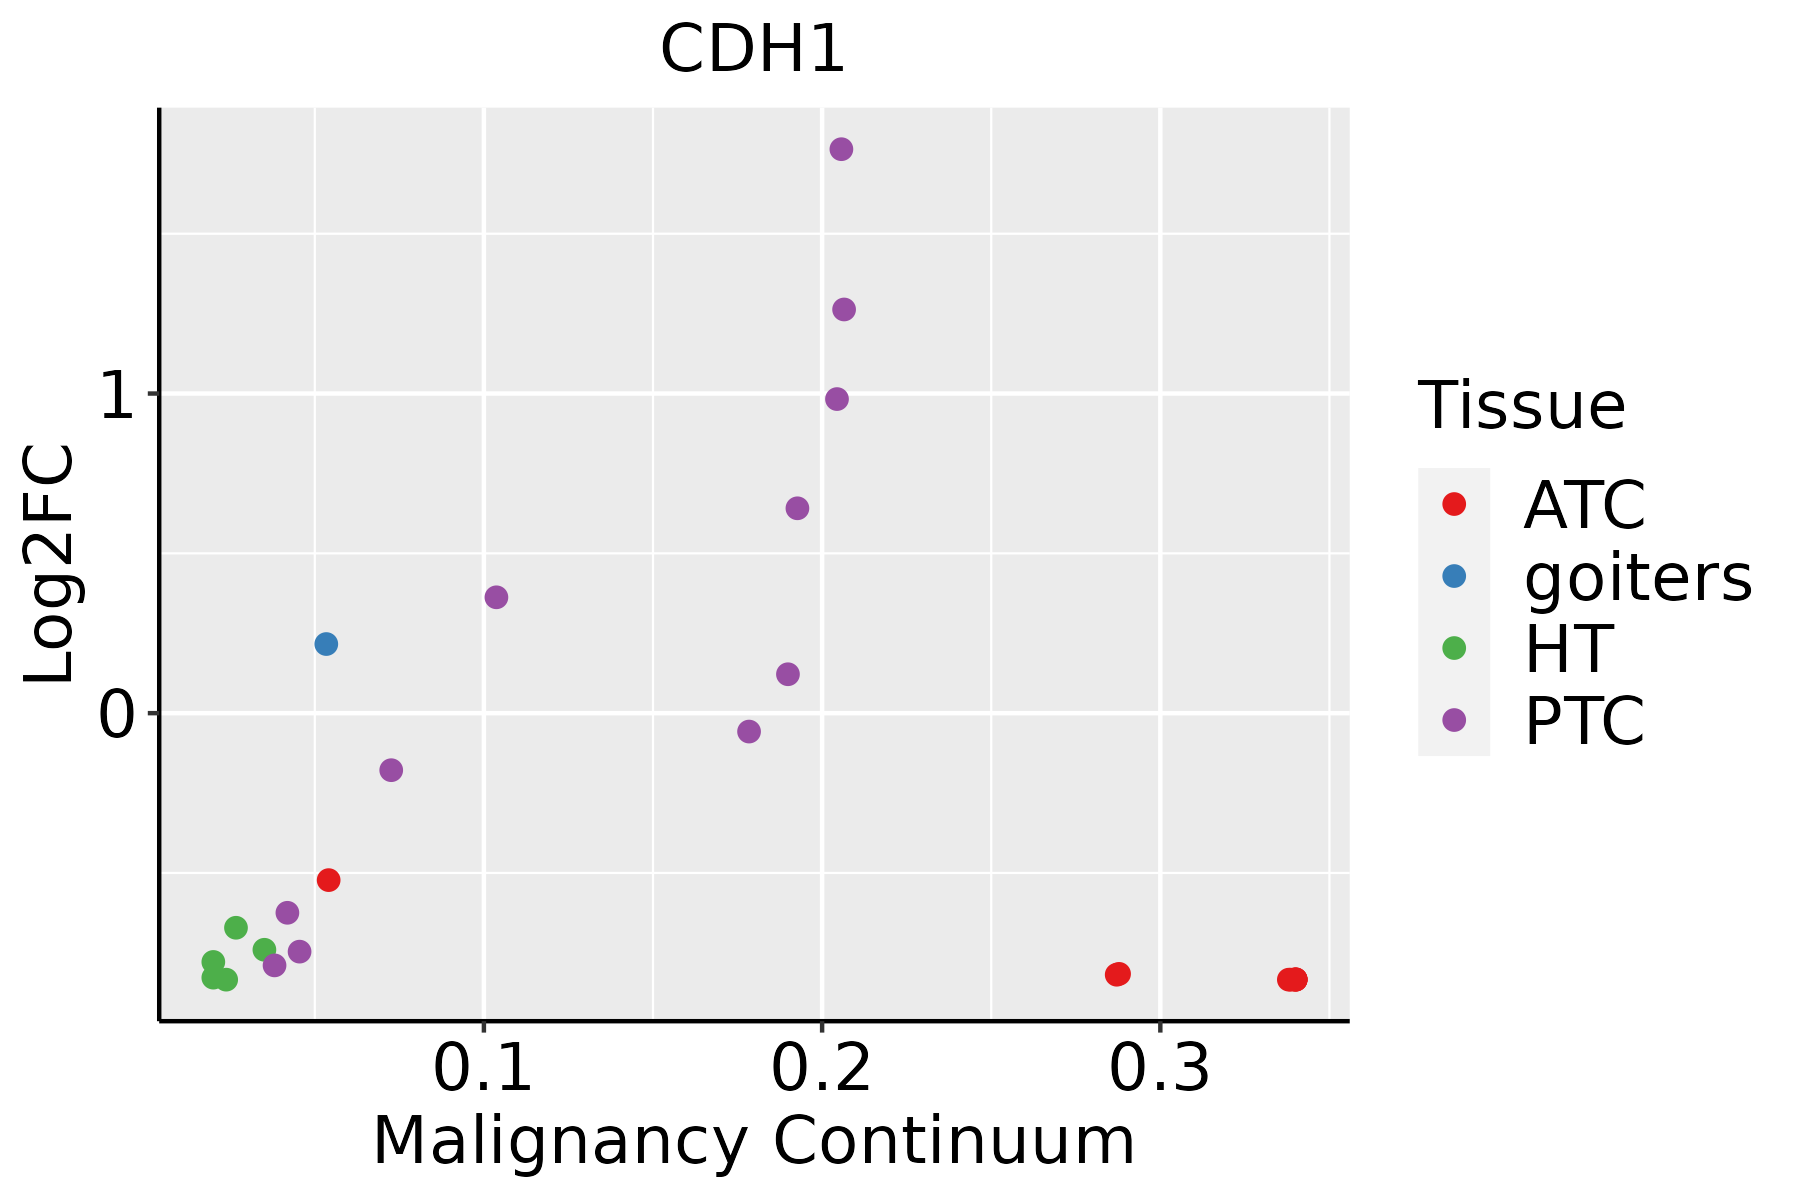 | ATC: Anaplastic thyroid cancer |
| HT: Hashimoto's thyroiditis | ||
| PTC: Papillary thyroid cancer |
| ∗log2FC in expression of this searched gene in stem-like cells from each diseased tissue sample relative to stem-like cells in normal samples in each tissue plotted against the malignancy continuum. Samples are colored based on if they are from different disease stage. |
Top |
Malignant transformation related pathway analysis |
| Find out the enriched GO biological processes and KEGG pathways involved in transition from healthy to precancer to cancer |
| Tissue | Disease Stage | Enriched GO biological Processes |
| Colorectum | AD |  |
| Colorectum | SER |  |
| Colorectum | MSS |  |
| Colorectum | MSI-H |  |
| Colorectum | FAP |  |
| ∗Top 15 enriched GO BP terms are showed in the bar plot of each disease state in each tissue. Each row represents a significant GO biological process which is colored according to the -log10(p.adjust). |
| Page: 1 2 3 4 5 6 7 8 9 |
| GO ID | Tissue | Disease Stage | Description | Gene Ratio | Bg Ratio | pvalue | p.adjust | Count |
| GO:004217610 | Cervix | CC | regulation of protein catabolic process | 104/2311 | 391/18723 | 9.39e-15 | 9.36e-12 | 104 |
| GO:00725949 | Cervix | CC | establishment of protein localization to organelle | 99/2311 | 422/18723 | 1.23e-10 | 2.11e-08 | 99 |
| GO:002240710 | Cervix | CC | regulation of cell-cell adhesion | 103/2311 | 448/18723 | 1.78e-10 | 2.87e-08 | 103 |
| GO:190382910 | Cervix | CC | positive regulation of cellular protein localization | 72/2311 | 276/18723 | 3.20e-10 | 4.46e-08 | 72 |
| GO:007265910 | Cervix | CC | protein localization to plasma membrane | 73/2311 | 284/18723 | 4.95e-10 | 6.73e-08 | 73 |
| GO:19907788 | Cervix | CC | protein localization to cell periphery | 78/2311 | 333/18723 | 1.22e-08 | 9.73e-07 | 78 |
| GO:00071626 | Cervix | CC | negative regulation of cell adhesion | 72/2311 | 303/18723 | 2.36e-08 | 1.70e-06 | 72 |
| GO:005122210 | Cervix | CC | positive regulation of protein transport | 72/2311 | 303/18723 | 2.36e-08 | 1.70e-06 | 72 |
| GO:00452169 | Cervix | CC | cell-cell junction organization | 53/2311 | 200/18723 | 3.83e-08 | 2.53e-06 | 53 |
| GO:00069139 | Cervix | CC | nucleocytoplasmic transport | 71/2311 | 301/18723 | 4.04e-08 | 2.54e-06 | 71 |
| GO:00511699 | Cervix | CC | nuclear transport | 71/2311 | 301/18723 | 4.04e-08 | 2.54e-06 | 71 |
| GO:190495110 | Cervix | CC | positive regulation of establishment of protein localization | 73/2311 | 319/18723 | 9.69e-08 | 5.25e-06 | 73 |
| GO:00345048 | Cervix | CC | protein localization to nucleus | 68/2311 | 290/18723 | 9.91e-08 | 5.25e-06 | 68 |
| GO:00343298 | Cervix | CC | cell junction assembly | 88/2311 | 420/18723 | 3.42e-07 | 1.38e-05 | 88 |
| GO:00224084 | Cervix | CC | negative regulation of cell-cell adhesion | 48/2311 | 196/18723 | 1.99e-06 | 6.18e-05 | 48 |
| GO:00468229 | Cervix | CC | regulation of nucleocytoplasmic transport | 31/2311 | 106/18723 | 2.68e-06 | 7.87e-05 | 31 |
| GO:00903167 | Cervix | CC | positive regulation of intracellular protein transport | 41/2311 | 160/18723 | 3.24e-06 | 8.80e-05 | 41 |
| GO:00323868 | Cervix | CC | regulation of intracellular transport | 71/2311 | 337/18723 | 3.70e-06 | 9.74e-05 | 71 |
| GO:00331579 | Cervix | CC | regulation of intracellular protein transport | 52/2311 | 229/18723 | 8.16e-06 | 1.88e-04 | 52 |
| GO:00170388 | Cervix | CC | protein import | 48/2311 | 206/18723 | 8.62e-06 | 1.98e-04 | 48 |
| Page: 1 2 3 4 5 6 7 8 9 10 11 12 13 14 15 16 17 18 19 20 21 22 23 24 25 26 27 28 29 30 31 32 33 34 35 36 37 38 39 40 41 42 43 44 45 46 47 48 49 50 51 52 53 54 55 56 57 58 59 60 61 62 63 64 65 66 67 68 |
| Pathway ID | Tissue | Disease Stage | Description | Gene Ratio | Bg Ratio | pvalue | p.adjust | qvalue | Count |
| hsa0452020 | Cervix | CC | Adherens junction | 33/1267 | 93/8465 | 6.99e-07 | 7.31e-06 | 4.32e-06 | 33 |
| hsa0401512 | Cervix | CC | Rap1 signaling pathway | 56/1267 | 210/8465 | 6.23e-06 | 5.61e-05 | 3.32e-05 | 56 |
| hsa052197 | Cervix | CC | Bladder cancer | 16/1267 | 41/8465 | 1.45e-04 | 9.05e-04 | 5.35e-04 | 16 |
| hsa043908 | Cervix | CC | Hippo signaling pathway | 40/1267 | 157/8465 | 3.64e-04 | 1.82e-03 | 1.07e-03 | 40 |
| hsa0510020 | Cervix | CC | Bacterial invasion of epithelial cells | 23/1267 | 77/8465 | 6.25e-04 | 2.93e-03 | 1.73e-03 | 23 |
| hsa0521310 | Cervix | CC | Endometrial cancer | 18/1267 | 58/8465 | 1.46e-03 | 6.30e-03 | 3.73e-03 | 18 |
| hsa045147 | Cervix | CC | Cell adhesion molecules | 36/1267 | 157/8465 | 4.94e-03 | 1.67e-02 | 9.86e-03 | 36 |
| hsa04520110 | Cervix | CC | Adherens junction | 33/1267 | 93/8465 | 6.99e-07 | 7.31e-06 | 4.32e-06 | 33 |
| hsa0401513 | Cervix | CC | Rap1 signaling pathway | 56/1267 | 210/8465 | 6.23e-06 | 5.61e-05 | 3.32e-05 | 56 |
| hsa0521914 | Cervix | CC | Bladder cancer | 16/1267 | 41/8465 | 1.45e-04 | 9.05e-04 | 5.35e-04 | 16 |
| hsa0439013 | Cervix | CC | Hippo signaling pathway | 40/1267 | 157/8465 | 3.64e-04 | 1.82e-03 | 1.07e-03 | 40 |
| hsa05100110 | Cervix | CC | Bacterial invasion of epithelial cells | 23/1267 | 77/8465 | 6.25e-04 | 2.93e-03 | 1.73e-03 | 23 |
| hsa0521313 | Cervix | CC | Endometrial cancer | 18/1267 | 58/8465 | 1.46e-03 | 6.30e-03 | 3.73e-03 | 18 |
| hsa0451412 | Cervix | CC | Cell adhesion molecules | 36/1267 | 157/8465 | 4.94e-03 | 1.67e-02 | 9.86e-03 | 36 |
| hsa0510025 | Cervix | N_HPV | Bacterial invasion of epithelial cells | 10/349 | 77/8465 | 1.17e-03 | 7.93e-03 | 6.20e-03 | 10 |
| hsa0510035 | Cervix | N_HPV | Bacterial invasion of epithelial cells | 10/349 | 77/8465 | 1.17e-03 | 7.93e-03 | 6.20e-03 | 10 |
| hsa05100 | Colorectum | AD | Bacterial invasion of epithelial cells | 44/2092 | 77/8465 | 1.13e-09 | 2.22e-08 | 1.42e-08 | 44 |
| hsa04520 | Colorectum | AD | Adherens junction | 50/2092 | 93/8465 | 1.52e-09 | 2.83e-08 | 1.81e-08 | 50 |
| hsa05213 | Colorectum | AD | Endometrial cancer | 29/2092 | 58/8465 | 2.69e-05 | 2.57e-04 | 1.64e-04 | 29 |
| hsa05216 | Colorectum | AD | Thyroid cancer | 21/2092 | 37/8465 | 3.05e-05 | 2.76e-04 | 1.76e-04 | 21 |
| Page: 1 2 3 4 5 6 7 8 9 10 11 12 |
Top |
Cell-cell communication analysis |
| Identification of potential cell-cell interactions between two cell types and their ligand-receptor pairs for different disease states |
| Ligand | Receptor | LRpair | Pathway | Tissue | Disease Stage |
| CDH1 | ITGA2_ITGB1 | CDH1_ITGA1_ITGB1 | CDH1 | Breast | ADJ |
| CDH1 | CDH1 | CDH1_CDH1 | CDH | Breast | ADJ |
| ANGPTL4 | CDH11 | ANGPTL4_CDH11 | ANGPTL | Breast | DCIS |
| CDH1 | ITGA2_ITGB1 | CDH1_ITGA1_ITGB1 | CDH1 | Breast | DCIS |
| CDH1 | ITGAE_ITGB7 | CDH1_ITGAE_ITGB7 | CDH1 | Breast | DCIS |
| CDH1 | KLRG1 | CDH1_KLRG1 | CDH1 | Breast | DCIS |
| CDH1 | CDH1 | CDH1_CDH1 | CDH | Breast | DCIS |
| ANGPTL4 | CDH11 | ANGPTL4_CDH11 | ANGPTL | Breast | Healthy |
| CDH1 | ITGA2_ITGB1 | CDH1_ITGA1_ITGB1 | CDH1 | Breast | Healthy |
| CDH1 | ITGAE_ITGB7 | CDH1_ITGAE_ITGB7 | CDH1 | Breast | Healthy |
| CDH1 | KLRG1 | CDH1_KLRG1 | CDH1 | Breast | Healthy |
| CDH1 | CDH1 | CDH1_CDH1 | CDH | Breast | Healthy |
| ANGPTL4 | CDH11 | ANGPTL4_CDH11 | ANGPTL | Breast | IDC |
| CDH1 | ITGA2_ITGB1 | CDH1_ITGA1_ITGB1 | CDH1 | Breast | Precancer |
| CDH1 | CDH1 | CDH1_CDH1 | CDH | Breast | Precancer |
| CDH1 | ITGA2_ITGB1 | CDH1_ITGA1_ITGB1 | CDH1 | Cervix | ADJ |
| CDH1 | CDH1 | CDH1_CDH1 | CDH | Cervix | ADJ |
| CDH1 | ITGA2_ITGB1 | CDH1_ITGA1_ITGB1 | CDH1 | Cervix | CC |
| CDH1 | KLRG1 | CDH1_KLRG1 | CDH1 | Cervix | CC |
| CDH1 | CDH1 | CDH1_CDH1 | CDH | Cervix | CC |
| Page: 1 2 3 4 5 6 7 |
Top |
Single-cell gene regulatory network inference analysis |
| Find out the significant the regulons (TFs) and the target genes of each regulon across cell types for different disease states |
| TF | Cell Type | Tissue | Disease Stage | Target Gene | RSS | Regulon Activity |
| ∗The dot plots of a searched regulon are shown for all cell subpopulations in each disease state of each tissue based on the regulon specific score inferred using pySCENIC and by calculating the average expression. |
| Page: 1 |
Top |
Somatic mutation of malignant transformation related genes |
| Annotation of somatic variants for genes involved in malignant transformation |
| Hugo Symbol | Variant Class | Variant Classification | dbSNP RS | HGVSc | HGVSp | HGVSp Short | SWISSPROT | BIOTYPE | SIFT | PolyPhen | Tumor Sample Barcode | Tissue | Histology | Sex | Age | Stage | Therapy Types | Drugs | Outcome |
| CDH1 | SNV | Missense_Mutation | c.727N>A | p.Glu243Lys | p.E243K | P12830 | protein_coding | deleterious(0) | probably_damaging(0.997) | TCGA-A1-A0SE-01 | Breast | breast invasive carcinoma | Female | <65 | I/II | Unknown | Unknown | SD | |
| CDH1 | SNV | Missense_Mutation | rs587782623 | c.2600A>G | p.Asn867Ser | p.N867S | P12830 | protein_coding | tolerated(0.43) | benign(0.264) | TCGA-A2-A1G0-01 | Breast | breast invasive carcinoma | Female | <65 | I/II | Chemotherapy | taxotere | SD |
| CDH1 | SNV | Missense_Mutation | c.727N>A | p.Glu243Lys | p.E243K | P12830 | protein_coding | deleterious(0) | probably_damaging(0.997) | TCGA-A8-A091-01 | Breast | breast invasive carcinoma | Female | <65 | I/II | Chemotherapy | 5-fluorouracil | PD | |
| CDH1 | SNV | Missense_Mutation | c.727N>A | p.Glu243Lys | p.E243K | P12830 | protein_coding | deleterious(0) | probably_damaging(0.997) | TCGA-A8-A0A7-01 | Breast | breast invasive carcinoma | Female | <65 | I/II | Unknown | Unknown | SD | |
| CDH1 | SNV | Missense_Mutation | c.846N>T | p.Met282Ile | p.M282I | P12830 | protein_coding | tolerated(0.18) | probably_damaging(0.922) | TCGA-AC-A3W6-01 | Breast | breast invasive carcinoma | Female | >=65 | III/IV | Unknown | Unknown | SD | |
| CDH1 | SNV | Missense_Mutation | novel | c.1316C>A | p.Ala439Glu | p.A439E | P12830 | protein_coding | tolerated(0.06) | benign(0.398) | TCGA-AO-A03T-01 | Breast | breast invasive carcinoma | Female | <65 | I/II | Chemotherapy | cyclophosphamide | SD |
| CDH1 | SNV | Missense_Mutation | rs587782024 | c.2450N>T | p.Ala817Val | p.A817V | P12830 | protein_coding | deleterious(0.04) | probably_damaging(1) | TCGA-AO-A128-01 | Breast | breast invasive carcinoma | Female | <65 | I/II | Chemotherapy | doxorubicin | SD |
| CDH1 | SNV | Missense_Mutation | novel | c.493N>C | p.Glu165Gln | p.E165Q | P12830 | protein_coding | deleterious(0.01) | probably_damaging(1) | TCGA-AR-A2LJ-01 | Breast | breast invasive carcinoma | Female | <65 | III/IV | Chemotherapy | adriamycin | SD |
| CDH1 | SNV | Missense_Mutation | c.832N>A | p.Gly278Arg | p.G278R | P12830 | protein_coding | deleterious(0.01) | probably_damaging(0.999) | TCGA-AR-A2LL-01 | Breast | breast invasive carcinoma | Female | >=65 | I/II | Hormone Therapy | tamoxiphen | SD | |
| CDH1 | SNV | Missense_Mutation | c.779N>A | p.Pro260His | p.P260H | P12830 | protein_coding | deleterious(0) | probably_damaging(0.998) | TCGA-BH-A0BA-01 | Breast | breast invasive carcinoma | Female | <65 | III/IV | Chemotherapy | cytoxan | SD |
| Page: 1 2 3 4 5 6 7 8 9 10 11 12 13 14 15 16 17 18 19 |
Top |
Related drugs of malignant transformation related genes |
| Identification of chemicals and drugs interact with genes involved in malignant transfromation |
| (DGIdb 4.0) |
| Entrez ID | Symbol | Category | Interaction Types | Drug Claim Name | Drug Name | PMIDs |
| 999 | CDH1 | CLINICALLY ACTIONABLE, DRUGGABLE GENOME | Volasertib | VOLASERTIB | 26597303 | |
| 999 | CDH1 | CLINICALLY ACTIONABLE, DRUGGABLE GENOME | Erlotinib | ERLOTINIB | 26251290 | |
| 999 | CDH1 | CLINICALLY ACTIONABLE, DRUGGABLE GENOME | Selumetinib | SELUMETINIB | 26251290 | |
| 999 | CDH1 | CLINICALLY ACTIONABLE, DRUGGABLE GENOME | N/A | 26182300,26380059 | ||
| 999 | CDH1 | CLINICALLY ACTIONABLE, DRUGGABLE GENOME | PROTEOLYTIC ENZYMES | 2211831 | ||
| 999 | CDH1 | CLINICALLY ACTIONABLE, DRUGGABLE GENOME | Capecitabine | CAPECITABINE | 26487584 | |
| 999 | CDH1 | CLINICALLY ACTIONABLE, DRUGGABLE GENOME | BI2536 | 26597303 | ||
| 999 | CDH1 | CLINICALLY ACTIONABLE, DRUGGABLE GENOME | ANTISERUM | 3880756 | ||
| 999 | CDH1 | CLINICALLY ACTIONABLE, DRUGGABLE GENOME | Lapatinib | LAPATINIB | 26487584 |
| Page: 1 |

Copyright 2023-Present -The University of Texas Health Science Center at Houston |