
|
|||||
|
 | |
| |
| |
| |
| |
| |
|
Gene: CD3EAP |
Gene summary for CD3EAP |
| Gene information | Species | Human | Gene symbol | CD3EAP | Gene ID | 10849 |
| Gene name | RNA polymerase I subunit G | |
| Gene Alias | ASE-1 | |
| Cytomap | 19q13.32 | |
| Gene Type | protein-coding | GO ID | GO:0006139 | UniProtAcc | O15446 |
Top |
Malignant transformation analysis |
| Identification of the aberrant gene expression in precancerous and cancerous lesions by comparing the gene expression of stem-like cells in diseased tissues with normal stem cells |
| Entrez ID | Symbol | Replicates | Species | Organ | Tissue | Adj P-value | Log2FC | Malignancy |
| 10849 | CD3EAP | P27T-E | Human | Esophagus | ESCC | 3.81e-07 | 2.36e-02 | 0.1055 |
| 10849 | CD3EAP | P28T-E | Human | Esophagus | ESCC | 6.51e-08 | 2.87e-01 | 0.1149 |
| 10849 | CD3EAP | P30T-E | Human | Esophagus | ESCC | 1.71e-06 | 2.51e-01 | 0.137 |
| 10849 | CD3EAP | P31T-E | Human | Esophagus | ESCC | 7.18e-10 | 1.14e-01 | 0.1251 |
| 10849 | CD3EAP | P32T-E | Human | Esophagus | ESCC | 3.83e-10 | 3.41e-01 | 0.1666 |
| 10849 | CD3EAP | P36T-E | Human | Esophagus | ESCC | 2.12e-06 | 1.15e-01 | 0.1187 |
| 10849 | CD3EAP | P37T-E | Human | Esophagus | ESCC | 7.87e-11 | 2.71e-01 | 0.1371 |
| 10849 | CD3EAP | P39T-E | Human | Esophagus | ESCC | 2.77e-05 | -7.27e-02 | 0.0894 |
| 10849 | CD3EAP | P40T-E | Human | Esophagus | ESCC | 3.16e-09 | -2.45e-02 | 0.109 |
| 10849 | CD3EAP | P42T-E | Human | Esophagus | ESCC | 8.58e-07 | 1.03e-01 | 0.1175 |
| 10849 | CD3EAP | P44T-E | Human | Esophagus | ESCC | 1.66e-03 | -1.30e-01 | 0.1096 |
| 10849 | CD3EAP | P47T-E | Human | Esophagus | ESCC | 8.69e-06 | -6.68e-02 | 0.1067 |
| 10849 | CD3EAP | P52T-E | Human | Esophagus | ESCC | 1.24e-15 | 4.51e-01 | 0.1555 |
| 10849 | CD3EAP | P54T-E | Human | Esophagus | ESCC | 7.96e-12 | 1.78e-01 | 0.0975 |
| 10849 | CD3EAP | P57T-E | Human | Esophagus | ESCC | 1.45e-10 | -3.77e-02 | 0.0926 |
| 10849 | CD3EAP | P61T-E | Human | Esophagus | ESCC | 1.65e-19 | 5.71e-02 | 0.099 |
| 10849 | CD3EAP | P62T-E | Human | Esophagus | ESCC | 5.75e-11 | 2.44e-01 | 0.1302 |
| 10849 | CD3EAP | P65T-E | Human | Esophagus | ESCC | 1.11e-11 | 8.17e-02 | 0.0978 |
| 10849 | CD3EAP | P74T-E | Human | Esophagus | ESCC | 2.23e-12 | 2.97e-01 | 0.1479 |
| 10849 | CD3EAP | P75T-E | Human | Esophagus | ESCC | 9.11e-03 | 1.31e-01 | 0.1125 |
| Page: 1 2 3 4 |
| Tissue | Expression Dynamics | Abbreviation |
| Esophagus |  | ESCC: Esophageal squamous cell carcinoma |
| HGIN: High-grade intraepithelial neoplasias | ||
| LGIN: Low-grade intraepithelial neoplasias | ||
| Liver | 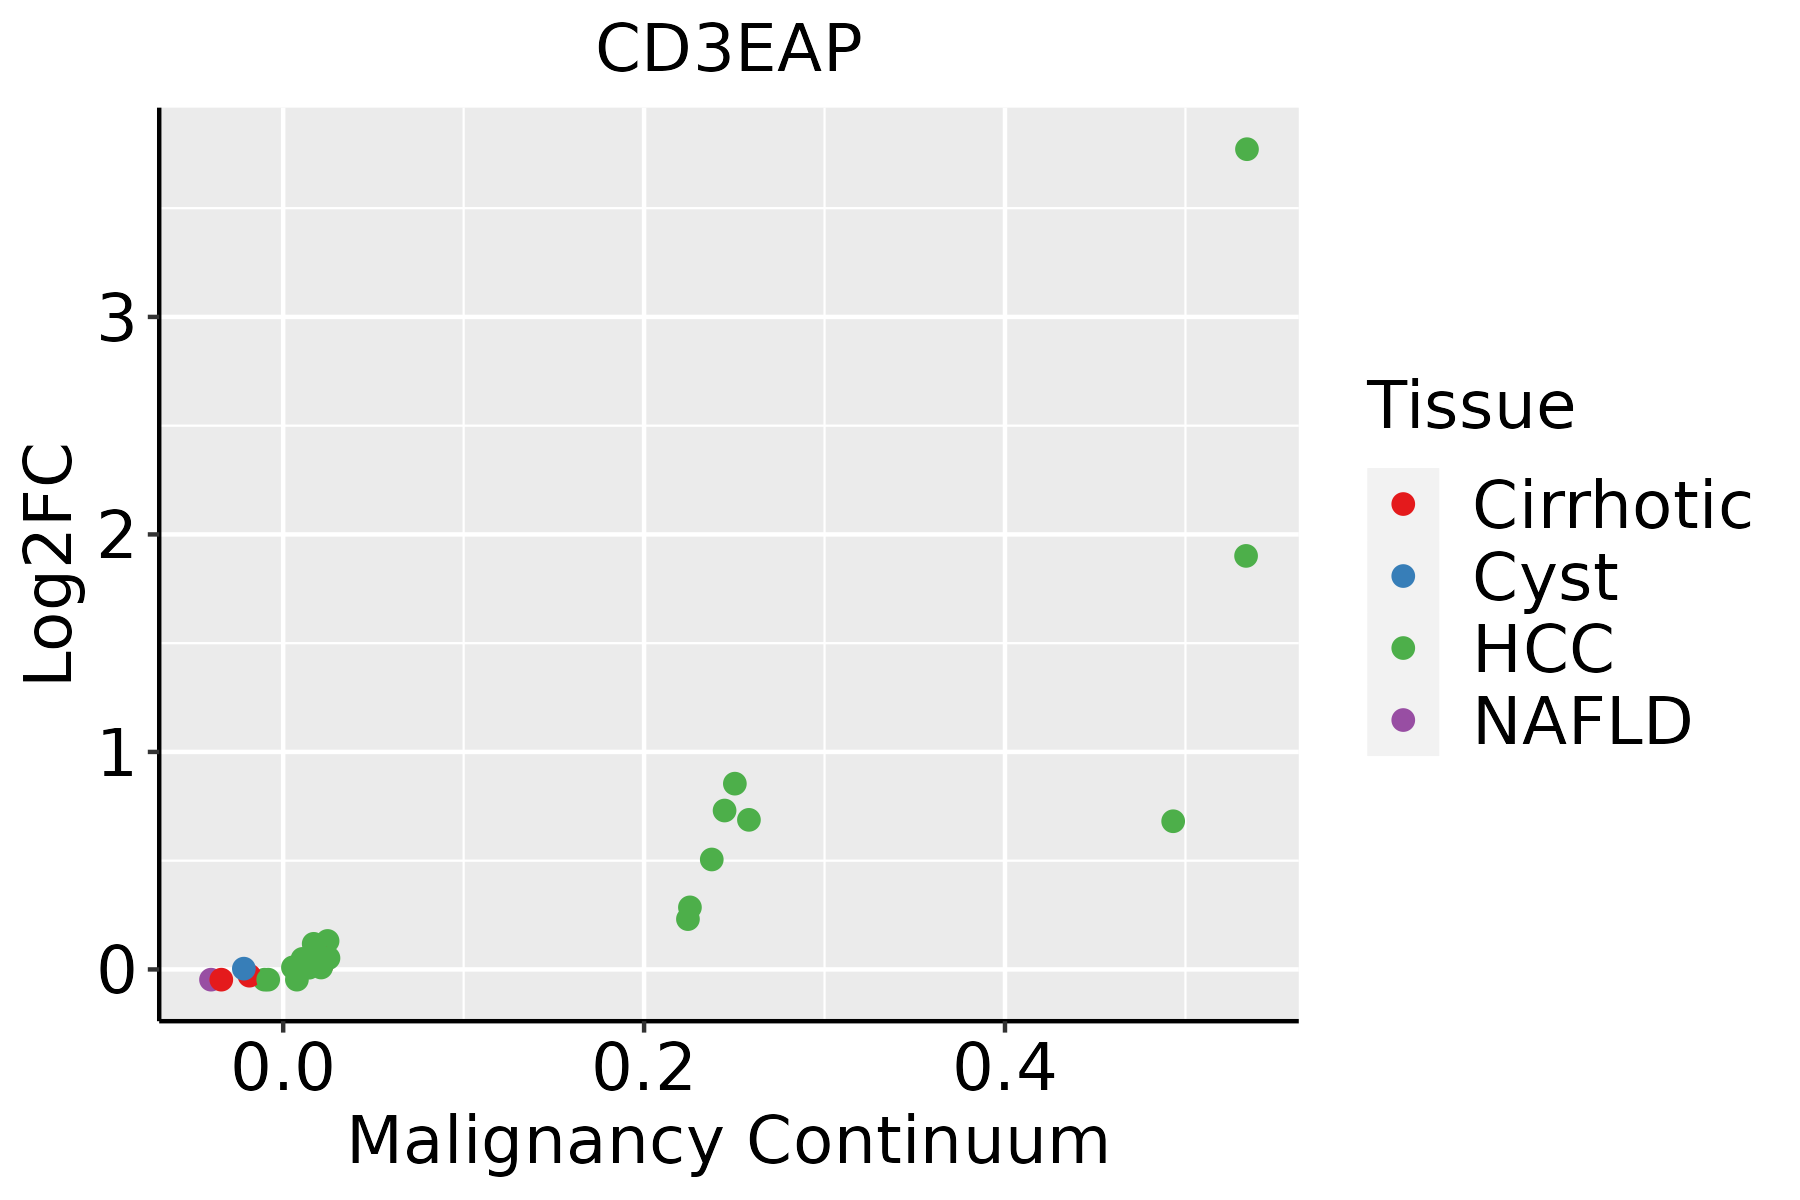 | HCC: Hepatocellular carcinoma |
| NAFLD: Non-alcoholic fatty liver disease | ||
| Oral Cavity | 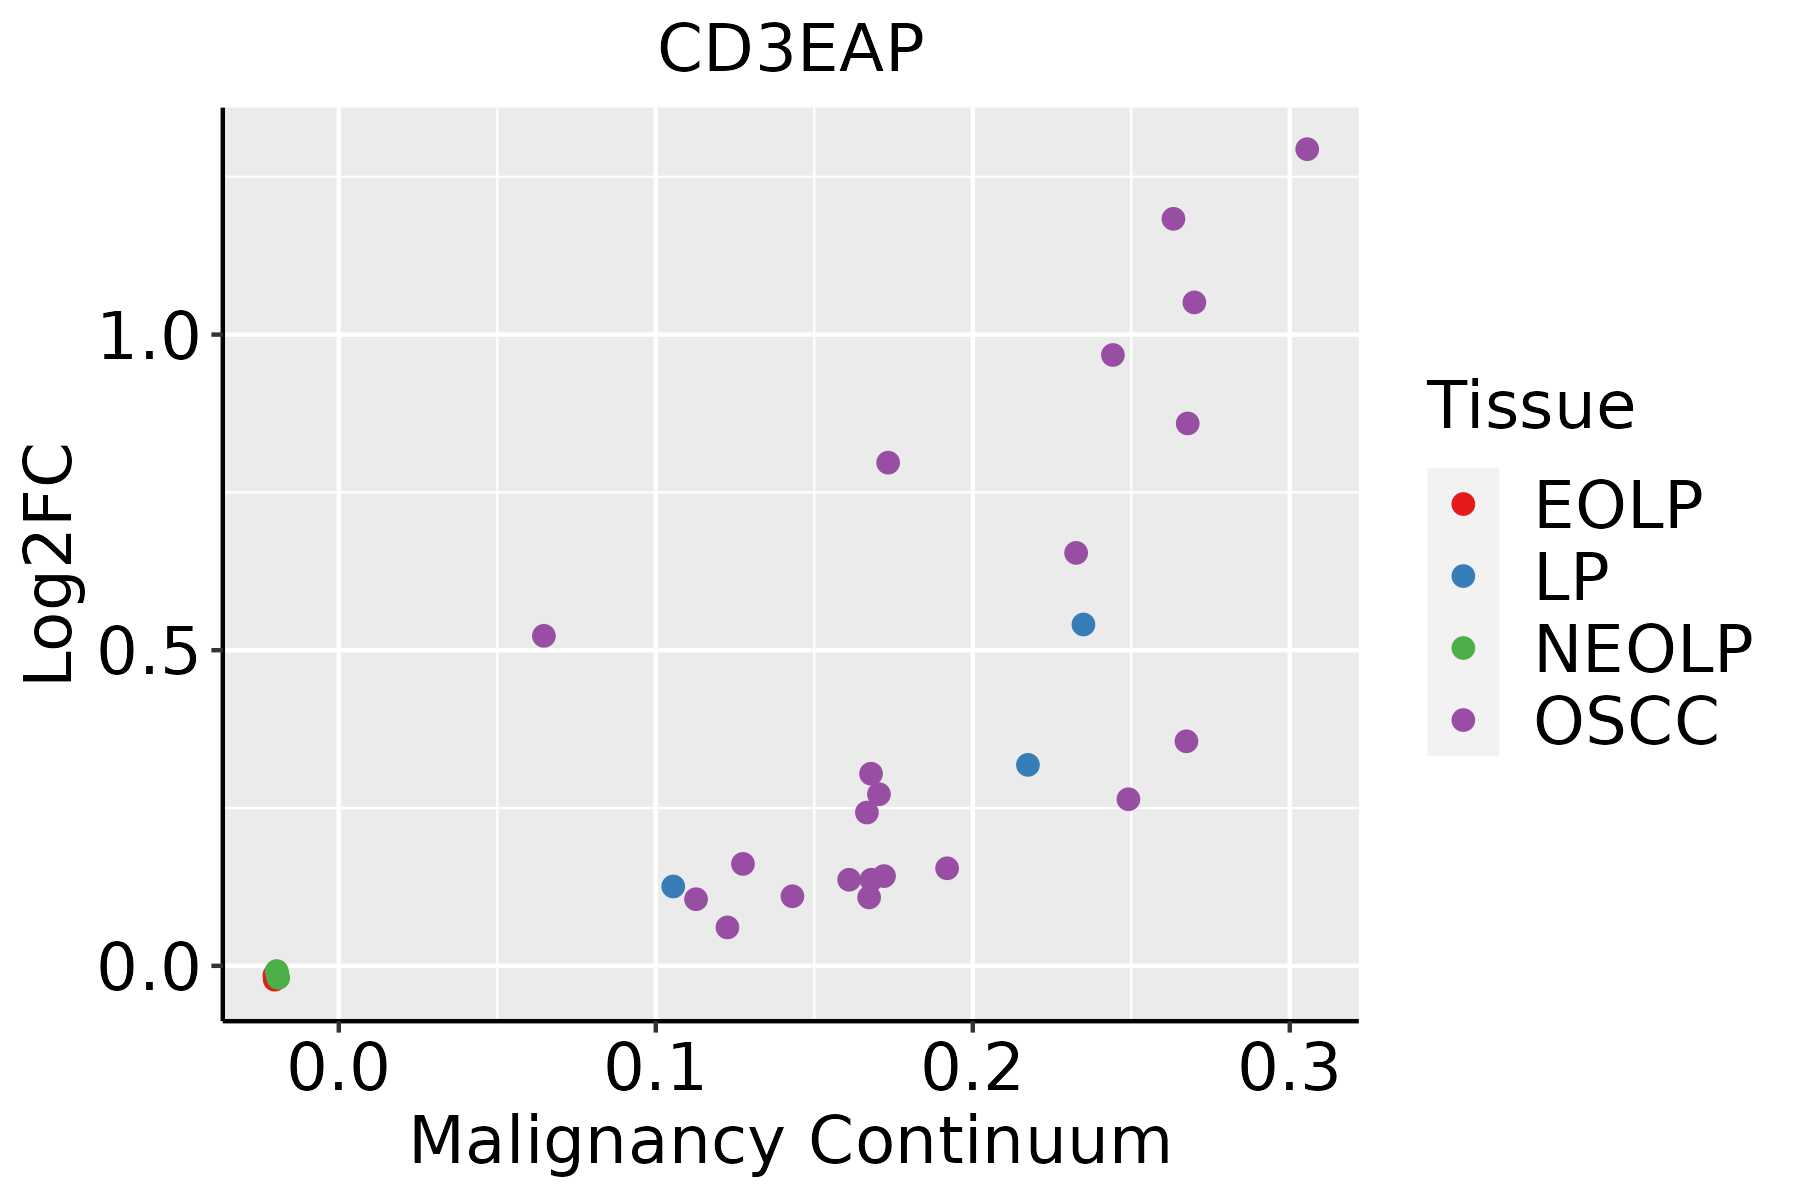 | EOLP: Erosive Oral lichen planus |
| LP: leukoplakia | ||
| NEOLP: Non-erosive oral lichen planus | ||
| OSCC: Oral squamous cell carcinoma | ||
| Skin | 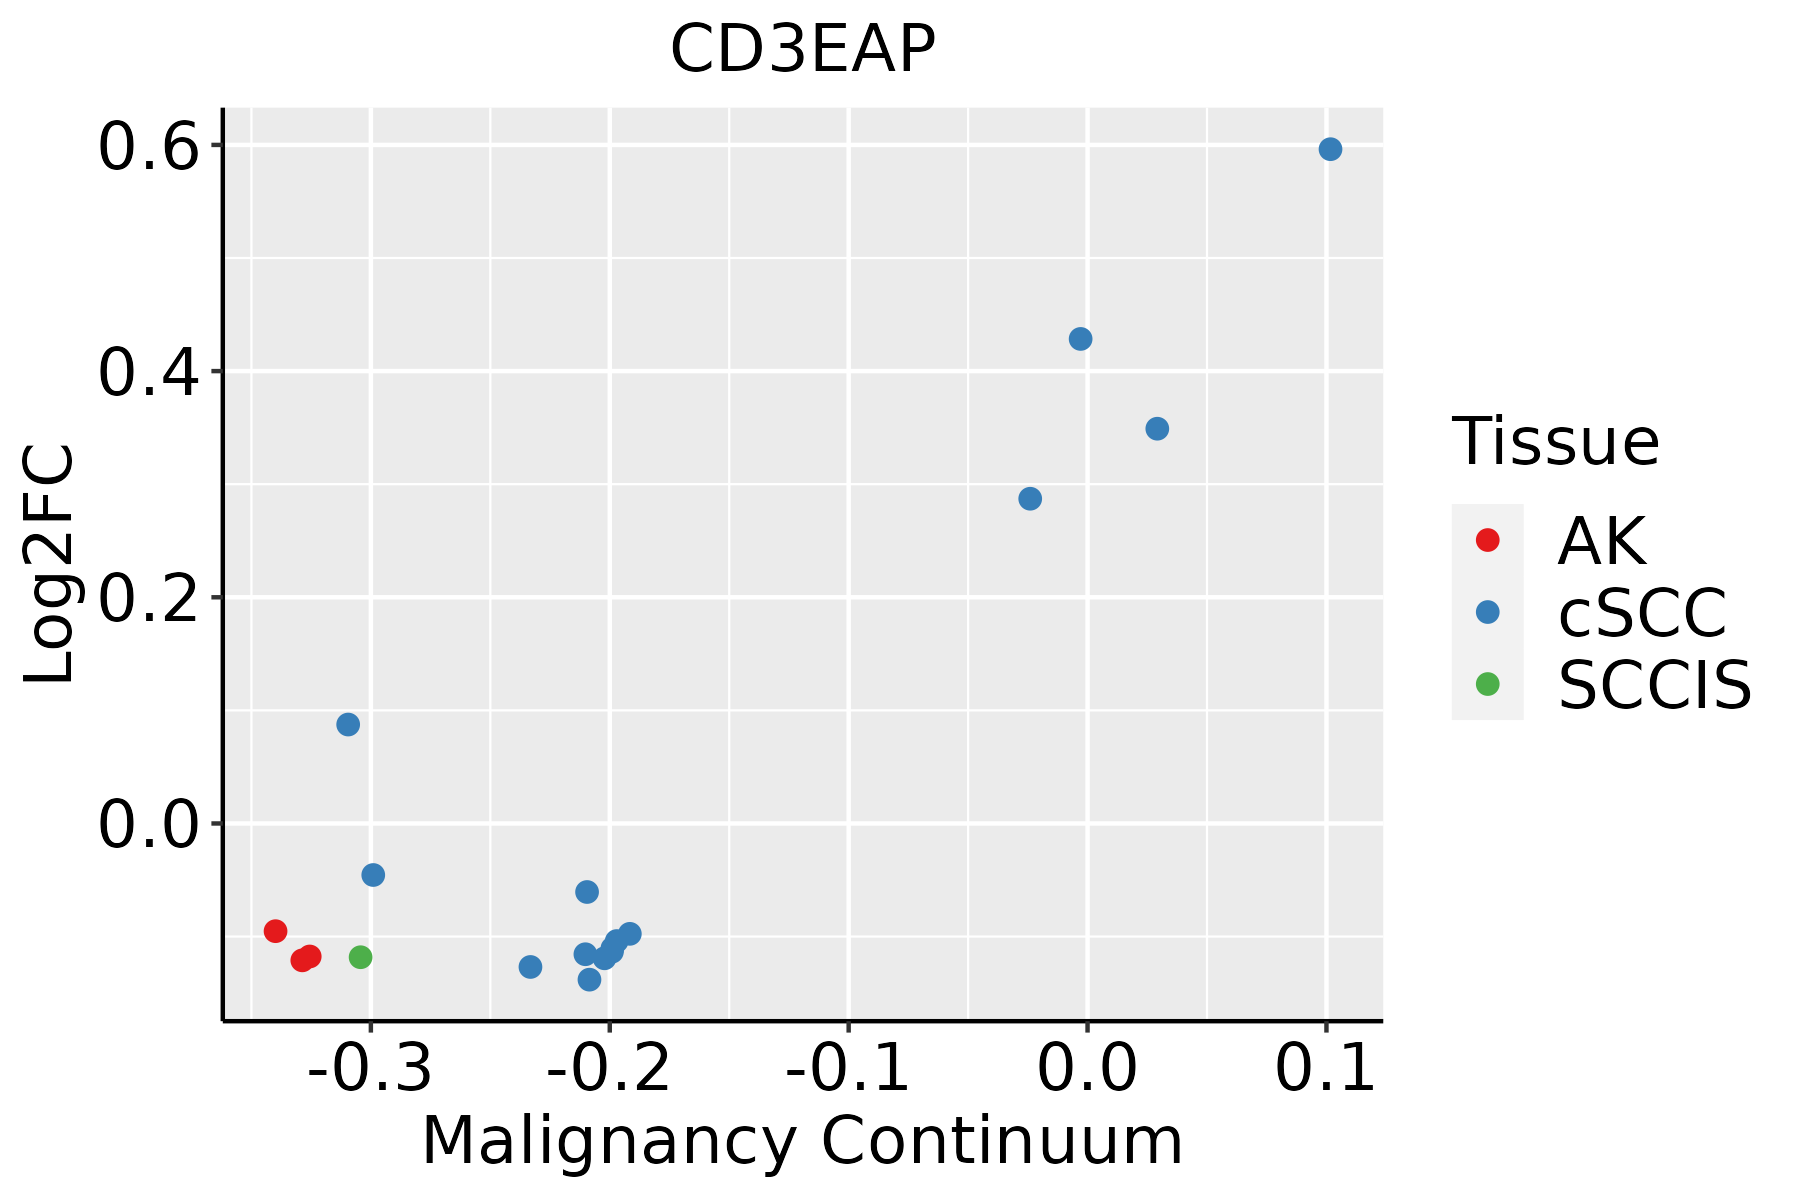 | AK: Actinic keratosis |
| cSCC: Cutaneous squamous cell carcinoma | ||
| SCCIS:squamous cell carcinoma in situ |
| ∗log2FC in expression of this searched gene in stem-like cells from each diseased tissue sample relative to stem-like cells in normal samples in each tissue plotted against the malignancy continuum. Samples are colored based on if they are from different disease stage. |
Top |
Malignant transformation related pathway analysis |
| Find out the enriched GO biological processes and KEGG pathways involved in transition from healthy to precancer to cancer |
| Tissue | Disease Stage | Enriched GO biological Processes |
| Colorectum | AD |  |
| Colorectum | SER |  |
| Colorectum | MSS |  |
| Colorectum | MSI-H |  |
| Colorectum | FAP |  |
| ∗Top 15 enriched GO BP terms are showed in the bar plot of each disease state in each tissue. Each row represents a significant GO biological process which is colored according to the -log10(p.adjust). |
| Page: 1 2 3 4 5 6 7 8 9 |
| GO ID | Tissue | Disease Stage | Description | Gene Ratio | Bg Ratio | pvalue | p.adjust | Count |
| Page: 1 |
| Pathway ID | Tissue | Disease Stage | Description | Gene Ratio | Bg Ratio | pvalue | p.adjust | qvalue | Count |
| Page: 1 |
Top |
Cell-cell communication analysis |
| Identification of potential cell-cell interactions between two cell types and their ligand-receptor pairs for different disease states |
| Ligand | Receptor | LRpair | Pathway | Tissue | Disease Stage |
| Page: 1 |
Top |
Single-cell gene regulatory network inference analysis |
| Find out the significant the regulons (TFs) and the target genes of each regulon across cell types for different disease states |
| TF | Cell Type | Tissue | Disease Stage | Target Gene | RSS | Regulon Activity |
| ∗The dot plots of a searched regulon are shown for all cell subpopulations in each disease state of each tissue based on the regulon specific score inferred using pySCENIC and by calculating the average expression. |
| Page: 1 |
Top |
Somatic mutation of malignant transformation related genes |
| Annotation of somatic variants for genes involved in malignant transformation |
| Hugo Symbol | Variant Class | Variant Classification | dbSNP RS | HGVSc | HGVSp | HGVSp Short | SWISSPROT | BIOTYPE | SIFT | PolyPhen | Tumor Sample Barcode | Tissue | Histology | Sex | Age | Stage | Therapy Types | Drugs | Outcome |
| CD3EAP | SNV | Missense_Mutation | c.1114N>A | p.Glu372Lys | p.E372K | O15446 | protein_coding | tolerated(0.59) | benign(0) | TCGA-A2-A0CX-01 | Breast | breast invasive carcinoma | Female | <65 | I/II | Chemotherapy | adriamycin | SD | |
| CD3EAP | SNV | Missense_Mutation | c.783A>T | p.Lys261Asn | p.K261N | O15446 | protein_coding | tolerated(0.19) | benign(0) | TCGA-A2-A25A-01 | Breast | breast invasive carcinoma | Female | <65 | I/II | Unspecific | Cytoxan | SD | |
| CD3EAP | SNV | Missense_Mutation | c.197N>T | p.Ser66Phe | p.S66F | O15446 | protein_coding | deleterious(0.04) | possibly_damaging(0.885) | TCGA-GM-A2DO-01 | Breast | breast invasive carcinoma | Female | <65 | I/II | Hormone Therapy | tamoxiphen | CR | |
| CD3EAP | insertion | Nonsense_Mutation | novel | c.991_992insTCCACGACCATTAATCCTGCAACCTAAGCTTGCTCATTTATGTT | p.Lys331IlefsTer5 | p.K331Ifs*5 | O15446 | protein_coding | TCGA-A8-A08S-01 | Breast | breast invasive carcinoma | Female | >=65 | I/II | Hormone Therapy | anastrozole | SD | ||
| CD3EAP | insertion | Frame_Shift_Ins | novel | c.576_577insCCAATGGACC | p.Val193ProfsTer88 | p.V193Pfs*88 | O15446 | protein_coding | TCGA-BH-A0E7-01 | Breast | breast invasive carcinoma | Female | >=65 | I/II | Hormone Therapy | arimidex | SD | ||
| CD3EAP | SNV | Missense_Mutation | rs372336084 | c.1483N>A | p.Glu495Lys | p.E495K | O15446 | protein_coding | tolerated(0.12) | benign(0.069) | TCGA-C5-A1ME-01 | Cervix | cervical & endocervical cancer | Female | <65 | I/II | Unknown | Unknown | SD |
| CD3EAP | SNV | Missense_Mutation | c.1050G>C | p.Glu350Asp | p.E350D | O15446 | protein_coding | deleterious_low_confidence(0) | benign(0.327) | TCGA-EK-A2H0-01 | Cervix | cervical & endocervical cancer | Female | <65 | I/II | Chemotherapy | cisplatin | CR | |
| CD3EAP | SNV | Missense_Mutation | rs752873305 | c.571N>A | p.Glu191Lys | p.E191K | O15446 | protein_coding | deleterious(0.01) | benign(0.381) | TCGA-HM-A4S6-01 | Cervix | cervical & endocervical cancer | Female | <65 | III/IV | Chemotherapy | cisplatin | CR |
| CD3EAP | SNV | Missense_Mutation | novel | c.833N>G | p.Thr278Ser | p.T278S | O15446 | protein_coding | tolerated(0.14) | benign(0.005) | TCGA-VS-A9UP-01 | Cervix | cervical & endocervical cancer | Female | <65 | I/II | Chemotherapy | cisplatin | PD |
| CD3EAP | SNV | Missense_Mutation | c.1050G>C | p.Glu350Asp | p.E350D | O15446 | protein_coding | deleterious_low_confidence(0) | benign(0.327) | TCGA-ZJ-A8QQ-01 | Cervix | cervical & endocervical cancer | Female | <65 | I/II | Chemotherapy | cisplatin | SD |
| Page: 1 2 3 4 5 |
Top |
Related drugs of malignant transformation related genes |
| Identification of chemicals and drugs interact with genes involved in malignant transfromation |
| (DGIdb 4.0) |
| Entrez ID | Symbol | Category | Interaction Types | Drug Claim Name | Drug Name | PMIDs |
| Page: 1 |

Copyright 2023-Present -The University of Texas Health Science Center at Houston |