
|
|||||
|
 | |
| |
| |
| |
| |
| |
|
Gene: CCL15 |
Gene summary for CCL15 |
| Gene information | Species | Human | Gene symbol | CCL15 | Gene ID | 6359 |
| Gene name | C-C motif chemokine ligand 15 | |
| Gene Alias | HCC-2 | |
| Cytomap | 17q12 | |
| Gene Type | protein-coding | GO ID | GO:0000165 | UniProtAcc | A0A0B4J2E2 |
Top |
Malignant transformation analysis |
| Identification of the aberrant gene expression in precancerous and cancerous lesions by comparing the gene expression of stem-like cells in diseased tissues with normal stem cells |
| Entrez ID | Symbol | Replicates | Species | Organ | Tissue | Adj P-value | Log2FC | Malignancy |
| 6359 | CCL15 | HTA11_10623_2000001011 | Human | Colorectum | AD | 9.21e-08 | 3.00e-01 | -0.0177 |
| 6359 | CCL15 | HTA11_6801_2000001011 | Human | Colorectum | SER | 1.19e-07 | 4.96e-01 | 0.0171 |
| 6359 | CCL15 | HTA11_7469_2000001011 | Human | Colorectum | AD | 3.81e-02 | 2.90e-01 | -0.0124 |
| 6359 | CCL15 | HTA11_99999970781_79442 | Human | Colorectum | MSS | 4.08e-11 | 2.25e-01 | 0.294 |
| 6359 | CCL15 | HTA11_99999965062_69753 | Human | Colorectum | MSI-H | 7.89e-03 | 3.79e-01 | 0.3487 |
| 6359 | CCL15 | HTA11_99999965104_69814 | Human | Colorectum | MSS | 6.03e-08 | 2.67e-01 | 0.281 |
| 6359 | CCL15 | HTA11_99999971662_82457 | Human | Colorectum | MSS | 2.83e-15 | 3.85e-01 | 0.3859 |
| 6359 | CCL15 | HTA11_99999973899_84307 | Human | Colorectum | MSS | 4.31e-06 | 2.95e-01 | 0.2585 |
| 6359 | CCL15 | HTA11_99999974143_84620 | Human | Colorectum | MSS | 3.84e-22 | 4.09e-01 | 0.3005 |
| 6359 | CCL15 | HCC1_Meng | Human | Liver | HCC | 1.45e-61 | 2.85e-01 | 0.0246 |
| 6359 | CCL15 | HCC2_Meng | Human | Liver | HCC | 9.14e-03 | 5.75e-02 | 0.0107 |
| 6359 | CCL15 | HCC1 | Human | Liver | HCC | 2.52e-02 | 1.06e+00 | 0.5336 |
| 6359 | CCL15 | HCC2 | Human | Liver | HCC | 1.20e-09 | 1.91e+00 | 0.5341 |
| 6359 | CCL15 | Pt14.d | Human | Liver | HCC | 4.33e-03 | 8.52e-02 | 0.0143 |
| 6359 | CCL15 | S014 | Human | Liver | HCC | 4.84e-05 | 2.27e-01 | 0.2254 |
| 6359 | CCL15 | S015 | Human | Liver | HCC | 2.23e-07 | 3.40e-01 | 0.2375 |
| 6359 | CCL15 | S016 | Human | Liver | HCC | 1.97e-02 | 1.69e-01 | 0.2243 |
| 6359 | CCL15 | S027 | Human | Liver | HCC | 5.20e-11 | 8.64e-01 | 0.2446 |
| 6359 | CCL15 | S028 | Human | Liver | HCC | 2.33e-27 | 7.27e-01 | 0.2503 |
| 6359 | CCL15 | S029 | Human | Liver | HCC | 8.19e-45 | 1.73e+00 | 0.2581 |
| Page: 1 2 3 |
| Tissue | Expression Dynamics | Abbreviation |
| Colorectum (GSE201348) |  | FAP: Familial adenomatous polyposis |
| CRC: Colorectal cancer | ||
| Colorectum (HTA11) |  | AD: Adenomas |
| SER: Sessile serrated lesions | ||
| MSI-H: Microsatellite-high colorectal cancer | ||
| MSS: Microsatellite stable colorectal cancer | ||
| GC |  | CAG: Chronic atrophic gastritis |
| CAG with IM: Chronic atrophic gastritis with intestinal metaplasia | ||
| CSG: Chronic superficial gastritis | ||
| GC: Gastric cancer | ||
| SIM: Severe intestinal metaplasia | ||
| WIM: Wild intestinal metaplasia | ||
| Liver | 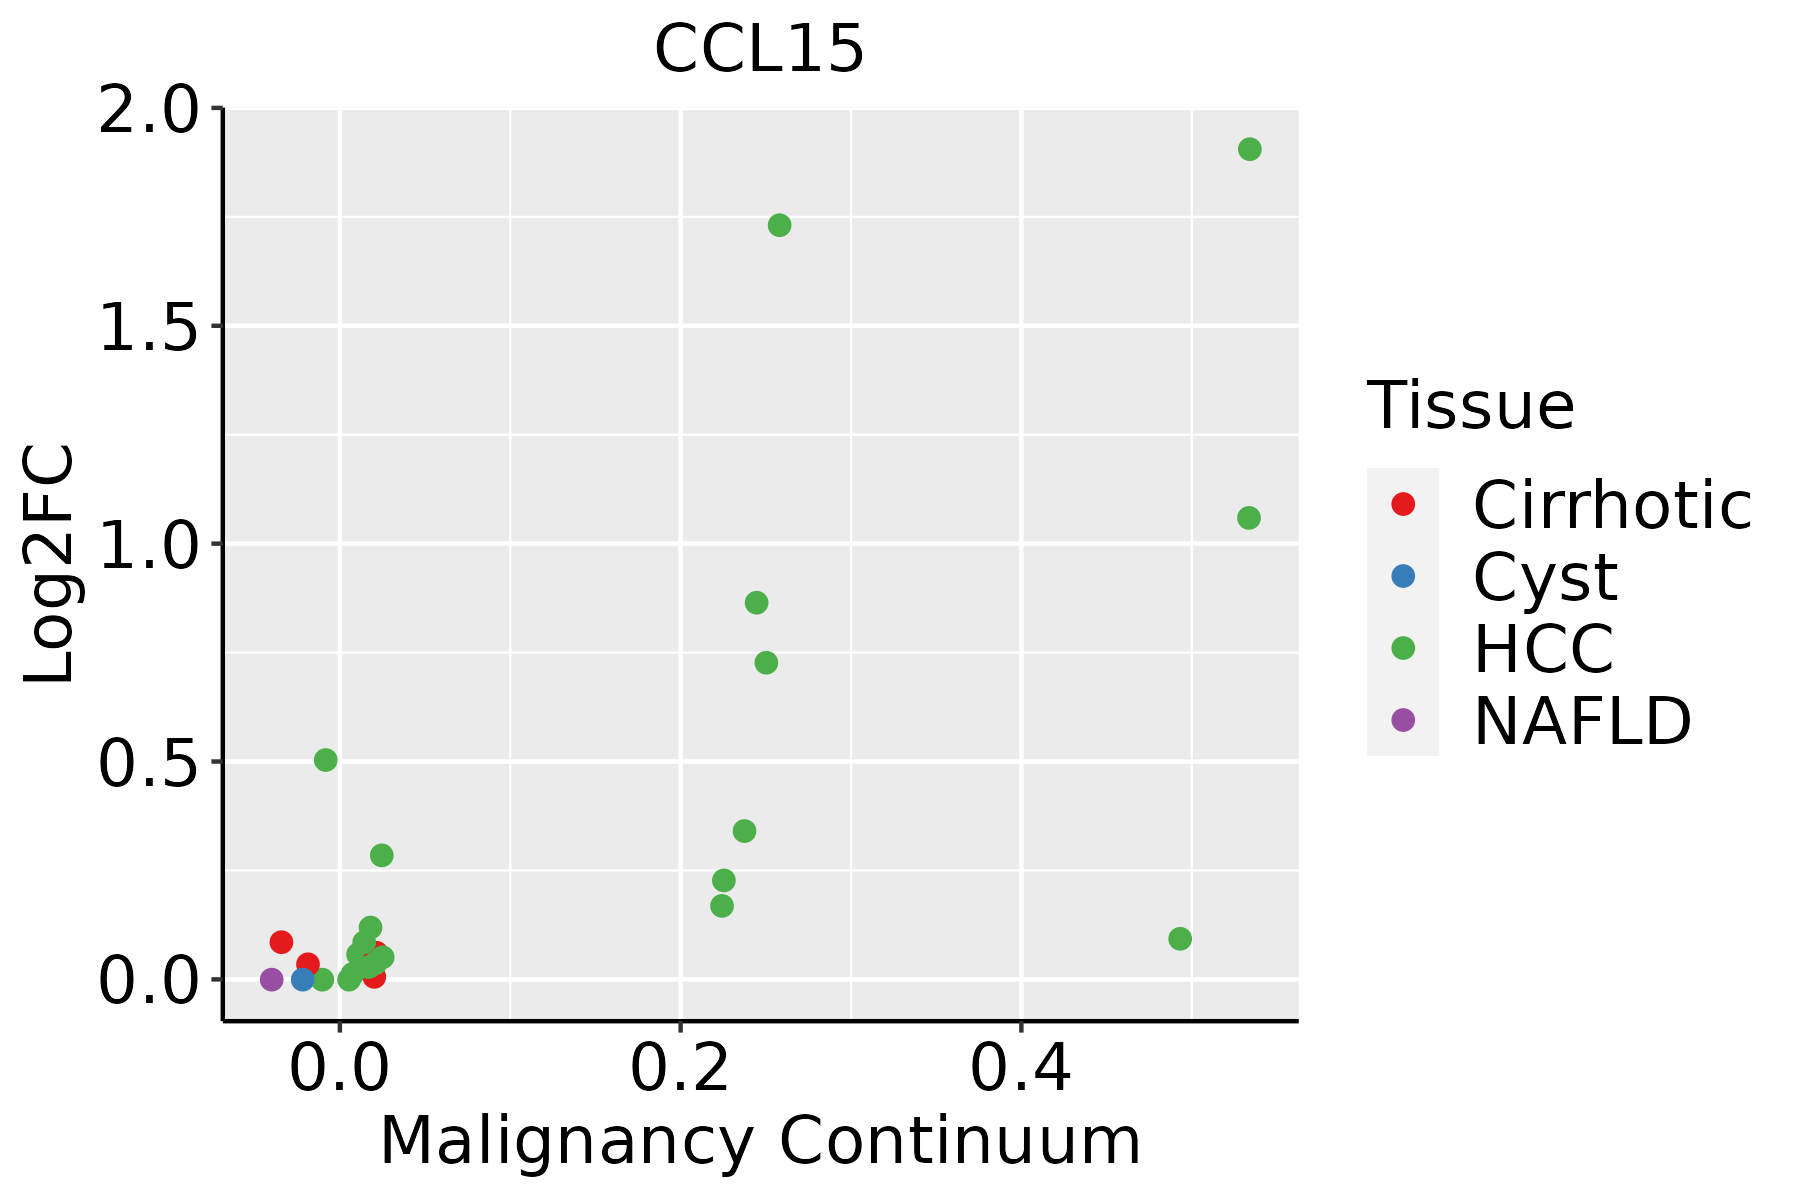 | HCC: Hepatocellular carcinoma |
| NAFLD: Non-alcoholic fatty liver disease |
| ∗log2FC in expression of this searched gene in stem-like cells from each diseased tissue sample relative to stem-like cells in normal samples in each tissue plotted against the malignancy continuum. Samples are colored based on if they are from different disease stage. |
Top |
Malignant transformation related pathway analysis |
| Find out the enriched GO biological processes and KEGG pathways involved in transition from healthy to precancer to cancer |
| Tissue | Disease Stage | Enriched GO biological Processes |
| Colorectum | AD |  |
| Colorectum | SER |  |
| Colorectum | MSS |  |
| Colorectum | MSI-H |  |
| Colorectum | FAP |  |
| ∗Top 15 enriched GO BP terms are showed in the bar plot of each disease state in each tissue. Each row represents a significant GO biological process which is colored according to the -log10(p.adjust). |
| Page: 1 2 3 4 5 6 7 8 9 |
| GO ID | Tissue | Disease Stage | Description | Gene Ratio | Bg Ratio | pvalue | p.adjust | Count |
| GO:0043087 | Colorectum | AD | regulation of GTPase activity | 110/3918 | 348/18723 | 1.64e-06 | 5.03e-05 | 110 |
| GO:0043547 | Colorectum | AD | positive regulation of GTPase activity | 75/3918 | 255/18723 | 7.95e-04 | 7.91e-03 | 75 |
| GO:00430871 | Colorectum | SER | regulation of GTPase activity | 77/2897 | 348/18723 | 5.90e-04 | 8.07e-03 | 77 |
| GO:00430872 | Colorectum | MSS | regulation of GTPase activity | 101/3467 | 348/18723 | 1.00e-06 | 3.46e-05 | 101 |
| GO:00435471 | Colorectum | MSS | positive regulation of GTPase activity | 68/3467 | 255/18723 | 7.97e-04 | 8.38e-03 | 68 |
| GO:0034341 | Colorectum | MSI-H | response to interferon-gamma | 21/1319 | 141/18723 | 8.78e-04 | 1.57e-02 | 21 |
| GO:00343411 | Liver | HCC | response to interferon-gamma | 82/7958 | 141/18723 | 1.25e-04 | 1.03e-03 | 82 |
| GO:00713461 | Liver | HCC | cellular response to interferon-gamma | 70/7958 | 118/18723 | 1.66e-04 | 1.32e-03 | 70 |
| GO:00705551 | Liver | HCC | response to interleukin-1 | 80/7958 | 143/18723 | 7.95e-04 | 4.77e-03 | 80 |
| GO:003461211 | Liver | HCC | response to tumor necrosis factor | 132/7958 | 253/18723 | 1.14e-03 | 6.48e-03 | 132 |
| GO:00713471 | Liver | HCC | cellular response to interleukin-1 | 61/7958 | 113/18723 | 8.98e-03 | 3.46e-02 | 61 |
| GO:007135611 | Liver | HCC | cellular response to tumor necrosis factor | 115/7958 | 229/18723 | 1.08e-02 | 3.99e-02 | 115 |
| GO:0071356 | Stomach | GC | cellular response to tumor necrosis factor | 34/1159 | 229/18723 | 1.85e-06 | 8.24e-05 | 34 |
| GO:0034612 | Stomach | GC | response to tumor necrosis factor | 35/1159 | 253/18723 | 6.68e-06 | 2.54e-04 | 35 |
| GO:0071621 | Stomach | GC | granulocyte chemotaxis | 22/1159 | 125/18723 | 7.88e-06 | 2.80e-04 | 22 |
| GO:0030595 | Stomach | GC | leukocyte chemotaxis | 32/1159 | 230/18723 | 1.45e-05 | 4.68e-04 | 32 |
| GO:0050900 | Stomach | GC | leukocyte migration | 44/1159 | 369/18723 | 2.30e-05 | 6.81e-04 | 44 |
| GO:0097530 | Stomach | GC | granulocyte migration | 23/1159 | 148/18723 | 3.99e-05 | 1.00e-03 | 23 |
| GO:0030593 | Stomach | GC | neutrophil chemotaxis | 18/1159 | 103/18723 | 5.67e-05 | 1.31e-03 | 18 |
| GO:0097529 | Stomach | GC | myeloid leukocyte migration | 29/1159 | 220/18723 | 9.69e-05 | 1.97e-03 | 29 |
| Page: 1 2 3 |
| Pathway ID | Tissue | Disease Stage | Description | Gene Ratio | Bg Ratio | pvalue | p.adjust | qvalue | Count |
| Page: 1 |
Top |
Cell-cell communication analysis |
| Identification of potential cell-cell interactions between two cell types and their ligand-receptor pairs for different disease states |
| Ligand | Receptor | LRpair | Pathway | Tissue | Disease Stage |
| CCL15 | CCR1 | CCL15_CCR1 | CCL | CRC | AD |
| CCL15 | CCR1 | CCL15_CCR1 | CCL | Lung | AAH |
| CCL15 | CCR1 | CCL15_CCR1 | CCL | Lung | Precancer |
| Page: 1 |
Top |
Single-cell gene regulatory network inference analysis |
| Find out the significant the regulons (TFs) and the target genes of each regulon across cell types for different disease states |
| TF | Cell Type | Tissue | Disease Stage | Target Gene | RSS | Regulon Activity |
| ∗The dot plots of a searched regulon are shown for all cell subpopulations in each disease state of each tissue based on the regulon specific score inferred using pySCENIC and by calculating the average expression. |
| Page: 1 |
Top |
Somatic mutation of malignant transformation related genes |
| Annotation of somatic variants for genes involved in malignant transformation |
| Hugo Symbol | Variant Class | Variant Classification | dbSNP RS | HGVSc | HGVSp | HGVSp Short | SWISSPROT | BIOTYPE | SIFT | PolyPhen | Tumor Sample Barcode | Tissue | Histology | Sex | Age | Stage | Therapy Types | Drugs | Outcome |
| CCL15 | SNV | Missense_Mutation | rs551984257 | c.315N>A | p.Met105Ile | p.M105I | Q16663 | protein_coding | tolerated(0.47) | benign(0.101) | TCGA-BH-A0B6-01 | Breast | breast invasive carcinoma | Female | <65 | I/II | Unknown | Unknown | SD |
| CCL15 | SNV | Missense_Mutation | novel | c.176N>T | p.Ser59Leu | p.S59L | Q16663 | protein_coding | deleterious(0.03) | benign(0.131) | TCGA-Q1-A73O-01 | Cervix | cervical & endocervical cancer | Female | <65 | I/II | Chemotherapy | cisplatin | CR |
| CCL15 | SNV | Missense_Mutation | novel | c.66G>C | p.Gln22His | p.Q22H | Q16663 | protein_coding | tolerated(0.37) | benign(0.323) | TCGA-AG-3726-01 | Colorectum | rectum adenocarcinoma | Female | <65 | I/II | Unknown | Unknown | SD |
| CCL15 | SNV | Missense_Mutation | novel | c.37N>A | p.Leu13Ile | p.L13I | Q16663 | protein_coding | deleterious(0.05) | benign(0.359) | TCGA-AX-A2HD-01 | Endometrium | uterine corpus endometrioid carcinoma | Female | >=65 | III/IV | Unknown | Unknown | SD |
| CCL15 | SNV | Missense_Mutation | novel | c.332N>G | p.Tyr111Cys | p.Y111C | Q16663 | protein_coding | tolerated_low_confidence(0.15) | benign(0.033) | TCGA-AX-A3FT-01 | Endometrium | uterine corpus endometrioid carcinoma | Female | <65 | I/II | Unknown | Unknown | SD |
| CCL15 | SNV | Missense_Mutation | novel | c.56C>A | p.Ser19Tyr | p.S19Y | Q16663 | protein_coding | deleterious(0.01) | probably_damaging(0.98) | TCGA-B5-A0JY-01 | Endometrium | uterine corpus endometrioid carcinoma | Female | <65 | III/IV | Chemotherapy | doxorubicin | SD |
| CCL15 | SNV | Missense_Mutation | rs551984257 | c.315N>A | p.Met105Ile | p.M105I | Q16663 | protein_coding | tolerated(0.47) | benign(0.101) | TCGA-4R-AA8I-01 | Liver | liver hepatocellular carcinoma | Male | >=65 | I/II | Unknown | Unknown | PD |
| CCL15 | SNV | Missense_Mutation | novel | c.201G>A | p.Met67Ile | p.M67I | Q16663 | protein_coding | tolerated(0.08) | benign(0.225) | TCGA-05-4410-01 | Lung | lung adenocarcinoma | Male | <65 | I/II | Unknown | Unknown | SD |
| CCL15 | SNV | Missense_Mutation | novel | c.154G>A | p.Asp52Asn | p.D52N | Q16663 | protein_coding | deleterious(0) | probably_damaging(0.974) | TCGA-44-5644-01 | Lung | lung adenocarcinoma | Female | <65 | I/II | Unknown | Unknown | SD |
| CCL15 | SNV | Missense_Mutation | novel | c.175N>C | p.Ser59Pro | p.S59P | Q16663 | protein_coding | tolerated(0.97) | benign(0.001) | TCGA-44-6146-01 | Lung | lung adenocarcinoma | Male | <65 | I/II | Chemotherapy | alimta | PD |
| Page: 1 2 |
Top |
Related drugs of malignant transformation related genes |
| Identification of chemicals and drugs interact with genes involved in malignant transfromation |
| (DGIdb 4.0) |
| Entrez ID | Symbol | Category | Interaction Types | Drug Claim Name | Drug Name | PMIDs |
| Page: 1 |

Copyright 2023-Present -The University of Texas Health Science Center at Houston |