
|
|||||
|
 | |
| |
| |
| |
| |
| |
|
Gene: CCDC112 |
Gene summary for CCDC112 |
| Gene information | Species | Human | Gene symbol | CCDC112 | Gene ID | 153733 |
| Gene name | coiled-coil domain containing 112 | |
| Gene Alias | MBC1 | |
| Cytomap | 5q22.3 | |
| Gene Type | protein-coding | GO ID | GO:0003674 | UniProtAcc | Q8NEF3 |
Top |
Malignant transformation analysis |
| Identification of the aberrant gene expression in precancerous and cancerous lesions by comparing the gene expression of stem-like cells in diseased tissues with normal stem cells |
| Entrez ID | Symbol | Replicates | Species | Organ | Tissue | Adj P-value | Log2FC | Malignancy |
| 153733 | CCDC112 | P4T-E | Human | Esophagus | ESCC | 1.69e-07 | 2.21e-01 | 0.1323 |
| 153733 | CCDC112 | P5T-E | Human | Esophagus | ESCC | 8.79e-08 | 2.00e-01 | 0.1327 |
| 153733 | CCDC112 | P9T-E | Human | Esophagus | ESCC | 2.18e-07 | 1.89e-01 | 0.1131 |
| 153733 | CCDC112 | P10T-E | Human | Esophagus | ESCC | 8.69e-05 | 1.04e-01 | 0.116 |
| 153733 | CCDC112 | P11T-E | Human | Esophagus | ESCC | 1.09e-02 | 1.71e-01 | 0.1426 |
| 153733 | CCDC112 | P12T-E | Human | Esophagus | ESCC | 1.32e-15 | 3.72e-01 | 0.1122 |
| 153733 | CCDC112 | P15T-E | Human | Esophagus | ESCC | 1.17e-07 | 2.17e-01 | 0.1149 |
| 153733 | CCDC112 | P17T-E | Human | Esophagus | ESCC | 1.19e-03 | 3.63e-01 | 0.1278 |
| 153733 | CCDC112 | P20T-E | Human | Esophagus | ESCC | 2.44e-10 | 2.27e-01 | 0.1124 |
| 153733 | CCDC112 | P21T-E | Human | Esophagus | ESCC | 1.89e-04 | 1.12e-01 | 0.1617 |
| 153733 | CCDC112 | P22T-E | Human | Esophagus | ESCC | 1.69e-09 | 1.70e-01 | 0.1236 |
| 153733 | CCDC112 | P23T-E | Human | Esophagus | ESCC | 8.98e-06 | 2.65e-01 | 0.108 |
| 153733 | CCDC112 | P24T-E | Human | Esophagus | ESCC | 1.16e-06 | 1.78e-01 | 0.1287 |
| 153733 | CCDC112 | P26T-E | Human | Esophagus | ESCC | 1.10e-04 | 8.66e-02 | 0.1276 |
| 153733 | CCDC112 | P27T-E | Human | Esophagus | ESCC | 8.67e-04 | 1.53e-01 | 0.1055 |
| 153733 | CCDC112 | P28T-E | Human | Esophagus | ESCC | 3.48e-07 | 2.58e-01 | 0.1149 |
| 153733 | CCDC112 | P30T-E | Human | Esophagus | ESCC | 1.20e-04 | 1.90e-01 | 0.137 |
| 153733 | CCDC112 | P32T-E | Human | Esophagus | ESCC | 3.16e-10 | 2.66e-01 | 0.1666 |
| 153733 | CCDC112 | P36T-E | Human | Esophagus | ESCC | 4.38e-07 | 1.85e-01 | 0.1187 |
| 153733 | CCDC112 | P37T-E | Human | Esophagus | ESCC | 7.46e-07 | 1.90e-01 | 0.1371 |
| Page: 1 2 3 4 |
| Tissue | Expression Dynamics | Abbreviation |
| Colorectum (GSE201348) |  | FAP: Familial adenomatous polyposis |
| CRC: Colorectal cancer | ||
| Colorectum (HTA11) |  | AD: Adenomas |
| SER: Sessile serrated lesions | ||
| MSI-H: Microsatellite-high colorectal cancer | ||
| MSS: Microsatellite stable colorectal cancer | ||
| Esophagus | 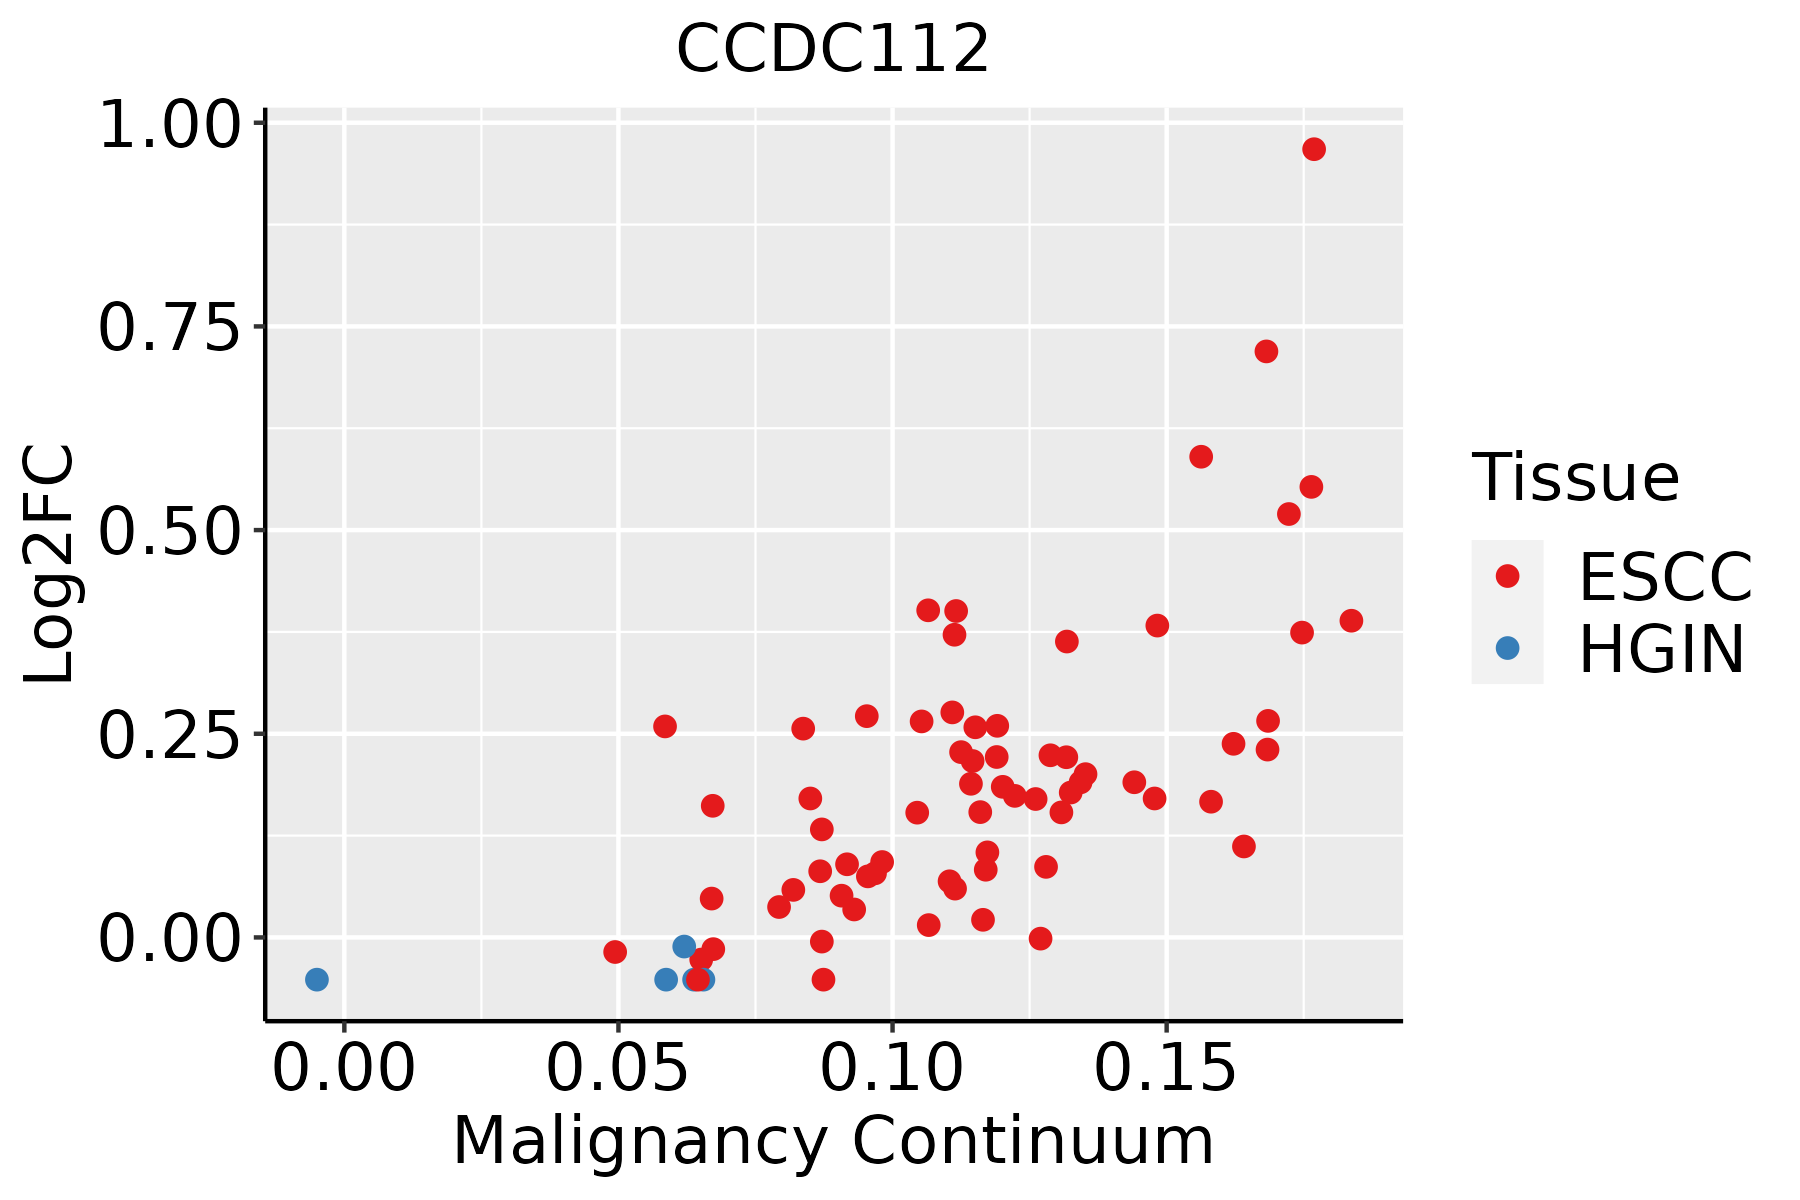 | ESCC: Esophageal squamous cell carcinoma |
| HGIN: High-grade intraepithelial neoplasias | ||
| LGIN: Low-grade intraepithelial neoplasias | ||
| Thyroid | 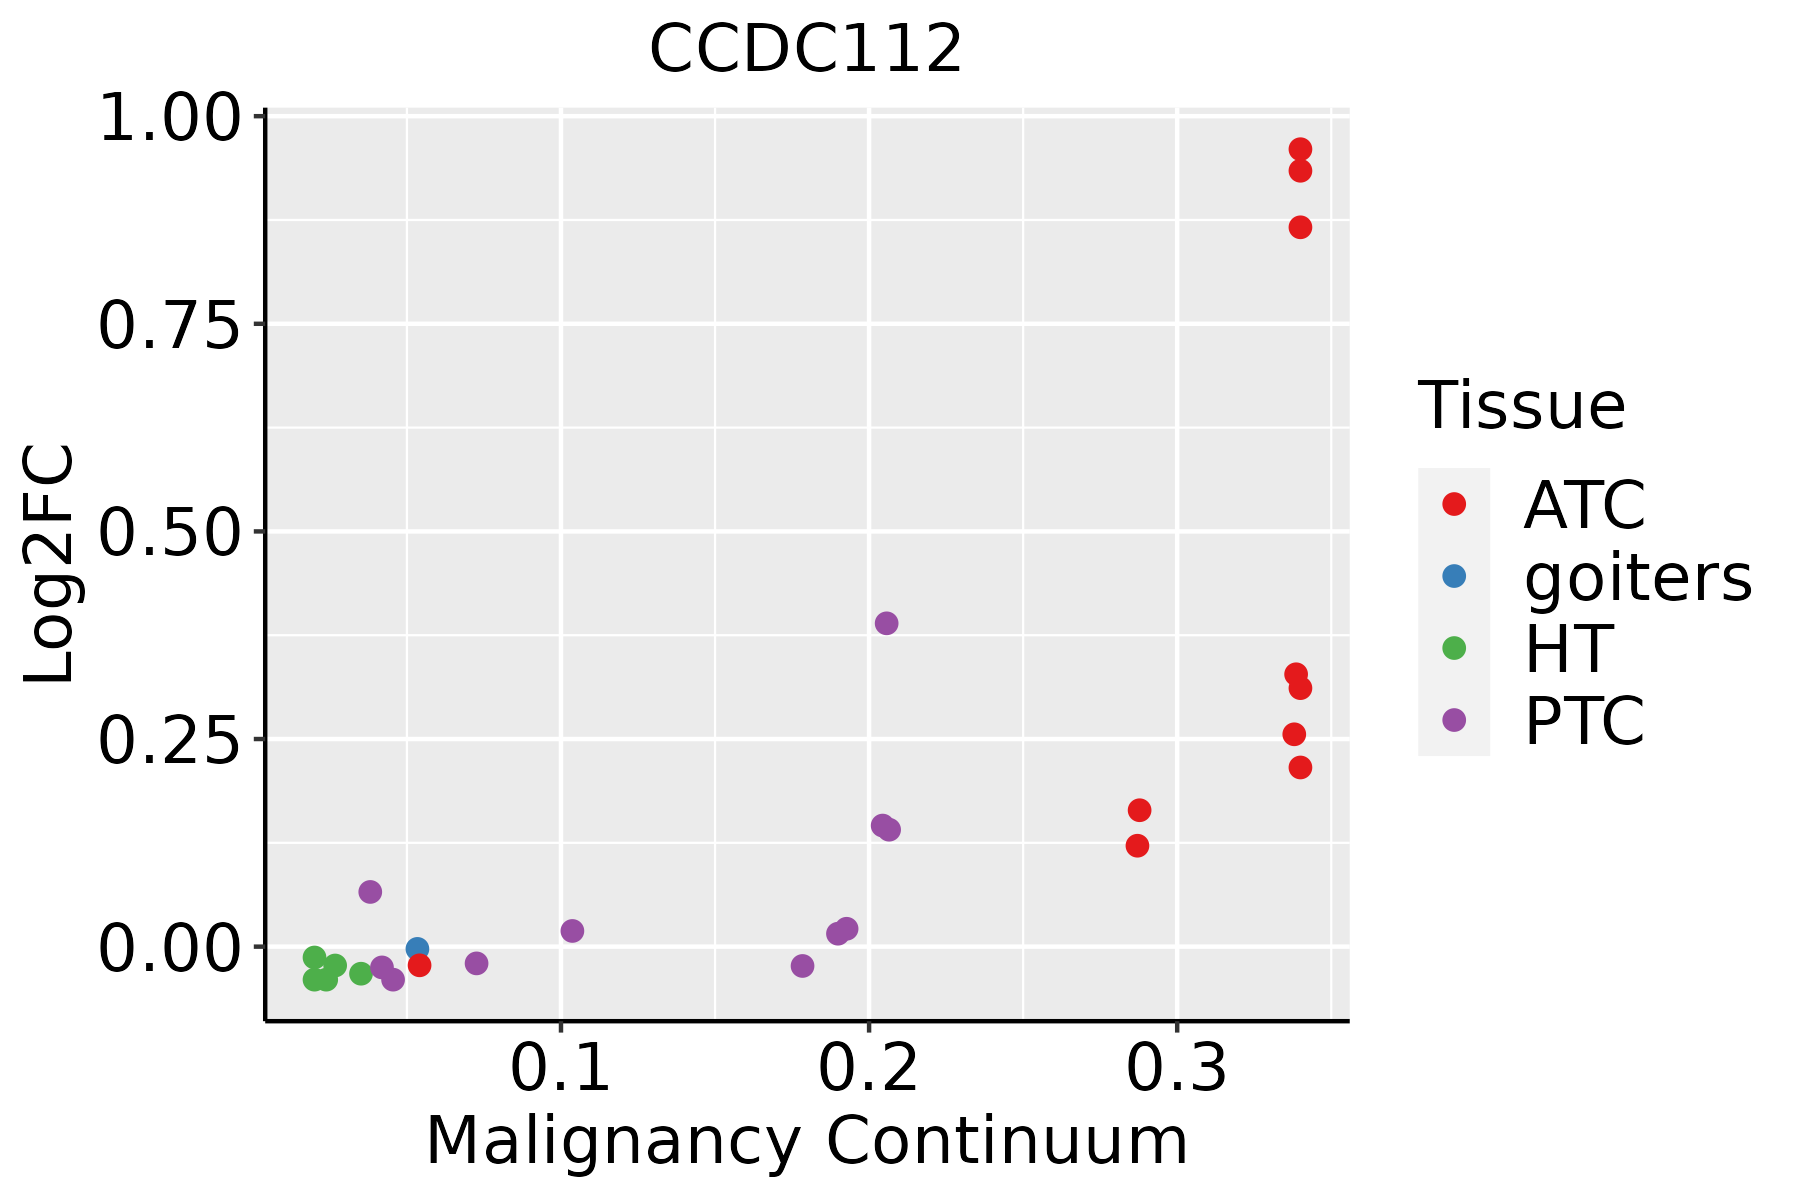 | ATC: Anaplastic thyroid cancer |
| HT: Hashimoto's thyroiditis | ||
| PTC: Papillary thyroid cancer |
| ∗log2FC in expression of this searched gene in stem-like cells from each diseased tissue sample relative to stem-like cells in normal samples in each tissue plotted against the malignancy continuum. Samples are colored based on if they are from different disease stage. |
Top |
Malignant transformation related pathway analysis |
| Find out the enriched GO biological processes and KEGG pathways involved in transition from healthy to precancer to cancer |
| Tissue | Disease Stage | Enriched GO biological Processes |
| Colorectum | AD |  |
| Colorectum | SER |  |
| Colorectum | MSS |  |
| Colorectum | MSI-H |  |
| Colorectum | FAP |  |
| ∗Top 15 enriched GO BP terms are showed in the bar plot of each disease state in each tissue. Each row represents a significant GO biological process which is colored according to the -log10(p.adjust). |
| Page: 1 2 3 4 5 6 7 8 9 |
| GO ID | Tissue | Disease Stage | Description | Gene Ratio | Bg Ratio | pvalue | p.adjust | Count |
| Page: 1 |
| Pathway ID | Tissue | Disease Stage | Description | Gene Ratio | Bg Ratio | pvalue | p.adjust | qvalue | Count |
| Page: 1 |
Top |
Cell-cell communication analysis |
| Identification of potential cell-cell interactions between two cell types and their ligand-receptor pairs for different disease states |
| Ligand | Receptor | LRpair | Pathway | Tissue | Disease Stage |
| Page: 1 |
Top |
Single-cell gene regulatory network inference analysis |
| Find out the significant the regulons (TFs) and the target genes of each regulon across cell types for different disease states |
| TF | Cell Type | Tissue | Disease Stage | Target Gene | RSS | Regulon Activity |
| ∗The dot plots of a searched regulon are shown for all cell subpopulations in each disease state of each tissue based on the regulon specific score inferred using pySCENIC and by calculating the average expression. |
| Page: 1 |
Top |
Somatic mutation of malignant transformation related genes |
| Annotation of somatic variants for genes involved in malignant transformation |
| Hugo Symbol | Variant Class | Variant Classification | dbSNP RS | HGVSc | HGVSp | HGVSp Short | SWISSPROT | BIOTYPE | SIFT | PolyPhen | Tumor Sample Barcode | Tissue | Histology | Sex | Age | Stage | Therapy Types | Drugs | Outcome |
| CCDC112 | SNV | Missense_Mutation | novel | c.1580N>T | p.Arg527Ile | p.R527I | Q8NEF3 | protein_coding | deleterious_low_confidence(0.02) | benign(0.022) | TCGA-AN-A046-01 | Breast | breast invasive carcinoma | Female | >=65 | I/II | Unknown | Unknown | SD |
| CCDC112 | SNV | Missense_Mutation | c.1563G>C | p.Trp521Cys | p.W521C | Q8NEF3 | protein_coding | deleterious(0) | probably_damaging(0.999) | TCGA-AN-A0XU-01 | Breast | breast invasive carcinoma | Female | <65 | I/II | Unknown | Unknown | SD | |
| CCDC112 | SNV | Missense_Mutation | c.659C>A | p.Pro220His | p.P220H | Q8NEF3 | protein_coding | deleterious(0.01) | possibly_damaging(0.891) | TCGA-D8-A1XK-01 | Breast | breast invasive carcinoma | Female | <65 | I/II | Chemotherapy | doxorubicine+cyclophosphamide | SD | |
| CCDC112 | SNV | Missense_Mutation | rs187304678 | c.214N>T | p.Arg72Cys | p.R72C | Q8NEF3 | protein_coding | deleterious(0.01) | probably_damaging(0.963) | TCGA-E2-A153-01 | Breast | breast invasive carcinoma | Female | <65 | I/II | Chemotherapy | doxorubicin | SD |
| CCDC112 | insertion | Frame_Shift_Ins | novel | c.1351_1352insATGTAAATAAGTA | p.Leu451HisfsTer10 | p.L451Hfs*10 | Q8NEF3 | protein_coding | TCGA-AC-A3QQ-01 | Breast | breast invasive carcinoma | Female | <65 | I/II | Unknown | Unknown | SD | ||
| CCDC112 | insertion | Frame_Shift_Ins | novel | c.250_251insAATCCTCTCTTTCTTGTTATAT | p.Met84LysfsTer12 | p.M84Kfs*12 | Q8NEF3 | protein_coding | TCGA-AR-A0U0-01 | Breast | breast invasive carcinoma | Female | >=65 | I/II | Unknown | Unknown | SD | ||
| CCDC112 | deletion | Frame_Shift_Del | novel | c.1398delN | p.Lys466AsnfsTer8 | p.K466Nfs*8 | Q8NEF3 | protein_coding | TCGA-D8-A27V-01 | Breast | breast invasive carcinoma | Female | <65 | I/II | Hormone Therapy | tamoxiphen | SD | ||
| CCDC112 | SNV | Missense_Mutation | novel | c.71N>A | p.Gly24Asp | p.G24D | Q8NEF3 | protein_coding | tolerated_low_confidence(0.39) | benign(0.039) | TCGA-DS-A1OA-01 | Cervix | cervical & endocervical cancer | Female | >=65 | I/II | Chemotherapy | carboplatin | PD |
| CCDC112 | SNV | Missense_Mutation | rs185790295 | c.1178G>A | p.Arg393His | p.R393H | Q8NEF3 | protein_coding | tolerated(0.08) | benign(0.033) | TCGA-EA-A410-01 | Cervix | cervical & endocervical cancer | Female | <65 | I/II | Unknown | Unknown | SD |
| CCDC112 | SNV | Missense_Mutation | c.519N>C | p.Gln173His | p.Q173H | Q8NEF3 | protein_coding | deleterious(0.02) | probably_damaging(0.939) | TCGA-IR-A3LK-01 | Cervix | cervical & endocervical cancer | Female | >=65 | I/II | Chemotherapy | cisplatin | PD |
| Page: 1 2 3 4 5 6 |
Top |
Related drugs of malignant transformation related genes |
| Identification of chemicals and drugs interact with genes involved in malignant transfromation |
| (DGIdb 4.0) |
| Entrez ID | Symbol | Category | Interaction Types | Drug Claim Name | Drug Name | PMIDs |
| Page: 1 |

Copyright 2023-Present -The University of Texas Health Science Center at Houston |