
|
|||||
|
 | |
| |
| |
| |
| |
| |
|
Gene: C1orf116 |
Gene summary for C1ORF116 |
| Gene information | Species | Human | Gene symbol | C1orf116 | Gene ID | 79098 |
| Gene name | chromosome 1 open reading frame 116 | |
| Gene Alias | SARG | |
| Cytomap | 1q32.1 | |
| Gene Type | protein-coding | GO ID | GO:0008150 | UniProtAcc | Q9BW04 |
Top |
Malignant transformation analysis |
| Identification of the aberrant gene expression in precancerous and cancerous lesions by comparing the gene expression of stem-like cells in diseased tissues with normal stem cells |
| Entrez ID | Symbol | Replicates | Species | Organ | Tissue | Adj P-value | Log2FC | Malignancy |
| 79098 | C1orf116 | P37T-E | Human | Esophagus | ESCC | 9.24e-07 | 5.31e-02 | 0.1371 |
| 79098 | C1orf116 | P38T-E | Human | Esophagus | ESCC | 2.89e-02 | 5.94e-02 | 0.127 |
| 79098 | C1orf116 | P39T-E | Human | Esophagus | ESCC | 1.27e-03 | 1.48e-01 | 0.0894 |
| 79098 | C1orf116 | P42T-E | Human | Esophagus | ESCC | 8.17e-04 | -1.96e-02 | 0.1175 |
| 79098 | C1orf116 | P44T-E | Human | Esophagus | ESCC | 3.20e-03 | 1.27e-03 | 0.1096 |
| 79098 | C1orf116 | P47T-E | Human | Esophagus | ESCC | 7.01e-09 | 1.81e-01 | 0.1067 |
| 79098 | C1orf116 | P48T-E | Human | Esophagus | ESCC | 4.49e-05 | -5.37e-03 | 0.0959 |
| 79098 | C1orf116 | P52T-E | Human | Esophagus | ESCC | 9.79e-08 | 6.68e-03 | 0.1555 |
| 79098 | C1orf116 | P54T-E | Human | Esophagus | ESCC | 3.57e-16 | 3.69e-01 | 0.0975 |
| 79098 | C1orf116 | P57T-E | Human | Esophagus | ESCC | 8.56e-05 | 9.35e-02 | 0.0926 |
| 79098 | C1orf116 | P61T-E | Human | Esophagus | ESCC | 4.93e-04 | -7.79e-02 | 0.099 |
| 79098 | C1orf116 | P62T-E | Human | Esophagus | ESCC | 1.40e-07 | 8.36e-02 | 0.1302 |
| 79098 | C1orf116 | P65T-E | Human | Esophagus | ESCC | 2.45e-04 | 4.33e-02 | 0.0978 |
| 79098 | C1orf116 | P74T-E | Human | Esophagus | ESCC | 6.36e-05 | 1.94e-01 | 0.1479 |
| 79098 | C1orf116 | P75T-E | Human | Esophagus | ESCC | 4.45e-14 | 5.74e-01 | 0.1125 |
| 79098 | C1orf116 | P80T-E | Human | Esophagus | ESCC | 8.27e-06 | 4.47e-01 | 0.155 |
| 79098 | C1orf116 | P82T-E | Human | Esophagus | ESCC | 4.16e-09 | 8.20e-01 | 0.1072 |
| 79098 | C1orf116 | P83T-E | Human | Esophagus | ESCC | 5.13e-07 | 2.39e-01 | 0.1738 |
| 79098 | C1orf116 | P89T-E | Human | Esophagus | ESCC | 2.64e-03 | 1.27e-01 | 0.1752 |
| 79098 | C1orf116 | P91T-E | Human | Esophagus | ESCC | 4.35e-04 | 5.06e-01 | 0.1828 |
| Page: 1 2 3 4 |
| Tissue | Expression Dynamics | Abbreviation |
| Esophagus | 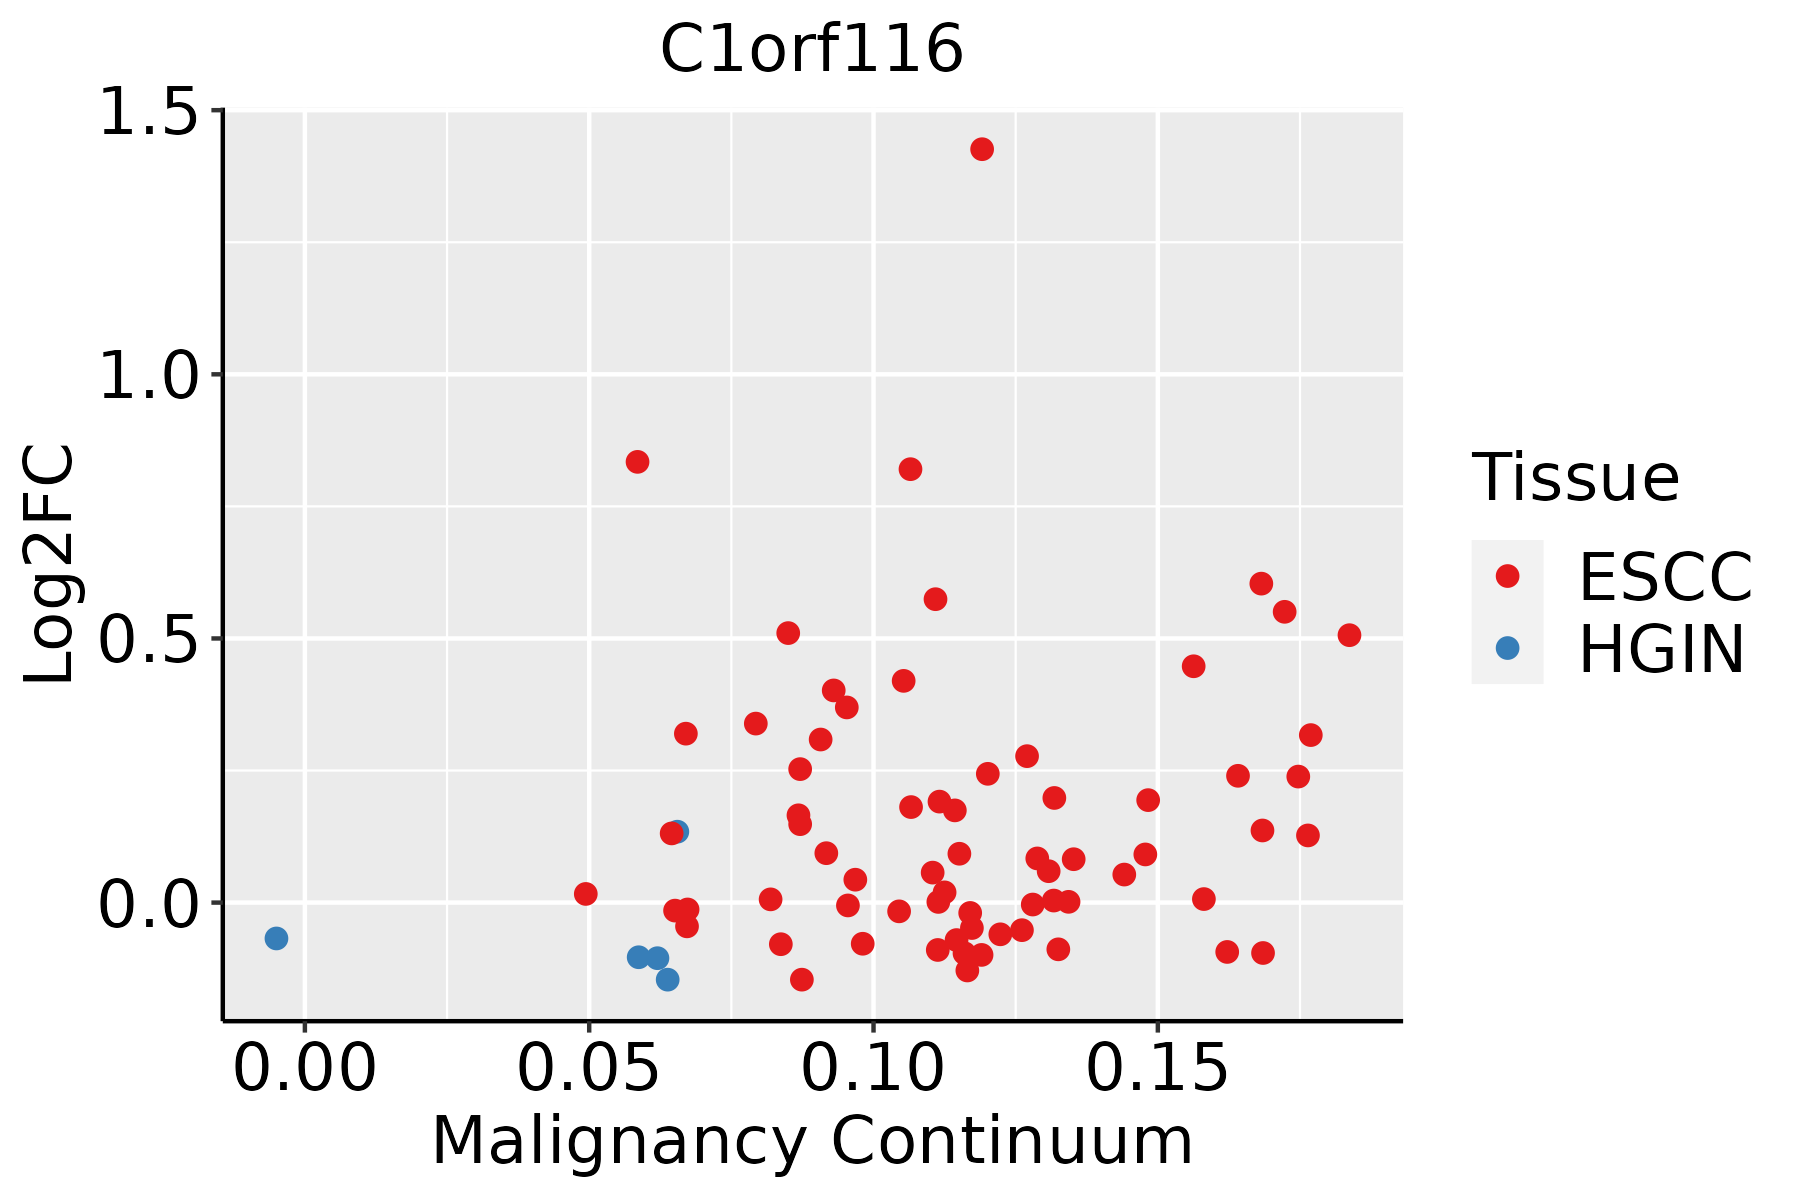 | ESCC: Esophageal squamous cell carcinoma |
| HGIN: High-grade intraepithelial neoplasias | ||
| LGIN: Low-grade intraepithelial neoplasias | ||
| Lung | 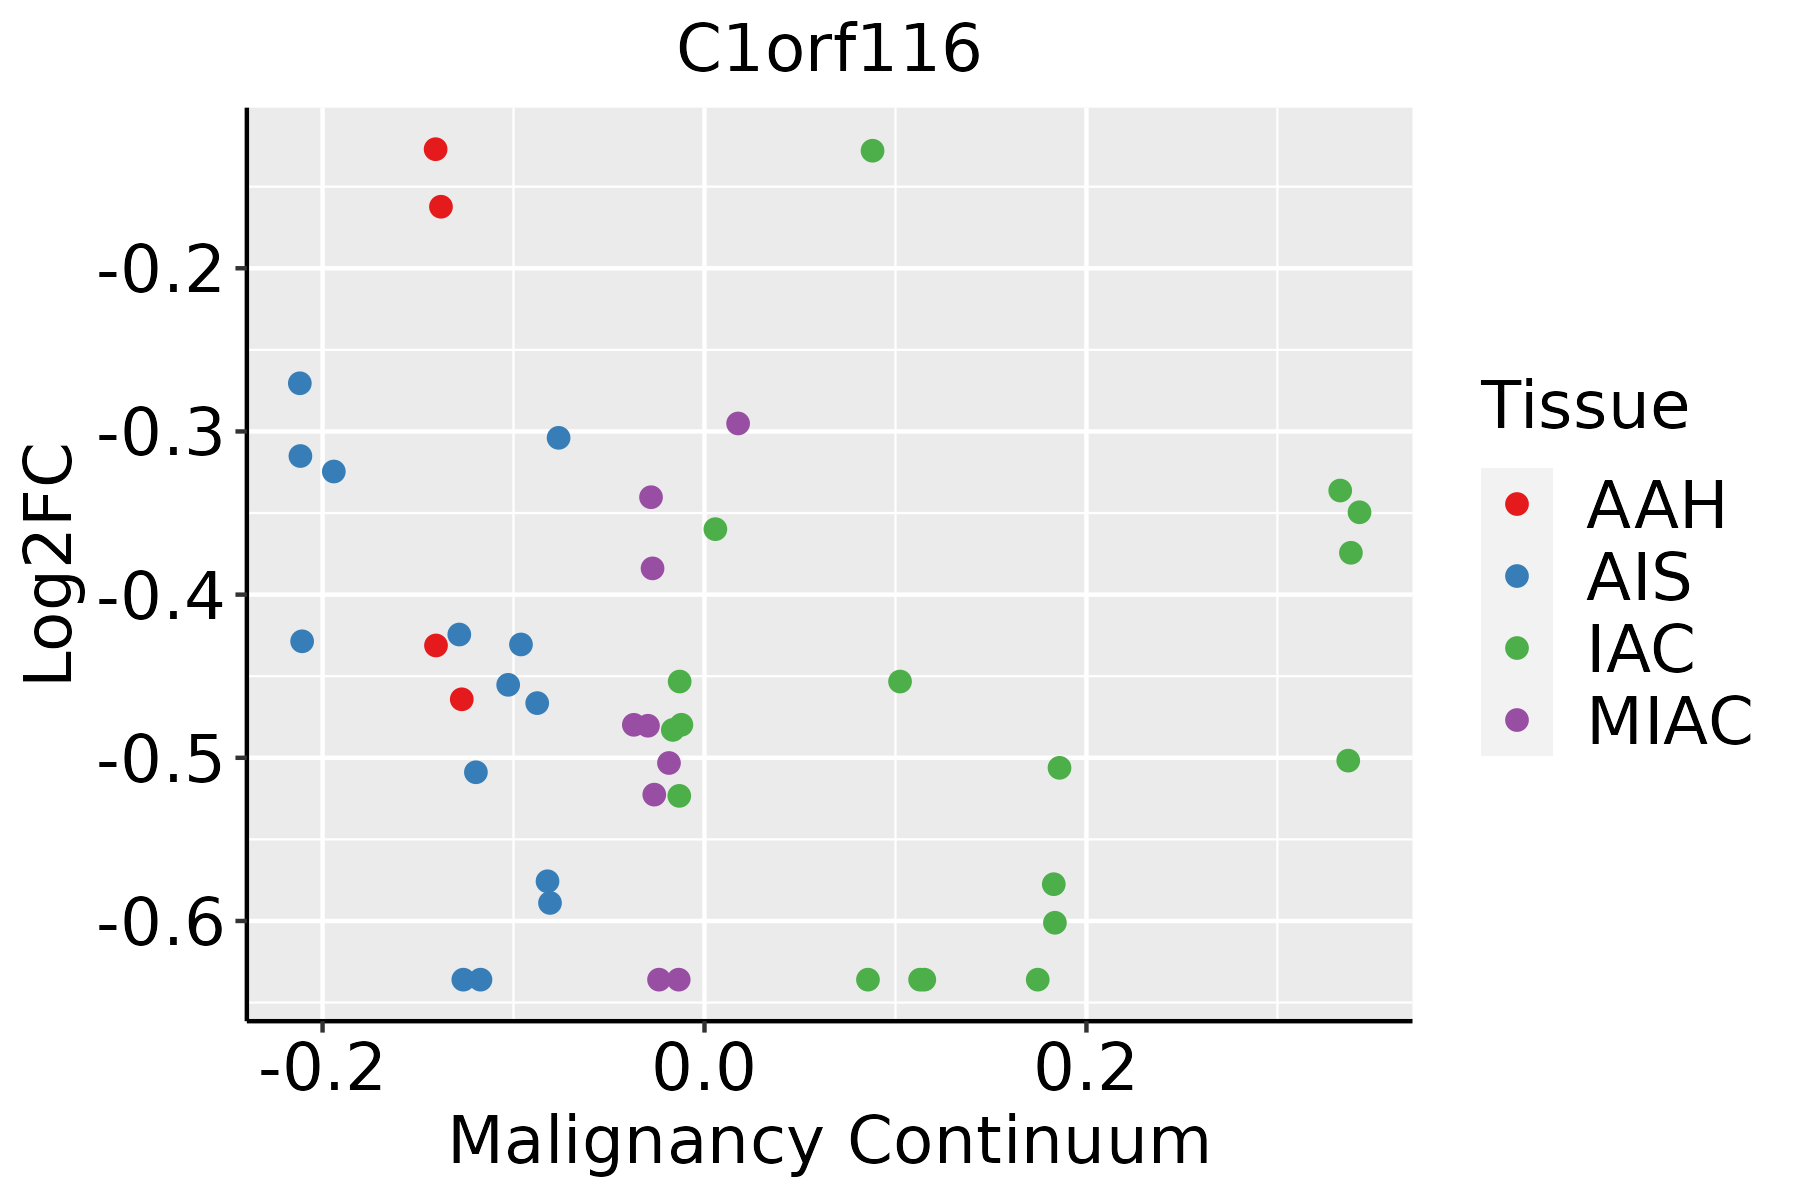 | AAH: Atypical adenomatous hyperplasia |
| AIS: Adenocarcinoma in situ | ||
| IAC: Invasive lung adenocarcinoma | ||
| MIA: Minimally invasive adenocarcinoma | ||
| Oral Cavity | 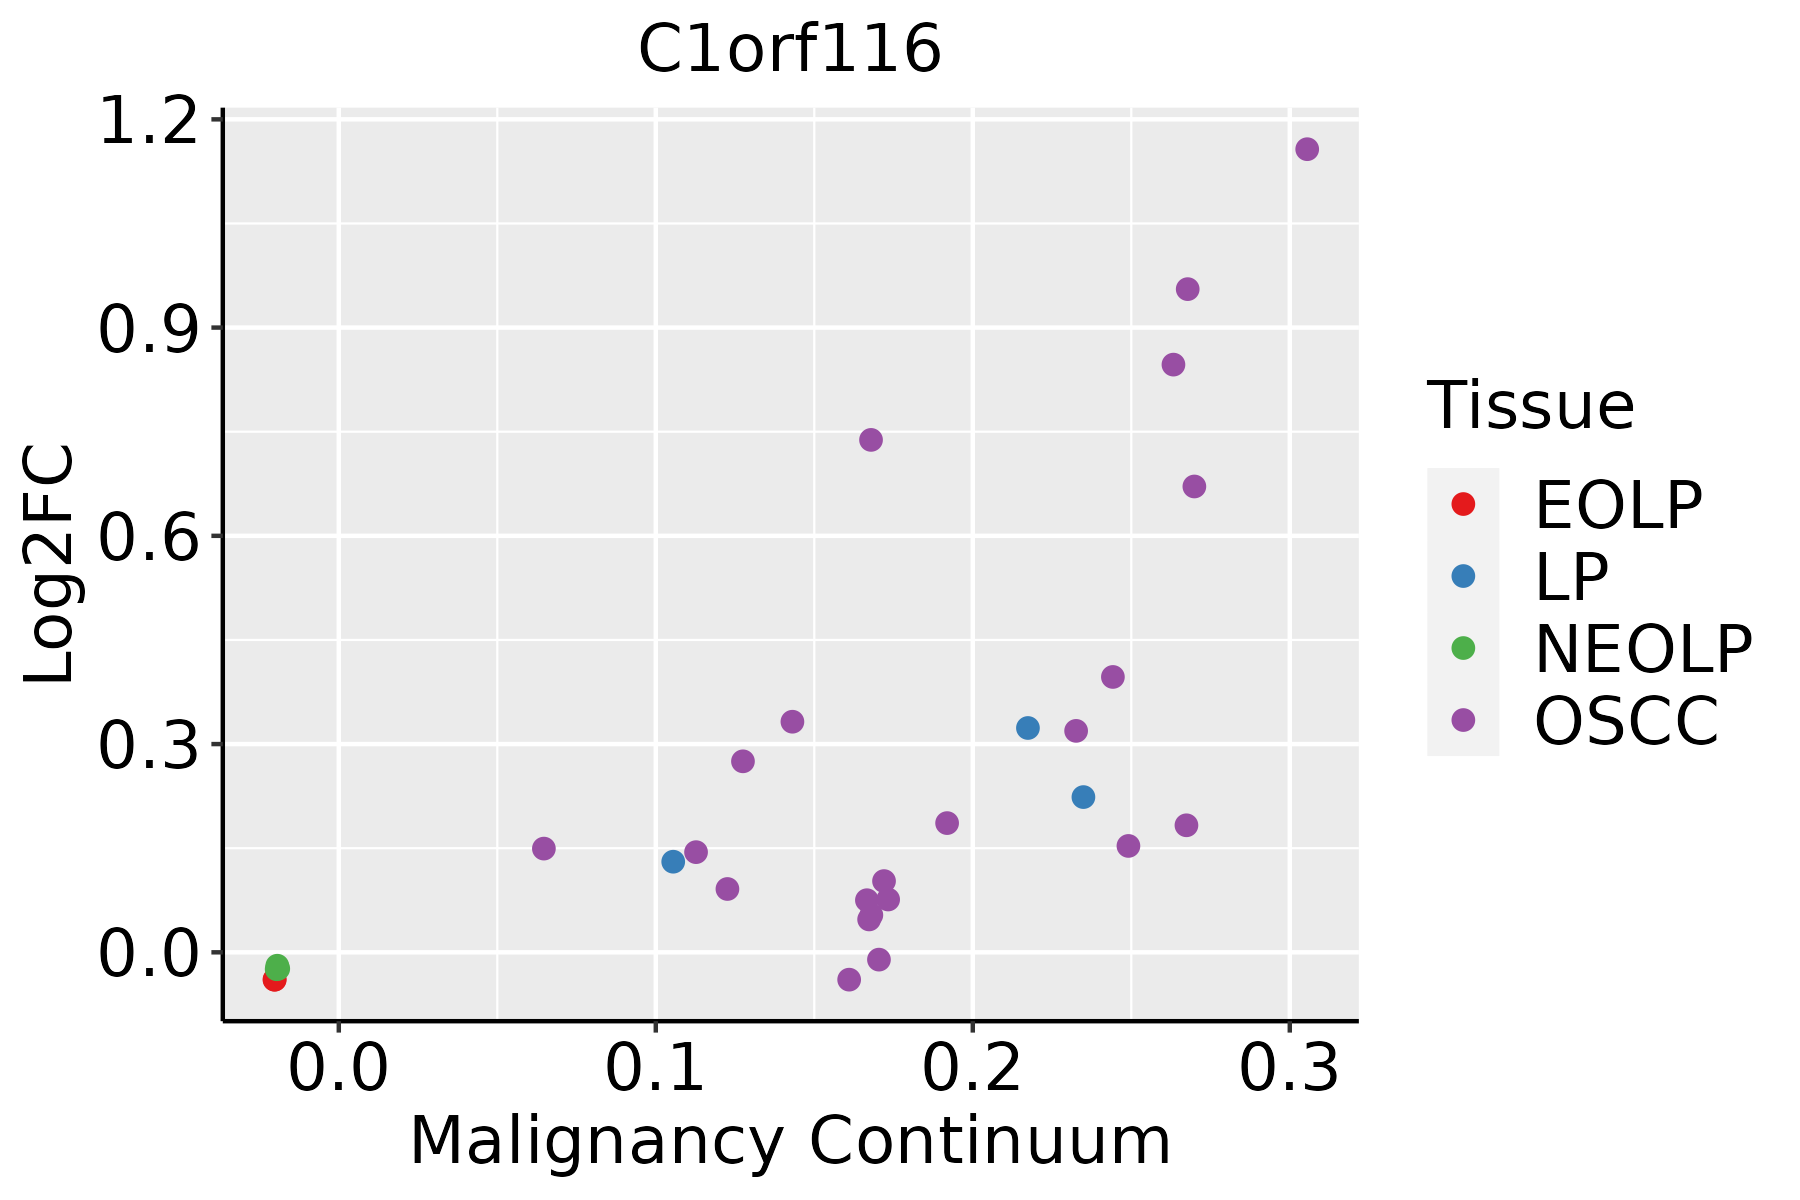 | EOLP: Erosive Oral lichen planus |
| LP: leukoplakia | ||
| NEOLP: Non-erosive oral lichen planus | ||
| OSCC: Oral squamous cell carcinoma | ||
| Prostate | 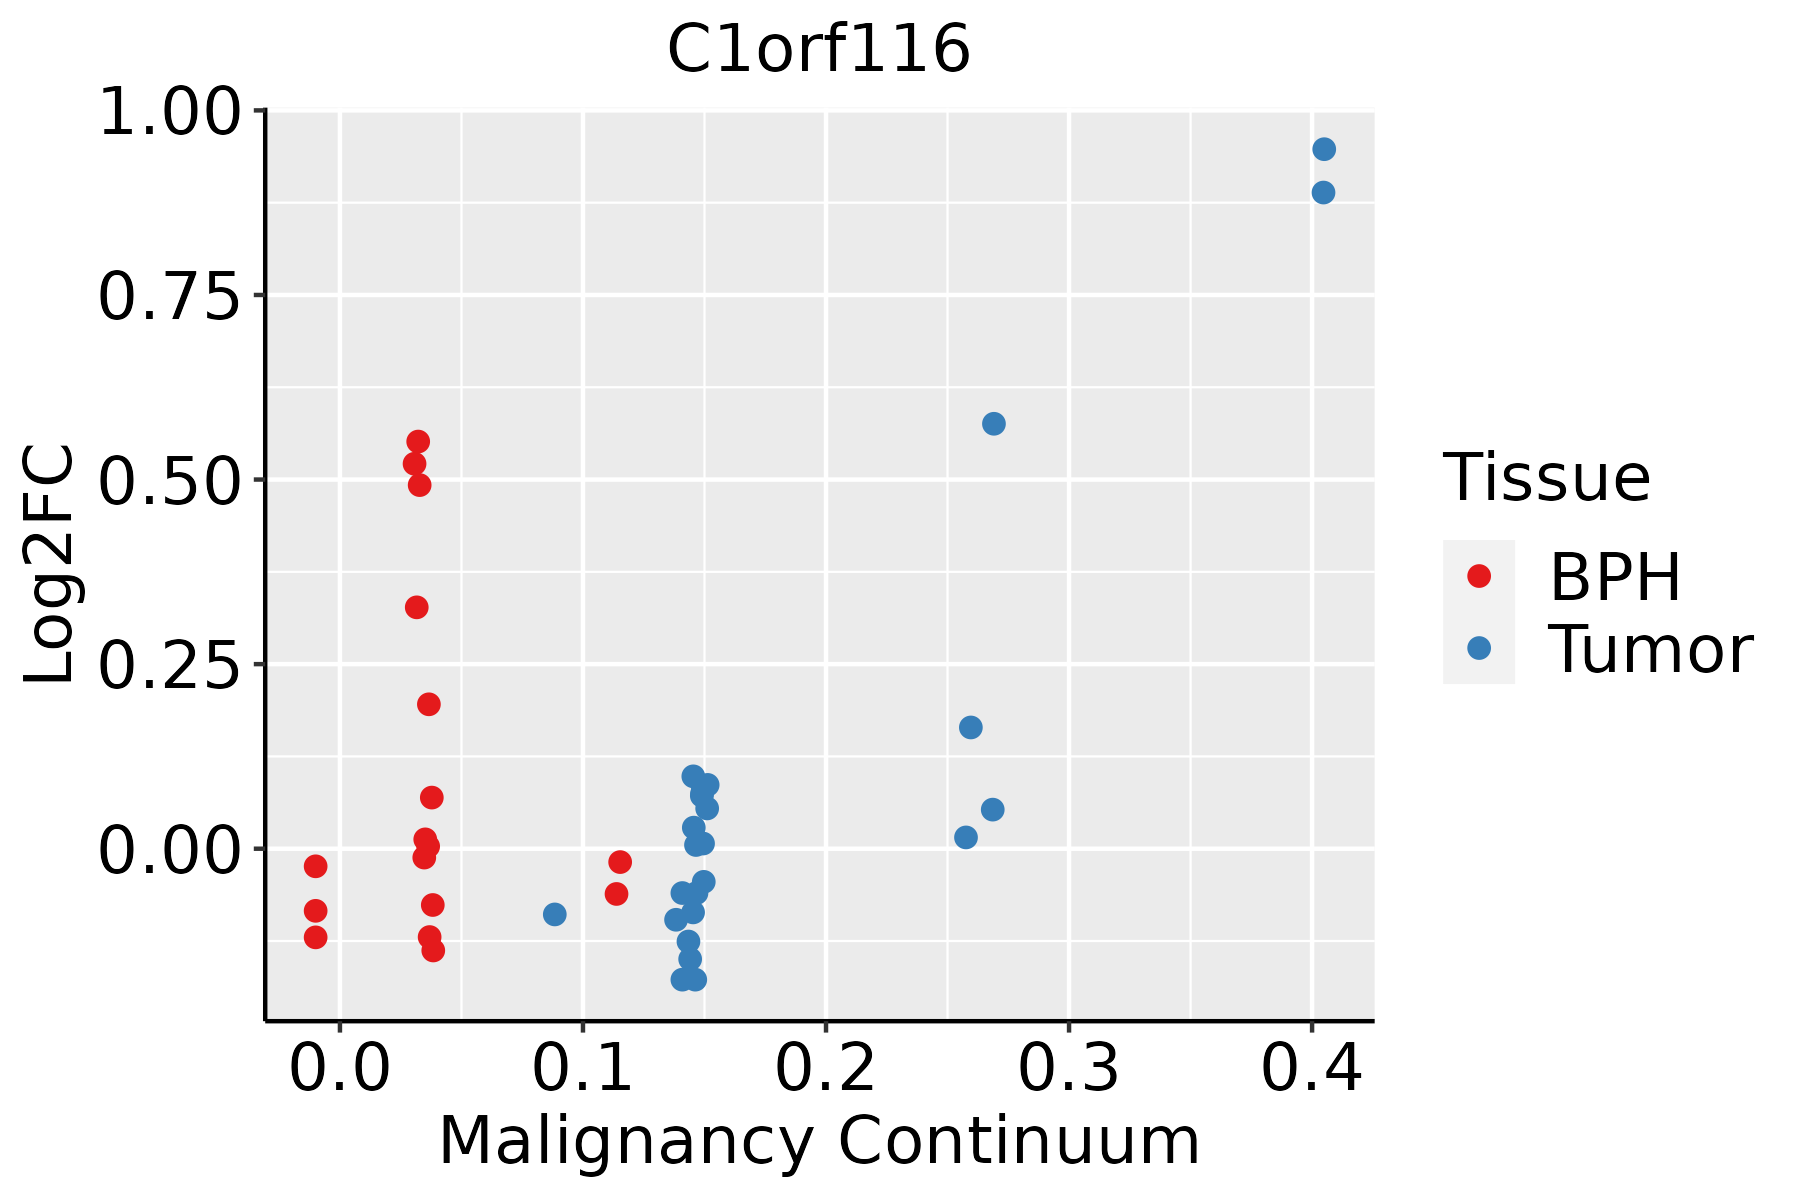 | BPH: Benign Prostatic Hyperplasia |
| Skin | 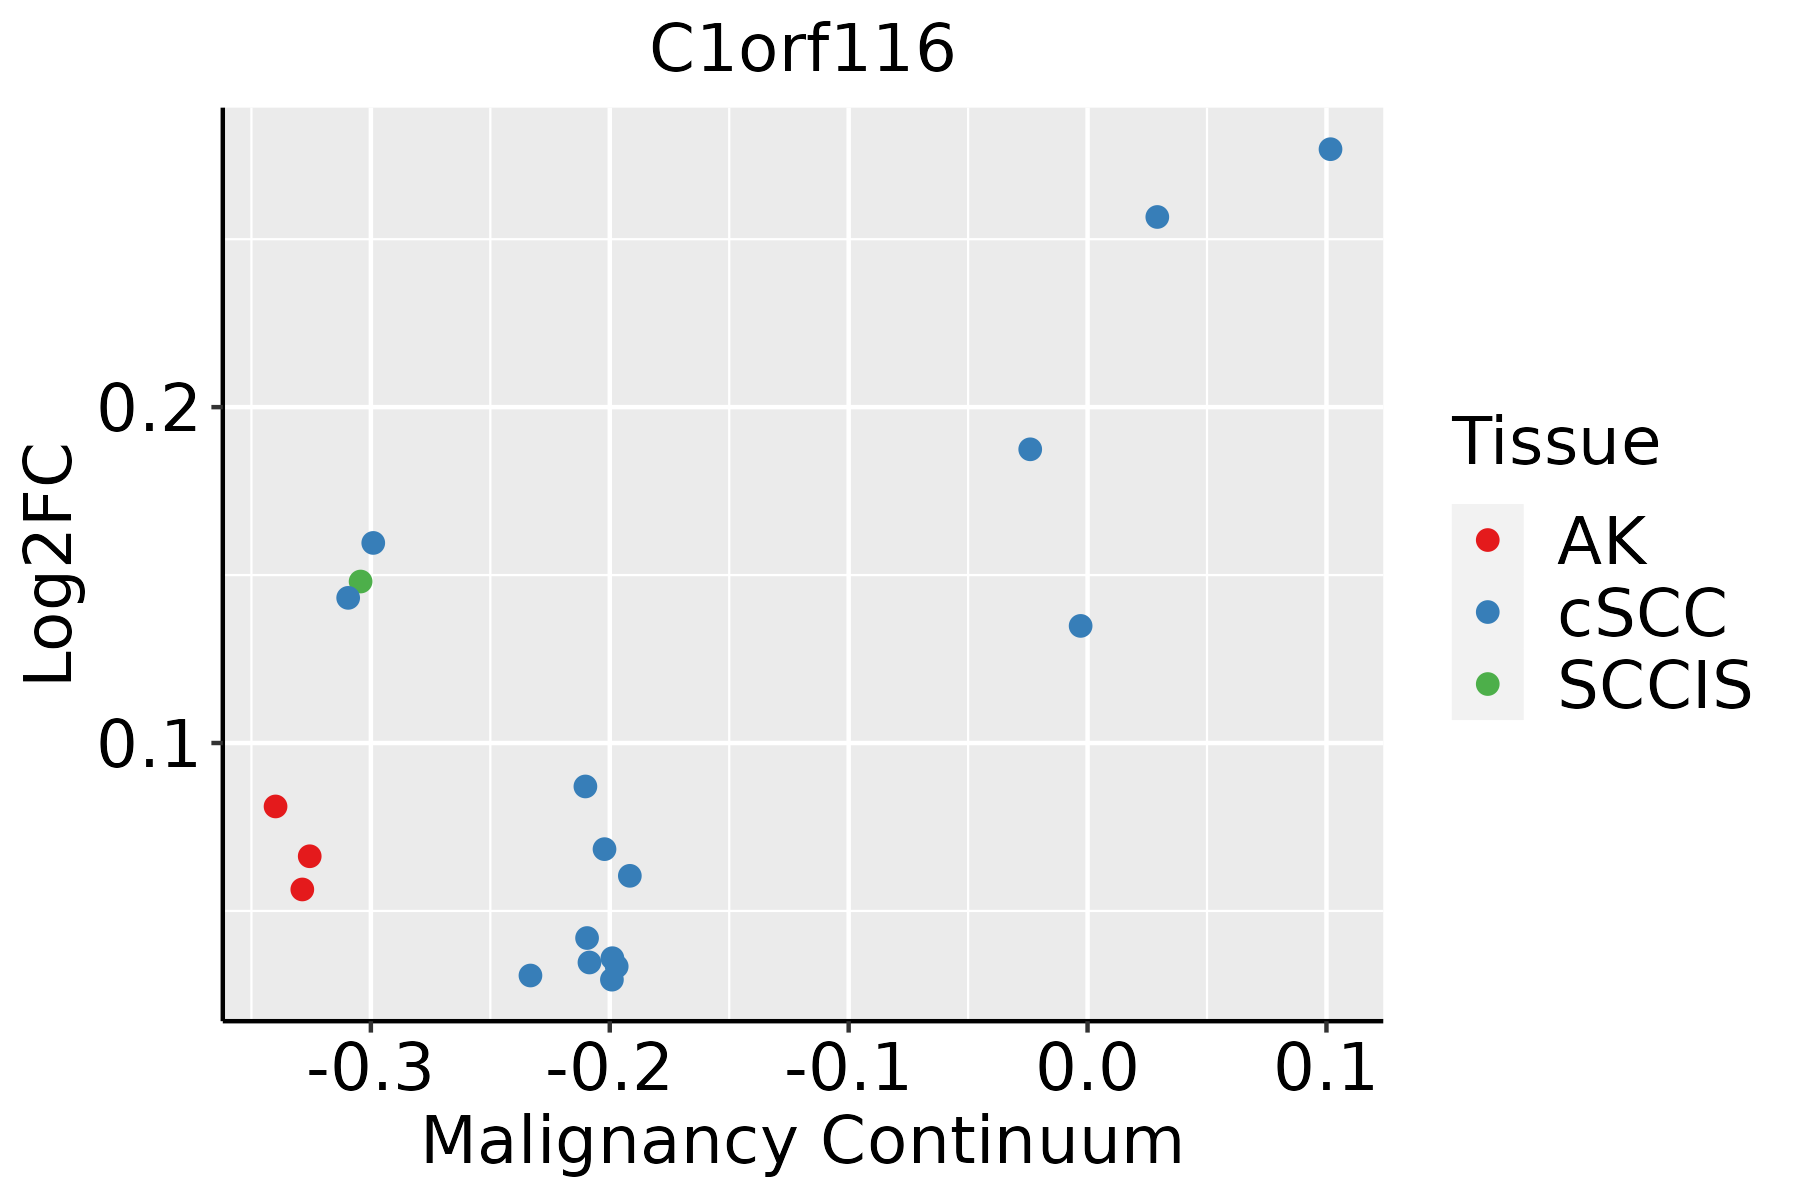 | AK: Actinic keratosis |
| cSCC: Cutaneous squamous cell carcinoma | ||
| SCCIS:squamous cell carcinoma in situ |
| ∗log2FC in expression of this searched gene in stem-like cells from each diseased tissue sample relative to stem-like cells in normal samples in each tissue plotted against the malignancy continuum. Samples are colored based on if they are from different disease stage. |
Top |
Malignant transformation related pathway analysis |
| Find out the enriched GO biological processes and KEGG pathways involved in transition from healthy to precancer to cancer |
| Tissue | Disease Stage | Enriched GO biological Processes |
| Colorectum | AD |  |
| Colorectum | SER |  |
| Colorectum | MSS |  |
| Colorectum | MSI-H |  |
| Colorectum | FAP |  |
| ∗Top 15 enriched GO BP terms are showed in the bar plot of each disease state in each tissue. Each row represents a significant GO biological process which is colored according to the -log10(p.adjust). |
| Page: 1 2 3 4 5 6 7 8 9 |
| GO ID | Tissue | Disease Stage | Description | Gene Ratio | Bg Ratio | pvalue | p.adjust | Count |
| Page: 1 |
| Pathway ID | Tissue | Disease Stage | Description | Gene Ratio | Bg Ratio | pvalue | p.adjust | qvalue | Count |
| Page: 1 |
Top |
Cell-cell communication analysis |
| Identification of potential cell-cell interactions between two cell types and their ligand-receptor pairs for different disease states |
| Ligand | Receptor | LRpair | Pathway | Tissue | Disease Stage |
| Page: 1 |
Top |
Single-cell gene regulatory network inference analysis |
| Find out the significant the regulons (TFs) and the target genes of each regulon across cell types for different disease states |
| TF | Cell Type | Tissue | Disease Stage | Target Gene | RSS | Regulon Activity |
| ∗The dot plots of a searched regulon are shown for all cell subpopulations in each disease state of each tissue based on the regulon specific score inferred using pySCENIC and by calculating the average expression. |
| Page: 1 |
Top |
Somatic mutation of malignant transformation related genes |
| Annotation of somatic variants for genes involved in malignant transformation |
| Hugo Symbol | Variant Class | Variant Classification | dbSNP RS | HGVSc | HGVSp | HGVSp Short | SWISSPROT | BIOTYPE | SIFT | PolyPhen | Tumor Sample Barcode | Tissue | Histology | Sex | Age | Stage | Therapy Types | Drugs | Outcome |
| C1orf116 | SNV | Missense_Mutation | novel | c.967T>C | p.Ser323Pro | p.S323P | Q9BW04 | protein_coding | tolerated(0.06) | benign(0.043) | TCGA-A2-A25A-01 | Breast | breast invasive carcinoma | Female | <65 | I/II | Unspecific | Cytoxan | SD |
| C1orf116 | SNV | Missense_Mutation | c.1281G>A | p.Met427Ile | p.M427I | Q9BW04 | protein_coding | tolerated(0.07) | benign(0) | TCGA-AC-A23H-01 | Breast | breast invasive carcinoma | Female | >=65 | I/II | Unknown | Unknown | PD | |
| C1orf116 | SNV | Missense_Mutation | c.1664N>T | p.Ser555Ile | p.S555I | Q9BW04 | protein_coding | deleterious(0.01) | benign(0.211) | TCGA-E9-A22A-01 | Breast | breast invasive carcinoma | Female | >=65 | I/II | Hormone Therapy | tamoxiphen | SD | |
| C1orf116 | SNV | Missense_Mutation | novel | c.1252N>G | p.Pro418Ala | p.P418A | Q9BW04 | protein_coding | tolerated(0.15) | benign(0.395) | TCGA-GM-A3XL-01 | Breast | breast invasive carcinoma | Female | <65 | I/II | Chemotherapy | fluorouracil | CR |
| C1orf116 | insertion | Nonsense_Mutation | novel | c.120_121insAGGCAGAAGAAGGTGTAGCCACACT | p.Asp41ArgfsTer6 | p.D41Rfs*6 | Q9BW04 | protein_coding | TCGA-A2-A0CQ-01 | Breast | breast invasive carcinoma | Female | <65 | I/II | Chemotherapy | adriamycin | SD | ||
| C1orf116 | insertion | Frame_Shift_Ins | novel | c.1248_1249insCT | p.Ala417LeufsTer12 | p.A417Lfs*12 | Q9BW04 | protein_coding | TCGA-A8-A0A4-01 | Breast | breast invasive carcinoma | Female | >=65 | I/II | Hormone Therapy | tamoxiphen | CR | ||
| C1orf116 | insertion | Nonsense_Mutation | novel | c.1247_1248insTTAGGAAGTAAATCTTACTTATGGTTGTGA | p.Pro416_Ala417insTer | p.P416_A417ins* | Q9BW04 | protein_coding | TCGA-A8-A0A4-01 | Breast | breast invasive carcinoma | Female | >=65 | I/II | Hormone Therapy | tamoxiphen | CR | ||
| C1orf116 | insertion | Nonsense_Mutation | novel | c.139_140insTATCAGAGCTCTAGAAGGGAAAGGGGTTTGACC | p.Glu47delinsValSerGluLeuTerLysGlyLysGlyPheAspGln | p.E47delinsVSEL*KGKGFDQ | Q9BW04 | protein_coding | TCGA-BH-A0BV-01 | Breast | breast invasive carcinoma | Female | >=65 | I/II | Chemotherapy | doxorubicin | SD | ||
| C1orf116 | SNV | Missense_Mutation | c.992N>T | p.Gly331Val | p.G331V | Q9BW04 | protein_coding | tolerated(0.11) | possibly_damaging(0.785) | TCGA-C5-A2LZ-01 | Cervix | cervical & endocervical cancer | Female | >=65 | III/IV | Unknown | Unknown | PD | |
| C1orf116 | SNV | Missense_Mutation | novel | c.525N>C | p.Gln175His | p.Q175H | Q9BW04 | protein_coding | deleterious(0.02) | possibly_damaging(0.826) | TCGA-EA-A3Y4-01 | Cervix | cervical & endocervical cancer | Female | <65 | I/II | Unknown | Unknown | SD |
| Page: 1 2 3 4 5 6 7 8 |
Top |
Related drugs of malignant transformation related genes |
| Identification of chemicals and drugs interact with genes involved in malignant transfromation |
| (DGIdb 4.0) |
| Entrez ID | Symbol | Category | Interaction Types | Drug Claim Name | Drug Name | PMIDs |
| Page: 1 |

Copyright 2023-Present -The University of Texas Health Science Center at Houston |