
|
|||||
|
 | |
| |
| |
| |
| |
| |
|
Gene: C19orf66 |
Gene summary for C19ORF66 |
| Gene information | Species | Human | Gene symbol | C19orf66 | Gene ID | 55337 |
| Gene name | shiftless antiviral inhibitor of ribosomal frameshifting | |
| Gene Alias | C19orf66 | |
| Cytomap | 19p13.2 | |
| Gene Type | protein-coding | GO ID | GO:0002376 | UniProtAcc | Q9NUL5 |
Top |
Malignant transformation analysis |
| Identification of the aberrant gene expression in precancerous and cancerous lesions by comparing the gene expression of stem-like cells in diseased tissues with normal stem cells |
| Entrez ID | Symbol | Replicates | Species | Organ | Tissue | Adj P-value | Log2FC | Malignancy |
| 55337 | C19orf66 | P28T-E | Human | Esophagus | ESCC | 4.48e-31 | 8.87e-01 | 0.1149 |
| 55337 | C19orf66 | P30T-E | Human | Esophagus | ESCC | 4.70e-12 | 5.05e-01 | 0.137 |
| 55337 | C19orf66 | P31T-E | Human | Esophagus | ESCC | 7.66e-46 | 8.61e-01 | 0.1251 |
| 55337 | C19orf66 | P32T-E | Human | Esophagus | ESCC | 1.75e-18 | 6.22e-01 | 0.1666 |
| 55337 | C19orf66 | P36T-E | Human | Esophagus | ESCC | 1.40e-30 | 1.02e+00 | 0.1187 |
| 55337 | C19orf66 | P37T-E | Human | Esophagus | ESCC | 2.27e-19 | 4.83e-01 | 0.1371 |
| 55337 | C19orf66 | P38T-E | Human | Esophagus | ESCC | 5.15e-07 | 2.20e-01 | 0.127 |
| 55337 | C19orf66 | P39T-E | Human | Esophagus | ESCC | 2.30e-13 | 3.41e-01 | 0.0894 |
| 55337 | C19orf66 | P40T-E | Human | Esophagus | ESCC | 1.58e-16 | 5.38e-01 | 0.109 |
| 55337 | C19orf66 | P42T-E | Human | Esophagus | ESCC | 4.20e-20 | 5.71e-01 | 0.1175 |
| 55337 | C19orf66 | P44T-E | Human | Esophagus | ESCC | 2.53e-06 | 2.88e-01 | 0.1096 |
| 55337 | C19orf66 | P47T-E | Human | Esophagus | ESCC | 1.53e-12 | 3.25e-01 | 0.1067 |
| 55337 | C19orf66 | P48T-E | Human | Esophagus | ESCC | 3.45e-07 | 2.85e-01 | 0.0959 |
| 55337 | C19orf66 | P49T-E | Human | Esophagus | ESCC | 3.69e-08 | 8.96e-01 | 0.1768 |
| 55337 | C19orf66 | P52T-E | Human | Esophagus | ESCC | 1.18e-21 | 6.31e-01 | 0.1555 |
| 55337 | C19orf66 | P54T-E | Human | Esophagus | ESCC | 2.79e-20 | 3.88e-01 | 0.0975 |
| 55337 | C19orf66 | P56T-E | Human | Esophagus | ESCC | 1.16e-07 | 1.14e+00 | 0.1613 |
| 55337 | C19orf66 | P57T-E | Human | Esophagus | ESCC | 9.77e-20 | 3.29e-01 | 0.0926 |
| 55337 | C19orf66 | P61T-E | Human | Esophagus | ESCC | 5.19e-28 | 6.41e-01 | 0.099 |
| 55337 | C19orf66 | P62T-E | Human | Esophagus | ESCC | 9.73e-71 | 1.13e+00 | 0.1302 |
| Page: 1 2 3 4 5 6 |
| Tissue | Expression Dynamics | Abbreviation |
| Esophagus |  | ESCC: Esophageal squamous cell carcinoma |
| HGIN: High-grade intraepithelial neoplasias | ||
| LGIN: Low-grade intraepithelial neoplasias | ||
| Liver | 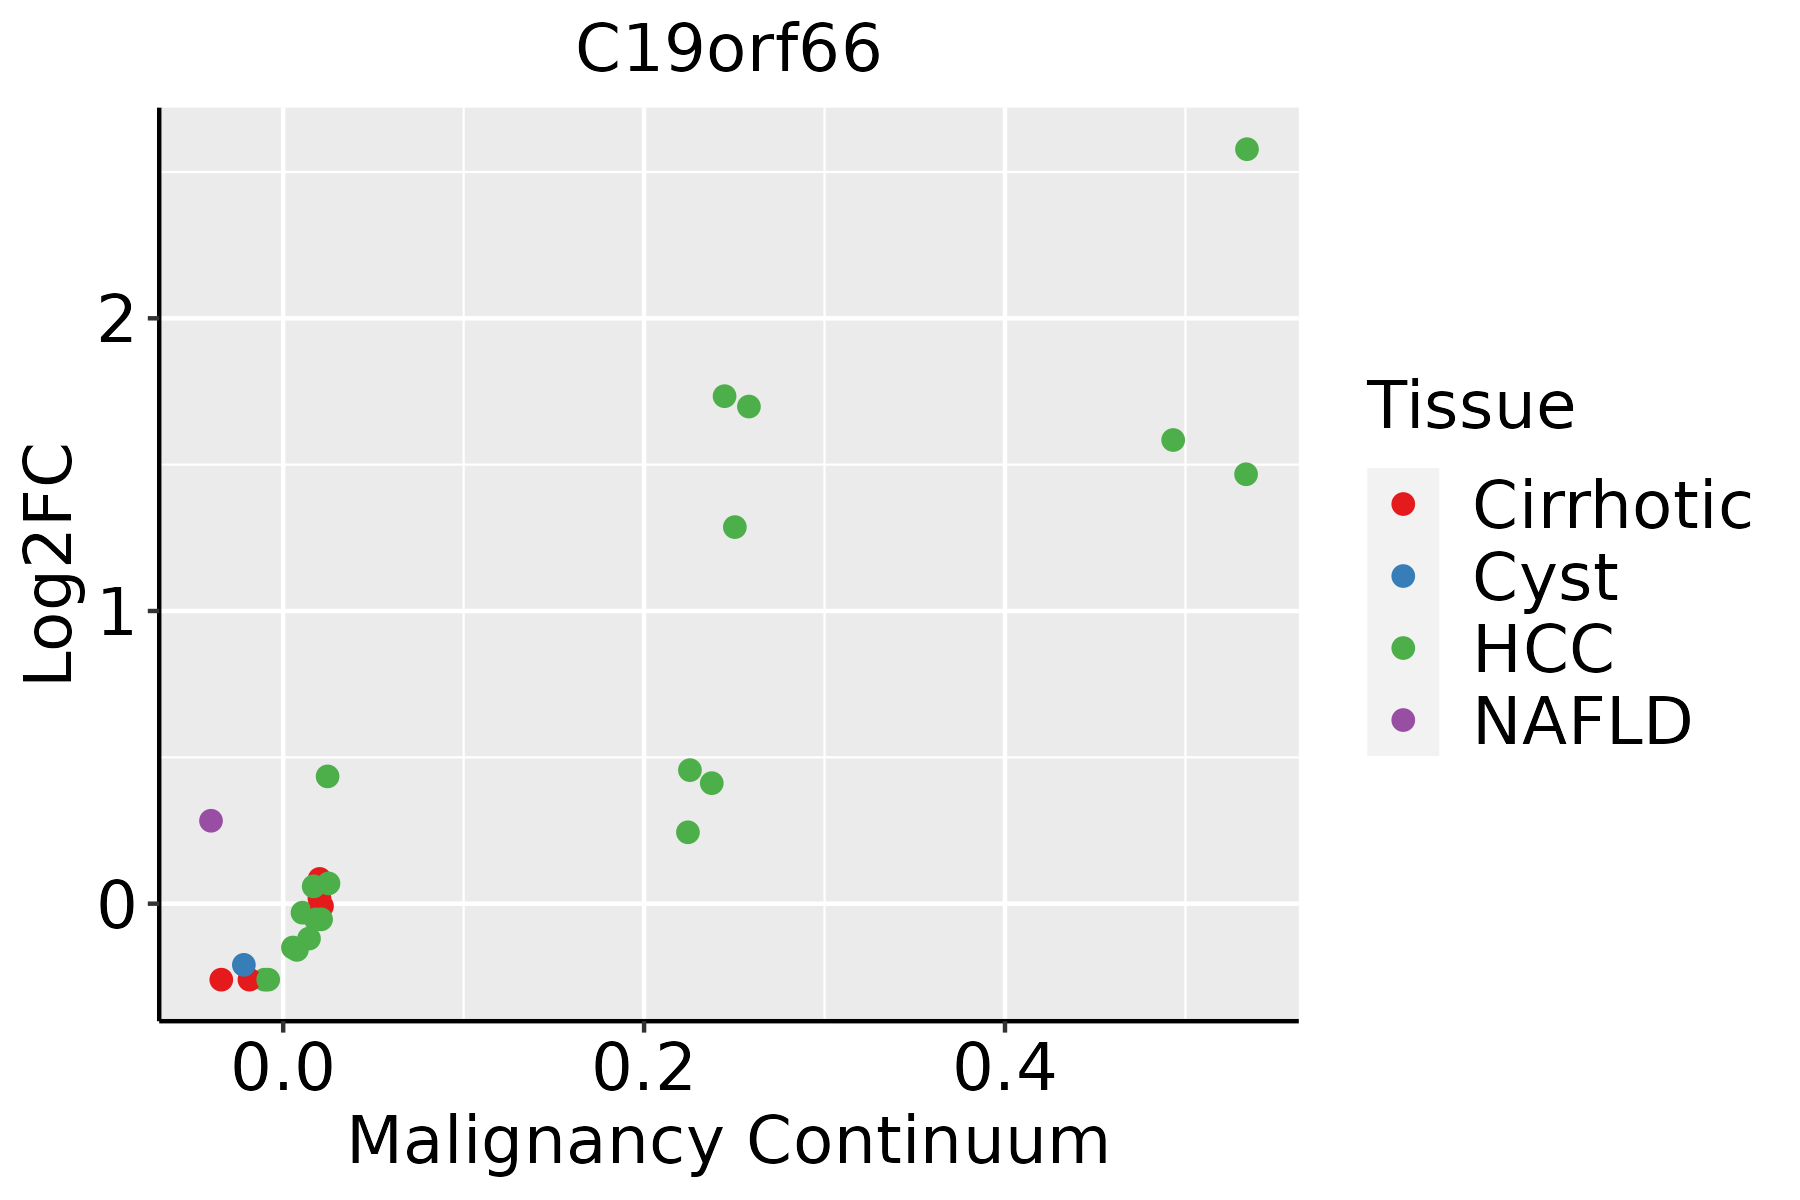 | HCC: Hepatocellular carcinoma |
| NAFLD: Non-alcoholic fatty liver disease | ||
| Oral Cavity | 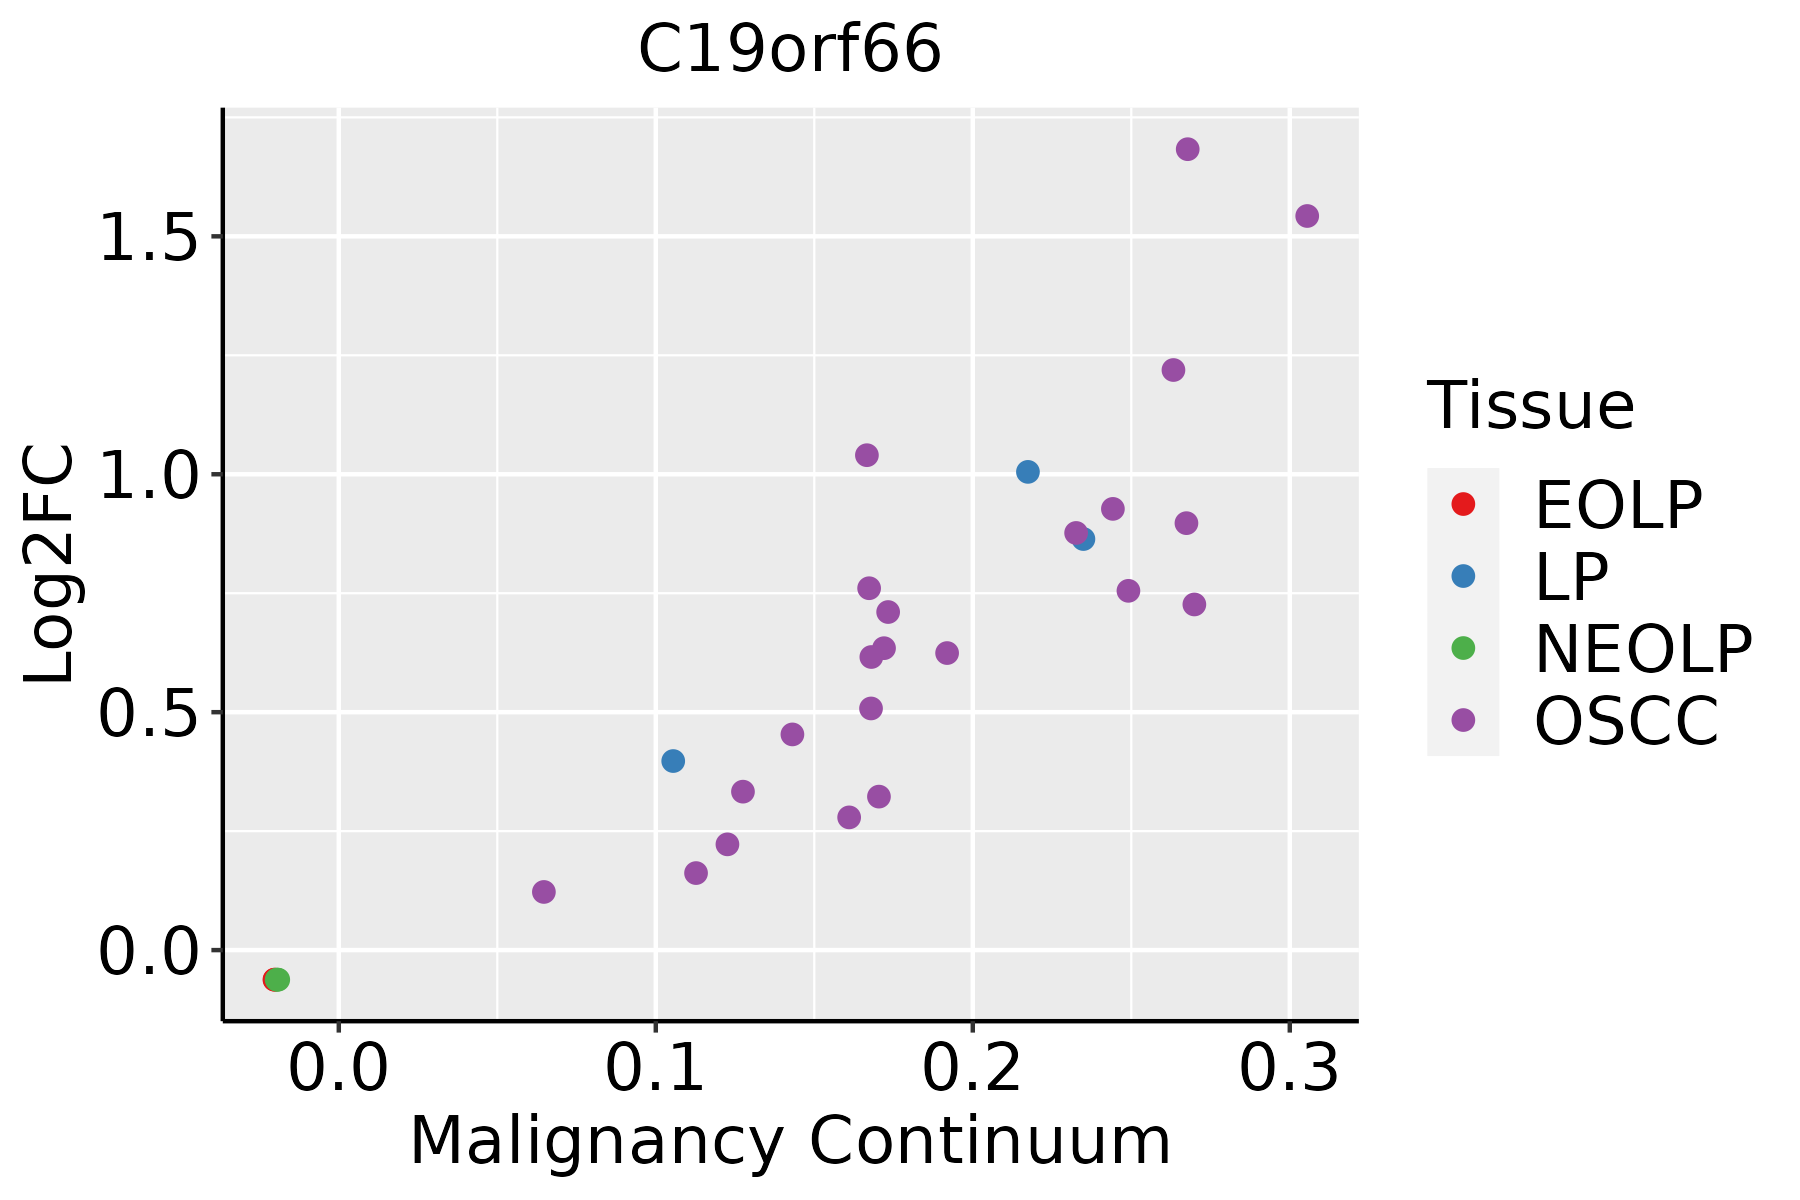 | EOLP: Erosive Oral lichen planus |
| LP: leukoplakia | ||
| NEOLP: Non-erosive oral lichen planus | ||
| OSCC: Oral squamous cell carcinoma | ||
| Skin | 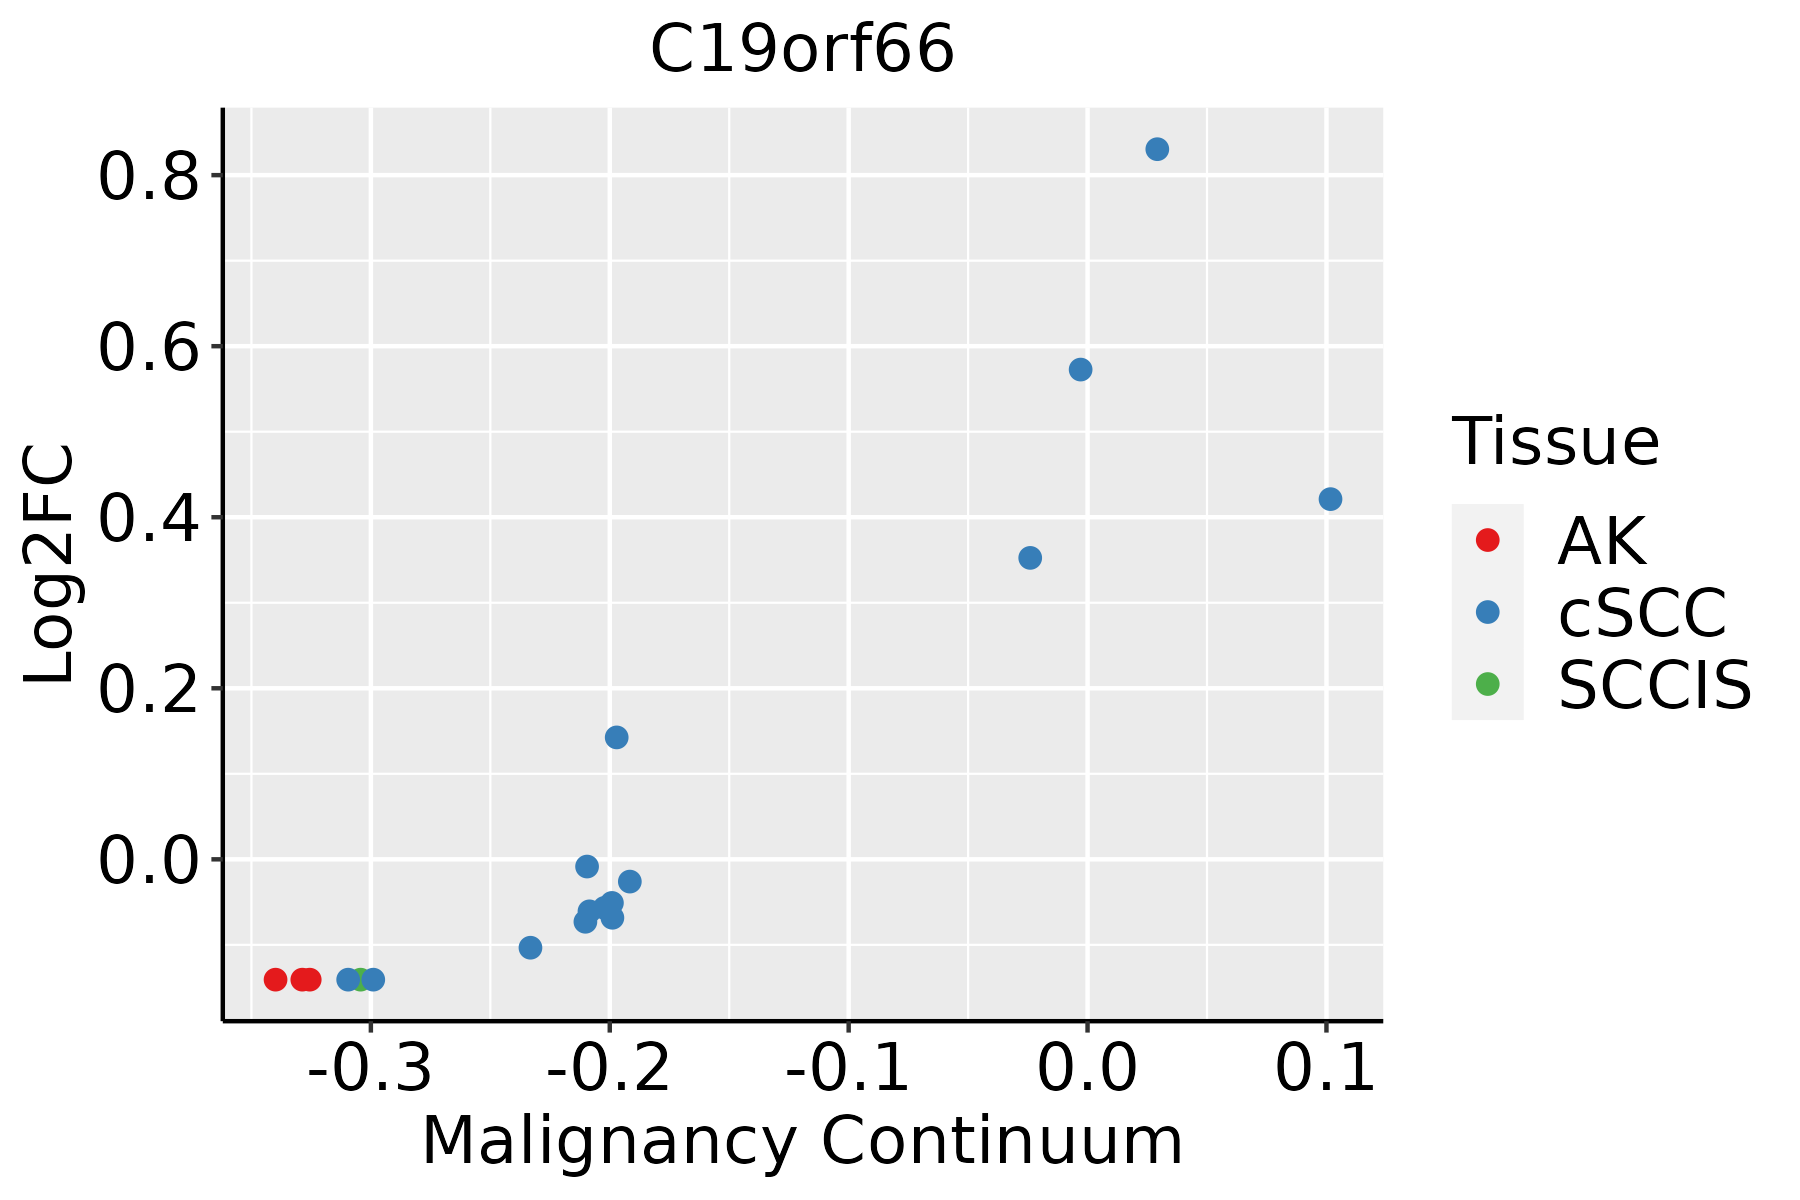 | AK: Actinic keratosis |
| cSCC: Cutaneous squamous cell carcinoma | ||
| SCCIS:squamous cell carcinoma in situ | ||
| Thyroid |  | ATC: Anaplastic thyroid cancer |
| HT: Hashimoto's thyroiditis | ||
| PTC: Papillary thyroid cancer |
| ∗log2FC in expression of this searched gene in stem-like cells from each diseased tissue sample relative to stem-like cells in normal samples in each tissue plotted against the malignancy continuum. Samples are colored based on if they are from different disease stage. |
Top |
Malignant transformation related pathway analysis |
| Find out the enriched GO biological processes and KEGG pathways involved in transition from healthy to precancer to cancer |
| Tissue | Disease Stage | Enriched GO biological Processes |
| Colorectum | AD |  |
| Colorectum | SER |  |
| Colorectum | MSS |  |
| Colorectum | MSI-H |  |
| Colorectum | FAP |  |
| ∗Top 15 enriched GO BP terms are showed in the bar plot of each disease state in each tissue. Each row represents a significant GO biological process which is colored according to the -log10(p.adjust). |
| Page: 1 2 3 4 5 6 7 8 9 |
| GO ID | Tissue | Disease Stage | Description | Gene Ratio | Bg Ratio | pvalue | p.adjust | Count |
| Page: 1 |
| Pathway ID | Tissue | Disease Stage | Description | Gene Ratio | Bg Ratio | pvalue | p.adjust | qvalue | Count |
| Page: 1 |
Top |
Cell-cell communication analysis |
| Identification of potential cell-cell interactions between two cell types and their ligand-receptor pairs for different disease states |
| Ligand | Receptor | LRpair | Pathway | Tissue | Disease Stage |
| Page: 1 |
Top |
Single-cell gene regulatory network inference analysis |
| Find out the significant the regulons (TFs) and the target genes of each regulon across cell types for different disease states |
| TF | Cell Type | Tissue | Disease Stage | Target Gene | RSS | Regulon Activity |
| ∗The dot plots of a searched regulon are shown for all cell subpopulations in each disease state of each tissue based on the regulon specific score inferred using pySCENIC and by calculating the average expression. |
| Page: 1 |
Top |
Somatic mutation of malignant transformation related genes |
| Annotation of somatic variants for genes involved in malignant transformation |
| Hugo Symbol | Variant Class | Variant Classification | dbSNP RS | HGVSc | HGVSp | HGVSp Short | SWISSPROT | BIOTYPE | SIFT | PolyPhen | Tumor Sample Barcode | Tissue | Histology | Sex | Age | Stage | Therapy Types | Drugs | Outcome |
| C19orf66 | SNV | Missense_Mutation | c.131G>T | p.Arg44Leu | p.R44L | Q9NUL5 | protein_coding | deleterious(0.04) | possibly_damaging(0.501) | TCGA-BH-A1FC-01 | Breast | breast invasive carcinoma | Female | >=65 | I/II | Unknown | Unknown | SD | |
| C19orf66 | SNV | Missense_Mutation | c.145N>A | p.Gly49Arg | p.G49R | Q9NUL5 | protein_coding | tolerated(0.37) | benign(0.352) | TCGA-NH-A5IV-01 | Colorectum | colon adenocarcinoma | Female | >=65 | I/II | Unknown | Unknown | SD | |
| C19orf66 | SNV | Missense_Mutation | rs370905686 | c.412N>T | p.Arg138Cys | p.R138C | Q9NUL5 | protein_coding | tolerated(0.05) | benign(0.01) | TCGA-QG-A5Z2-01 | Colorectum | colon adenocarcinoma | Male | <65 | I/II | Unknown | Unknown | SD |
| C19orf66 | deletion | Frame_Shift_Del | c.566delC | p.Pro189ArgfsTer67 | p.P189Rfs*67 | Q9NUL5 | protein_coding | TCGA-5M-AAT6-01 | Colorectum | colon adenocarcinoma | Female | <65 | III/IV | Unknown | Unknown | PD | |||
| C19orf66 | insertion | Frame_Shift_Ins | rs750276509 | c.560_561insC | p.Arg190AlafsTer57 | p.R190Afs*57 | Q9NUL5 | protein_coding | TCGA-A6-2686-01 | Colorectum | colon adenocarcinoma | Female | >=65 | I/II | Unknown | Unknown | SD | ||
| C19orf66 | deletion | Frame_Shift_Del | c.561delN | p.Pro189ArgfsTer67 | p.P189Rfs*67 | Q9NUL5 | protein_coding | TCGA-AA-3713-01 | Colorectum | colon adenocarcinoma | Male | >=65 | III/IV | Chemotherapy | 5-fluorouracil | PR | |||
| C19orf66 | deletion | Frame_Shift_Del | c.566delC | p.Pro189ArgfsTer67 | p.P189Rfs*67 | Q9NUL5 | protein_coding | TCGA-AA-3949-01 | Colorectum | colon adenocarcinoma | Female | >=65 | III/IV | Unknown | Unknown | SD | |||
| C19orf66 | deletion | Frame_Shift_Del | c.561delN | p.Pro189ArgfsTer67 | p.P189Rfs*67 | Q9NUL5 | protein_coding | TCGA-D5-6540-01 | Colorectum | colon adenocarcinoma | Male | >=65 | I/II | Unknown | Unknown | SD | |||
| C19orf66 | SNV | Missense_Mutation | novel | c.406C>T | p.Arg136Trp | p.R136W | Q9NUL5 | protein_coding | deleterious(0.03) | possibly_damaging(0.877) | TCGA-A5-A0G2-01 | Endometrium | uterine corpus endometrioid carcinoma | Female | <65 | III/IV | Unknown | Unknown | SD |
| C19orf66 | SNV | Missense_Mutation | novel | c.772G>T | p.Gly258Cys | p.G258C | Q9NUL5 | protein_coding | deleterious(0.02) | benign(0.065) | TCGA-A5-A0G2-01 | Endometrium | uterine corpus endometrioid carcinoma | Female | <65 | III/IV | Unknown | Unknown | SD |
| Page: 1 2 3 |
Top |
Related drugs of malignant transformation related genes |
| Identification of chemicals and drugs interact with genes involved in malignant transfromation |
| (DGIdb 4.0) |
| Entrez ID | Symbol | Category | Interaction Types | Drug Claim Name | Drug Name | PMIDs |
| Page: 1 |

Copyright 2023-Present -The University of Texas Health Science Center at Houston |