
|
|||||
|
 | |
| |
| |
| |
| |
| |
|
Gene: BRAT1 |
Gene summary for BRAT1 |
| Gene information | Species | Human | Gene symbol | BRAT1 | Gene ID | 221927 |
| Gene name | BRCA1 associated ATM activator 1 | |
| Gene Alias | BAAT1 | |
| Cytomap | 7p22.3 | |
| Gene Type | protein-coding | GO ID | GO:0001558 | UniProtAcc | Q6PJG6 |
Top |
Malignant transformation analysis |
| Identification of the aberrant gene expression in precancerous and cancerous lesions by comparing the gene expression of stem-like cells in diseased tissues with normal stem cells |
| Entrez ID | Symbol | Replicates | Species | Organ | Tissue | Adj P-value | Log2FC | Malignancy |
| 221927 | BRAT1 | P17T-E | Human | Esophagus | ESCC | 4.68e-13 | 3.64e-01 | 0.1278 |
| 221927 | BRAT1 | P19T-E | Human | Esophagus | ESCC | 1.66e-11 | 6.80e-01 | 0.1662 |
| 221927 | BRAT1 | P20T-E | Human | Esophagus | ESCC | 1.74e-28 | 5.89e-01 | 0.1124 |
| 221927 | BRAT1 | P21T-E | Human | Esophagus | ESCC | 2.36e-24 | 5.59e-01 | 0.1617 |
| 221927 | BRAT1 | P22T-E | Human | Esophagus | ESCC | 1.06e-24 | 4.59e-01 | 0.1236 |
| 221927 | BRAT1 | P23T-E | Human | Esophagus | ESCC | 3.71e-15 | 3.73e-01 | 0.108 |
| 221927 | BRAT1 | P24T-E | Human | Esophagus | ESCC | 5.54e-08 | 2.59e-01 | 0.1287 |
| 221927 | BRAT1 | P26T-E | Human | Esophagus | ESCC | 1.02e-29 | 5.77e-01 | 0.1276 |
| 221927 | BRAT1 | P27T-E | Human | Esophagus | ESCC | 6.36e-36 | 6.94e-01 | 0.1055 |
| 221927 | BRAT1 | P28T-E | Human | Esophagus | ESCC | 2.13e-31 | 6.34e-01 | 0.1149 |
| 221927 | BRAT1 | P30T-E | Human | Esophagus | ESCC | 7.43e-33 | 1.09e+00 | 0.137 |
| 221927 | BRAT1 | P31T-E | Human | Esophagus | ESCC | 5.49e-20 | 4.19e-01 | 0.1251 |
| 221927 | BRAT1 | P32T-E | Human | Esophagus | ESCC | 1.06e-14 | 4.58e-01 | 0.1666 |
| 221927 | BRAT1 | P36T-E | Human | Esophagus | ESCC | 7.93e-06 | 2.10e-01 | 0.1187 |
| 221927 | BRAT1 | P37T-E | Human | Esophagus | ESCC | 2.85e-27 | 5.22e-01 | 0.1371 |
| 221927 | BRAT1 | P39T-E | Human | Esophagus | ESCC | 2.10e-19 | 3.01e-01 | 0.0894 |
| 221927 | BRAT1 | P40T-E | Human | Esophagus | ESCC | 1.94e-17 | 4.58e-01 | 0.109 |
| 221927 | BRAT1 | P42T-E | Human | Esophagus | ESCC | 4.06e-31 | 7.81e-01 | 0.1175 |
| 221927 | BRAT1 | P44T-E | Human | Esophagus | ESCC | 6.04e-08 | 1.92e-01 | 0.1096 |
| 221927 | BRAT1 | P47T-E | Human | Esophagus | ESCC | 5.80e-12 | 3.38e-01 | 0.1067 |
| Page: 1 2 3 4 5 |
| Tissue | Expression Dynamics | Abbreviation |
| Esophagus | 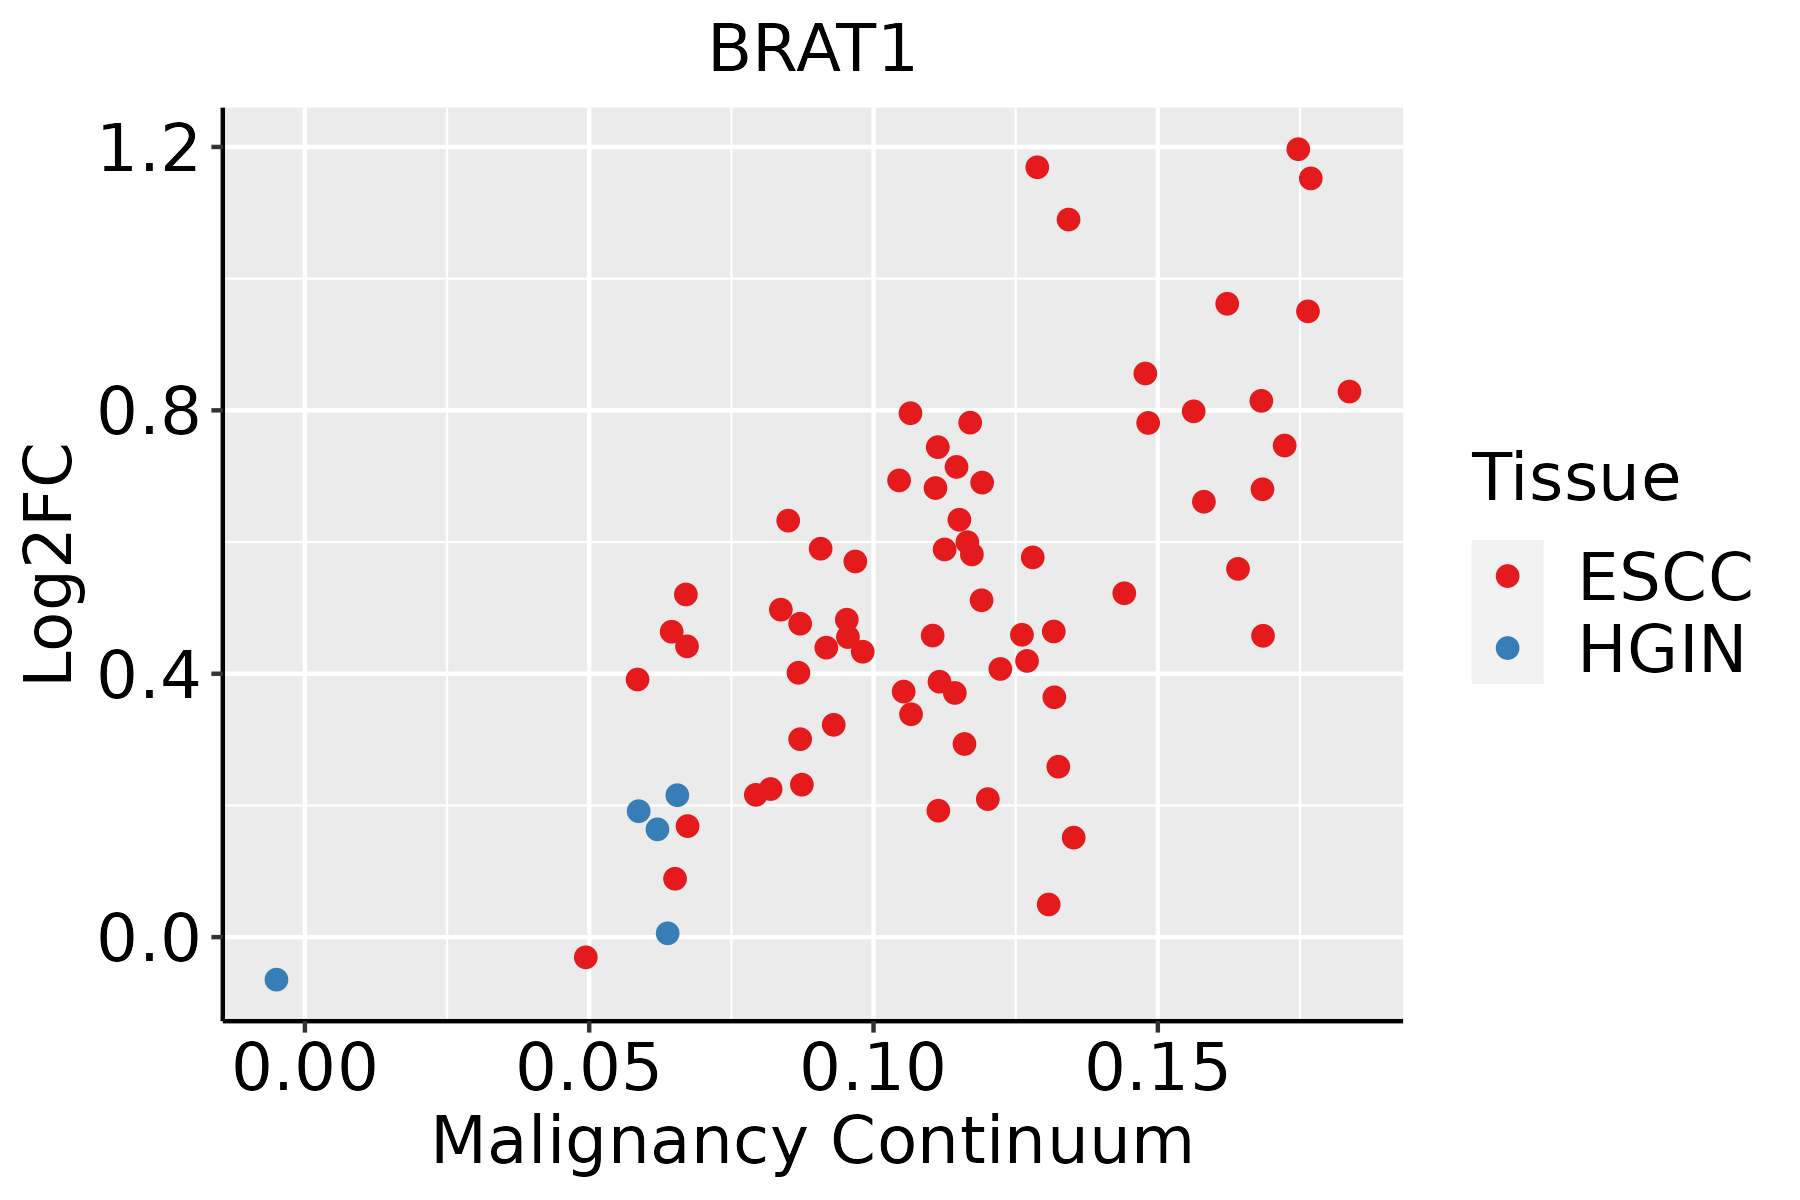 | ESCC: Esophageal squamous cell carcinoma |
| HGIN: High-grade intraepithelial neoplasias | ||
| LGIN: Low-grade intraepithelial neoplasias | ||
| Liver | 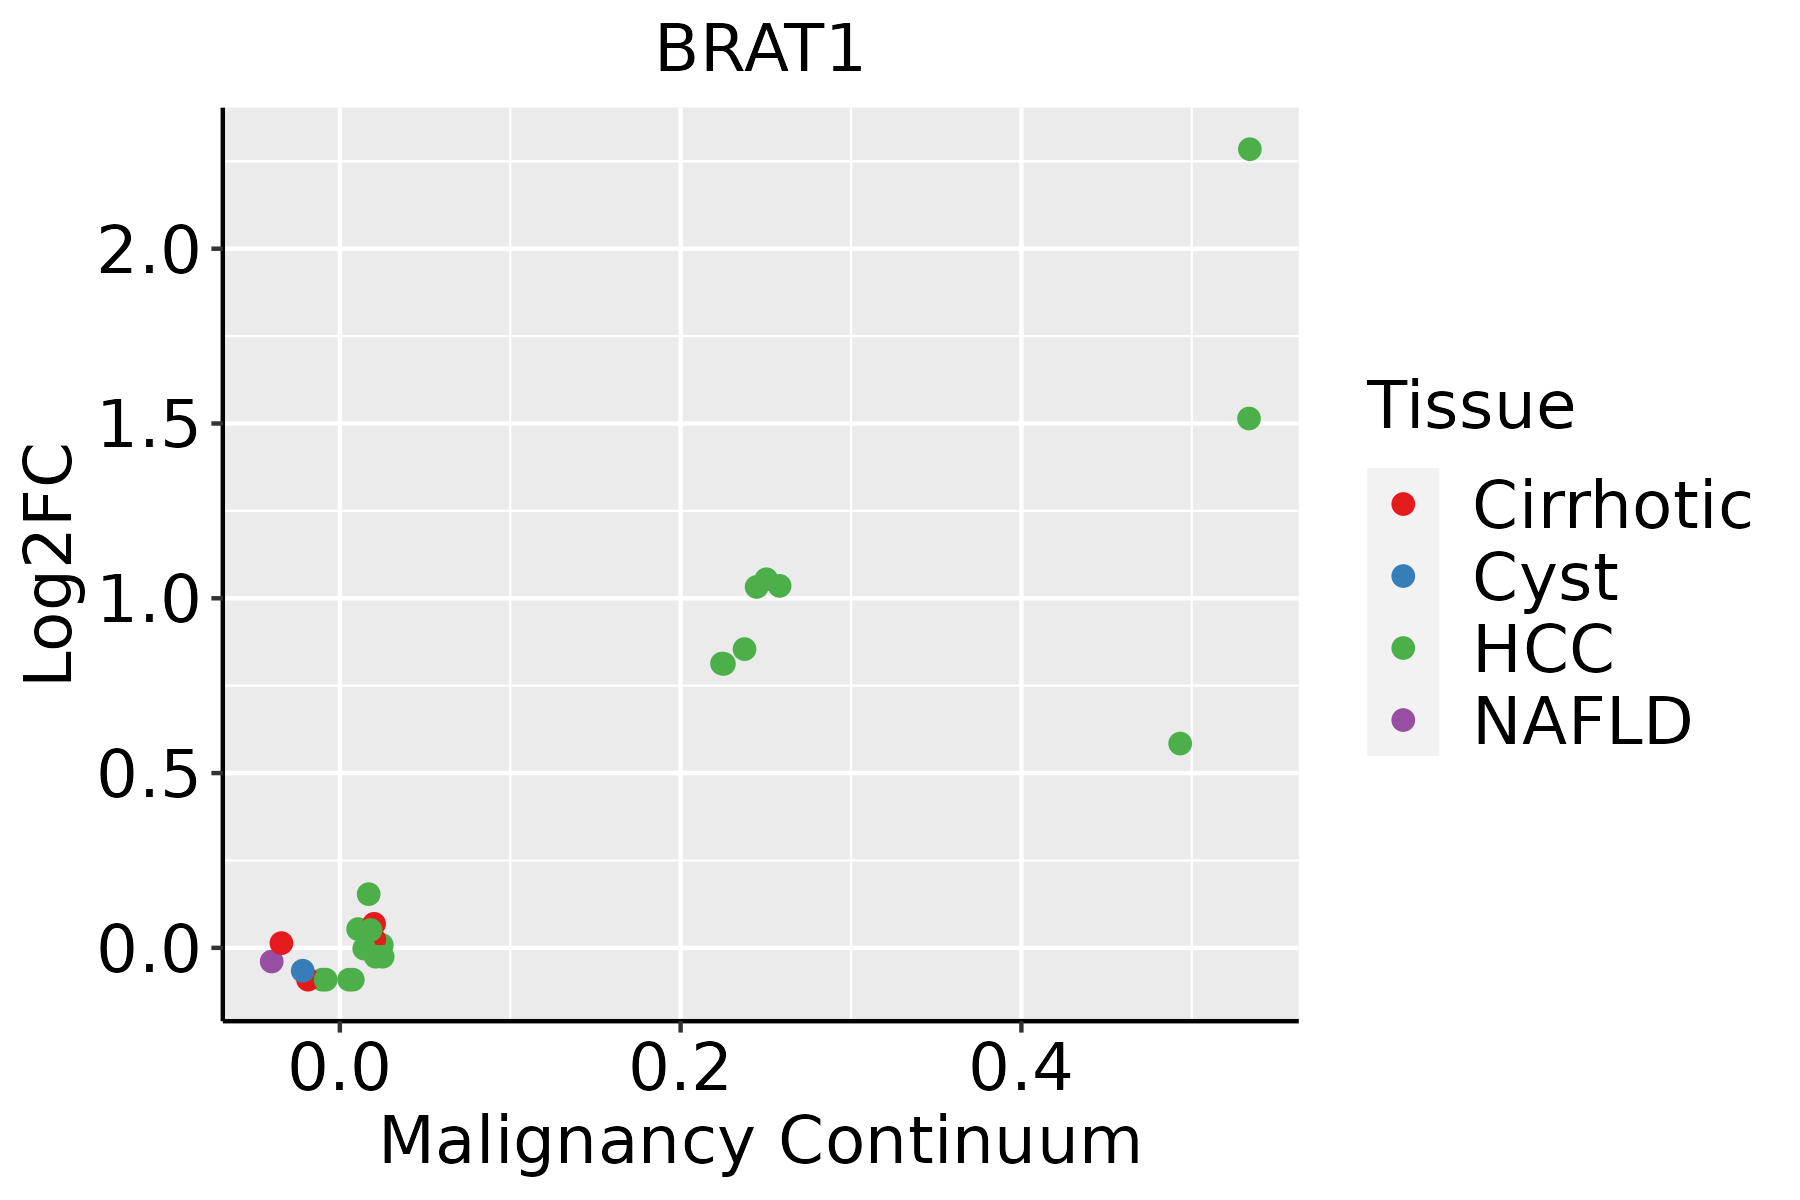 | HCC: Hepatocellular carcinoma |
| NAFLD: Non-alcoholic fatty liver disease | ||
| Oral Cavity |  | EOLP: Erosive Oral lichen planus |
| LP: leukoplakia | ||
| NEOLP: Non-erosive oral lichen planus | ||
| OSCC: Oral squamous cell carcinoma | ||
| Skin | 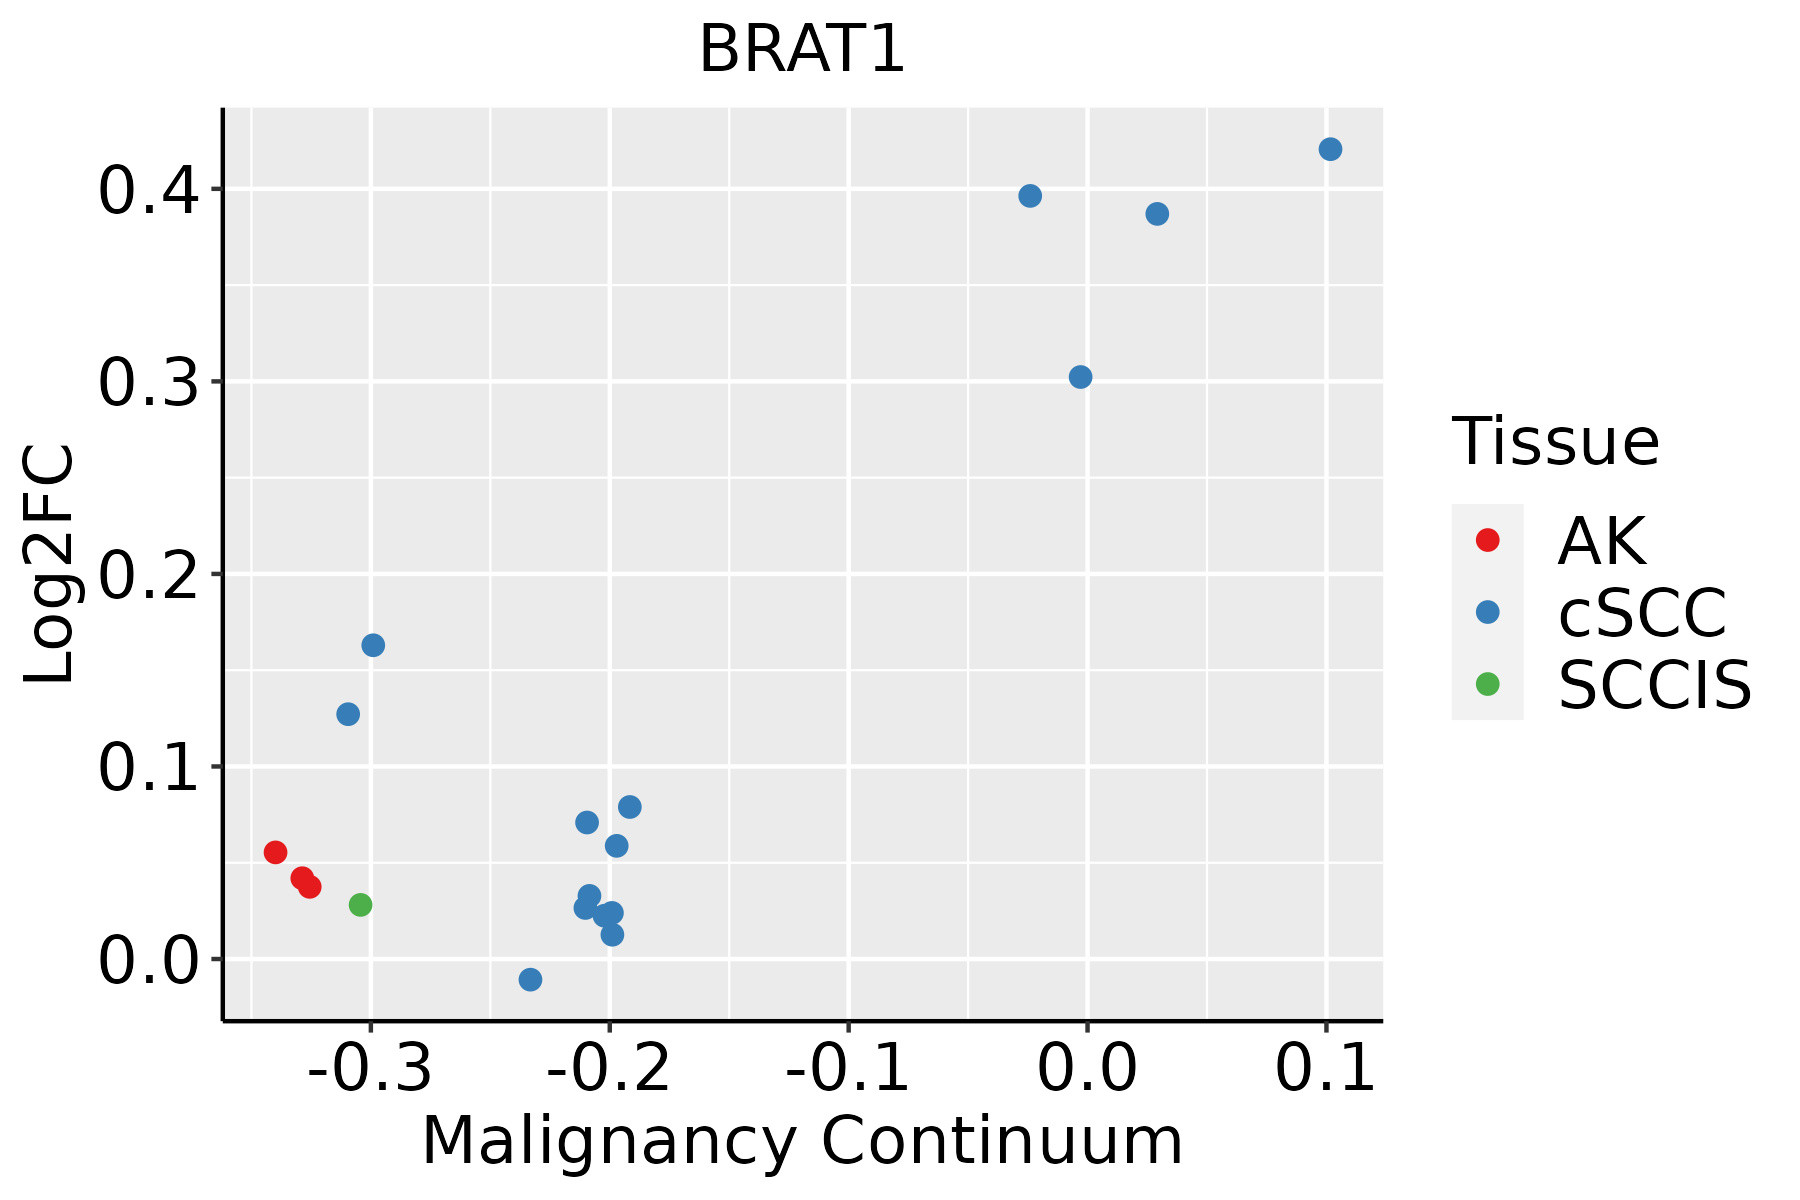 | AK: Actinic keratosis |
| cSCC: Cutaneous squamous cell carcinoma | ||
| SCCIS:squamous cell carcinoma in situ |
| ∗log2FC in expression of this searched gene in stem-like cells from each diseased tissue sample relative to stem-like cells in normal samples in each tissue plotted against the malignancy continuum. Samples are colored based on if they are from different disease stage. |
Top |
Malignant transformation related pathway analysis |
| Find out the enriched GO biological processes and KEGG pathways involved in transition from healthy to precancer to cancer |
| Tissue | Disease Stage | Enriched GO biological Processes |
| Colorectum | AD |  |
| Colorectum | SER |  |
| Colorectum | MSS |  |
| Colorectum | MSI-H |  |
| Colorectum | FAP |  |
| ∗Top 15 enriched GO BP terms are showed in the bar plot of each disease state in each tissue. Each row represents a significant GO biological process which is colored according to the -log10(p.adjust). |
| Page: 1 2 3 4 5 6 7 8 9 |
| GO ID | Tissue | Disease Stage | Description | Gene Ratio | Bg Ratio | pvalue | p.adjust | Count |
| GO:001604919 | Esophagus | HGIN | cell growth | 93/2587 | 482/18723 | 4.49e-04 | 6.62e-03 | 93 |
| GO:000931418 | Esophagus | HGIN | response to radiation | 88/2587 | 456/18723 | 6.26e-04 | 8.65e-03 | 88 |
| GO:00102129 | Esophagus | HGIN | response to ionizing radiation | 33/2587 | 148/18723 | 3.28e-03 | 3.10e-02 | 33 |
| GO:000155818 | Esophagus | HGIN | regulation of cell growth | 76/2587 | 414/18723 | 5.40e-03 | 4.42e-02 | 76 |
| GO:001021217 | Esophagus | ESCC | response to ionizing radiation | 110/8552 | 148/18723 | 1.11e-12 | 4.78e-11 | 110 |
| GO:000931419 | Esophagus | ESCC | response to radiation | 277/8552 | 456/18723 | 4.42e-11 | 1.43e-09 | 277 |
| GO:0016049110 | Esophagus | ESCC | cell growth | 289/8552 | 482/18723 | 1.29e-10 | 3.77e-09 | 289 |
| GO:000155819 | Esophagus | ESCC | regulation of cell growth | 248/8552 | 414/18723 | 2.97e-09 | 6.45e-08 | 248 |
| GO:00059969 | Esophagus | ESCC | monosaccharide metabolic process | 159/8552 | 257/18723 | 1.11e-07 | 1.81e-06 | 159 |
| GO:00193189 | Esophagus | ESCC | hexose metabolic process | 147/8552 | 237/18723 | 2.63e-07 | 3.94e-06 | 147 |
| GO:00060069 | Esophagus | ESCC | glucose metabolic process | 119/8552 | 196/18723 | 1.51e-05 | 1.36e-04 | 119 |
| GO:003030710 | Esophagus | ESCC | positive regulation of cell growth | 100/8552 | 166/18723 | 1.07e-04 | 7.55e-04 | 100 |
| GO:00516463 | Esophagus | ESCC | mitochondrion localization | 35/8552 | 50/18723 | 4.33e-04 | 2.44e-03 | 35 |
| GO:004592717 | Esophagus | ESCC | positive regulation of growth | 137/8552 | 259/18723 | 1.13e-02 | 3.80e-02 | 137 |
| GO:000599621 | Liver | HCC | monosaccharide metabolic process | 167/7958 | 257/18723 | 2.31e-13 | 1.25e-11 | 167 |
| GO:001931821 | Liver | HCC | hexose metabolic process | 155/7958 | 237/18723 | 7.63e-13 | 3.90e-11 | 155 |
| GO:000600621 | Liver | HCC | glucose metabolic process | 128/7958 | 196/18723 | 8.60e-11 | 3.06e-09 | 128 |
| GO:001604921 | Liver | HCC | cell growth | 269/7958 | 482/18723 | 1.84e-09 | 5.35e-08 | 269 |
| GO:000155821 | Liver | HCC | regulation of cell growth | 228/7958 | 414/18723 | 1.34e-07 | 2.55e-06 | 228 |
| GO:001021221 | Liver | HCC | response to ionizing radiation | 89/7958 | 148/18723 | 1.10e-05 | 1.26e-04 | 89 |
| Page: 1 2 3 |
| Pathway ID | Tissue | Disease Stage | Description | Gene Ratio | Bg Ratio | pvalue | p.adjust | qvalue | Count |
| Page: 1 |
Top |
Cell-cell communication analysis |
| Identification of potential cell-cell interactions between two cell types and their ligand-receptor pairs for different disease states |
| Ligand | Receptor | LRpair | Pathway | Tissue | Disease Stage |
| Page: 1 |
Top |
Single-cell gene regulatory network inference analysis |
| Find out the significant the regulons (TFs) and the target genes of each regulon across cell types for different disease states |
| TF | Cell Type | Tissue | Disease Stage | Target Gene | RSS | Regulon Activity |
| ∗The dot plots of a searched regulon are shown for all cell subpopulations in each disease state of each tissue based on the regulon specific score inferred using pySCENIC and by calculating the average expression. |
| Page: 1 |
Top |
Somatic mutation of malignant transformation related genes |
| Annotation of somatic variants for genes involved in malignant transformation |
| Hugo Symbol | Variant Class | Variant Classification | dbSNP RS | HGVSc | HGVSp | HGVSp Short | SWISSPROT | BIOTYPE | SIFT | PolyPhen | Tumor Sample Barcode | Tissue | Histology | Sex | Age | Stage | Therapy Types | Drugs | Outcome |
| BRAT1 | insertion | Frame_Shift_Ins | novel | c.20_21insTTCTTTTGTATTTTTTAATTTCCTGTGCCTTACCT | p.Gln7HisfsTer23 | p.Q7Hfs*23 | Q6PJG6 | protein_coding | TCGA-A8-A0A1-01 | Breast | breast invasive carcinoma | Female | >=65 | I/II | Hormone Therapy | tamoxiphen | SD | ||
| BRAT1 | SNV | Missense_Mutation | novel | c.830G>A | p.Gly277Asp | p.G277D | Q6PJG6 | protein_coding | tolerated(0.23) | benign(0.035) | TCGA-2W-A8YY-01 | Cervix | cervical & endocervical cancer | Female | <65 | I/II | Chemotherapy | cisplatin | CR |
| BRAT1 | SNV | Missense_Mutation | c.773C>T | p.Ser258Leu | p.S258L | Q6PJG6 | protein_coding | tolerated(0.75) | benign(0.089) | TCGA-2W-A8YY-01 | Cervix | cervical & endocervical cancer | Female | <65 | I/II | Chemotherapy | cisplatin | CR | |
| BRAT1 | SNV | Missense_Mutation | rs779338983 | c.541N>A | p.Glu181Lys | p.E181K | Q6PJG6 | protein_coding | tolerated(0.71) | benign(0.001) | TCGA-C5-A3HE-01 | Cervix | cervical & endocervical cancer | Female | <65 | I/II | Unknown | Unknown | PD |
| BRAT1 | SNV | Missense_Mutation | c.214G>A | p.Val72Ile | p.V72I | Q6PJG6 | protein_coding | tolerated(0.91) | benign(0.012) | TCGA-AA-3844-01 | Colorectum | colon adenocarcinoma | Female | >=65 | III/IV | Chemotherapy | capecitabine | PD | |
| BRAT1 | SNV | Missense_Mutation | novel | c.511N>A | p.Val171Ile | p.V171I | Q6PJG6 | protein_coding | tolerated(1) | benign(0) | TCGA-AD-6901-01 | Colorectum | colon adenocarcinoma | Male | >=65 | I/II | Chemotherapy | xeloda | PD |
| BRAT1 | SNV | Missense_Mutation | rs769006340 | c.358N>T | p.Arg120Cys | p.R120C | Q6PJG6 | protein_coding | deleterious(0) | benign(0.07) | TCGA-D5-6927-01 | Colorectum | colon adenocarcinoma | Male | <65 | I/II | Unknown | Unknown | SD |
| BRAT1 | SNV | Missense_Mutation | c.821C>A | p.Ser274Tyr | p.S274Y | Q6PJG6 | protein_coding | tolerated(0.97) | benign(0.003) | TCGA-F5-6814-01 | Colorectum | rectum adenocarcinoma | Male | <65 | I/II | Unknown | Unknown | SD | |
| BRAT1 | SNV | Missense_Mutation | novel | c.209C>A | p.Ser70Tyr | p.S70Y | Q6PJG6 | protein_coding | deleterious(0) | benign(0.172) | TCGA-F5-6814-01 | Colorectum | rectum adenocarcinoma | Male | <65 | I/II | Unknown | Unknown | SD |
| BRAT1 | deletion | In_Frame_Del | rs762488461 | c.2169_2171delNNN | p.Leu724del | p.L724del | Q6PJG6 | protein_coding | TCGA-A6-6649-01 | Colorectum | colon adenocarcinoma | Male | >=65 | III/IV | Chemotherapy | fluorouracil | SD |
| Page: 1 2 3 4 5 6 7 |
Top |
Related drugs of malignant transformation related genes |
| Identification of chemicals and drugs interact with genes involved in malignant transfromation |
| (DGIdb 4.0) |
| Entrez ID | Symbol | Category | Interaction Types | Drug Claim Name | Drug Name | PMIDs |
| Page: 1 |

Copyright 2023-Present -The University of Texas Health Science Center at Houston |