
|
|||||
|
 | |
| |
| |
| |
| |
| |
|
Gene: BNC2 |
Gene summary for BNC2 |
| Gene information | Species | Human | Gene symbol | BNC2 | Gene ID | 54796 |
| Gene name | basonuclin 2 | |
| Gene Alias | BSN2 | |
| Cytomap | 9p22.3-p22.2 | |
| Gene Type | protein-coding | GO ID | GO:0003416 | UniProtAcc | Q5H9S4 |
Top |
Malignant transformation analysis |
| Identification of the aberrant gene expression in precancerous and cancerous lesions by comparing the gene expression of stem-like cells in diseased tissues with normal stem cells |
| Entrez ID | Symbol | Replicates | Species | Organ | Tissue | Adj P-value | Log2FC | Malignancy |
| 54796 | BNC2 | ATC11 | Human | Thyroid | ATC | 2.53e-04 | 6.14e-01 | 0.3386 |
| 54796 | BNC2 | ATC12 | Human | Thyroid | ATC | 9.64e-27 | 5.86e-01 | 0.34 |
| 54796 | BNC2 | ATC13 | Human | Thyroid | ATC | 2.99e-89 | 1.56e+00 | 0.34 |
| 54796 | BNC2 | ATC2 | Human | Thyroid | ATC | 2.43e-04 | 6.43e-01 | 0.34 |
| 54796 | BNC2 | ATC3 | Human | Thyroid | ATC | 6.94e-11 | 7.90e-01 | 0.338 |
| 54796 | BNC2 | ATC4 | Human | Thyroid | ATC | 8.74e-33 | 6.88e-01 | 0.34 |
| 54796 | BNC2 | ATC5 | Human | Thyroid | ATC | 5.99e-91 | 1.64e+00 | 0.34 |
| Page: 1 2 |
| Tissue | Expression Dynamics | Abbreviation |
| Colorectum (GSE201348) |  | FAP: Familial adenomatous polyposis |
| CRC: Colorectal cancer | ||
| Colorectum (HTA11) |  | AD: Adenomas |
| SER: Sessile serrated lesions | ||
| MSI-H: Microsatellite-high colorectal cancer | ||
| MSS: Microsatellite stable colorectal cancer | ||
| Endometrium |  | AEH: Atypical endometrial hyperplasia |
| EEC: Endometrioid Cancer | ||
| Esophagus | 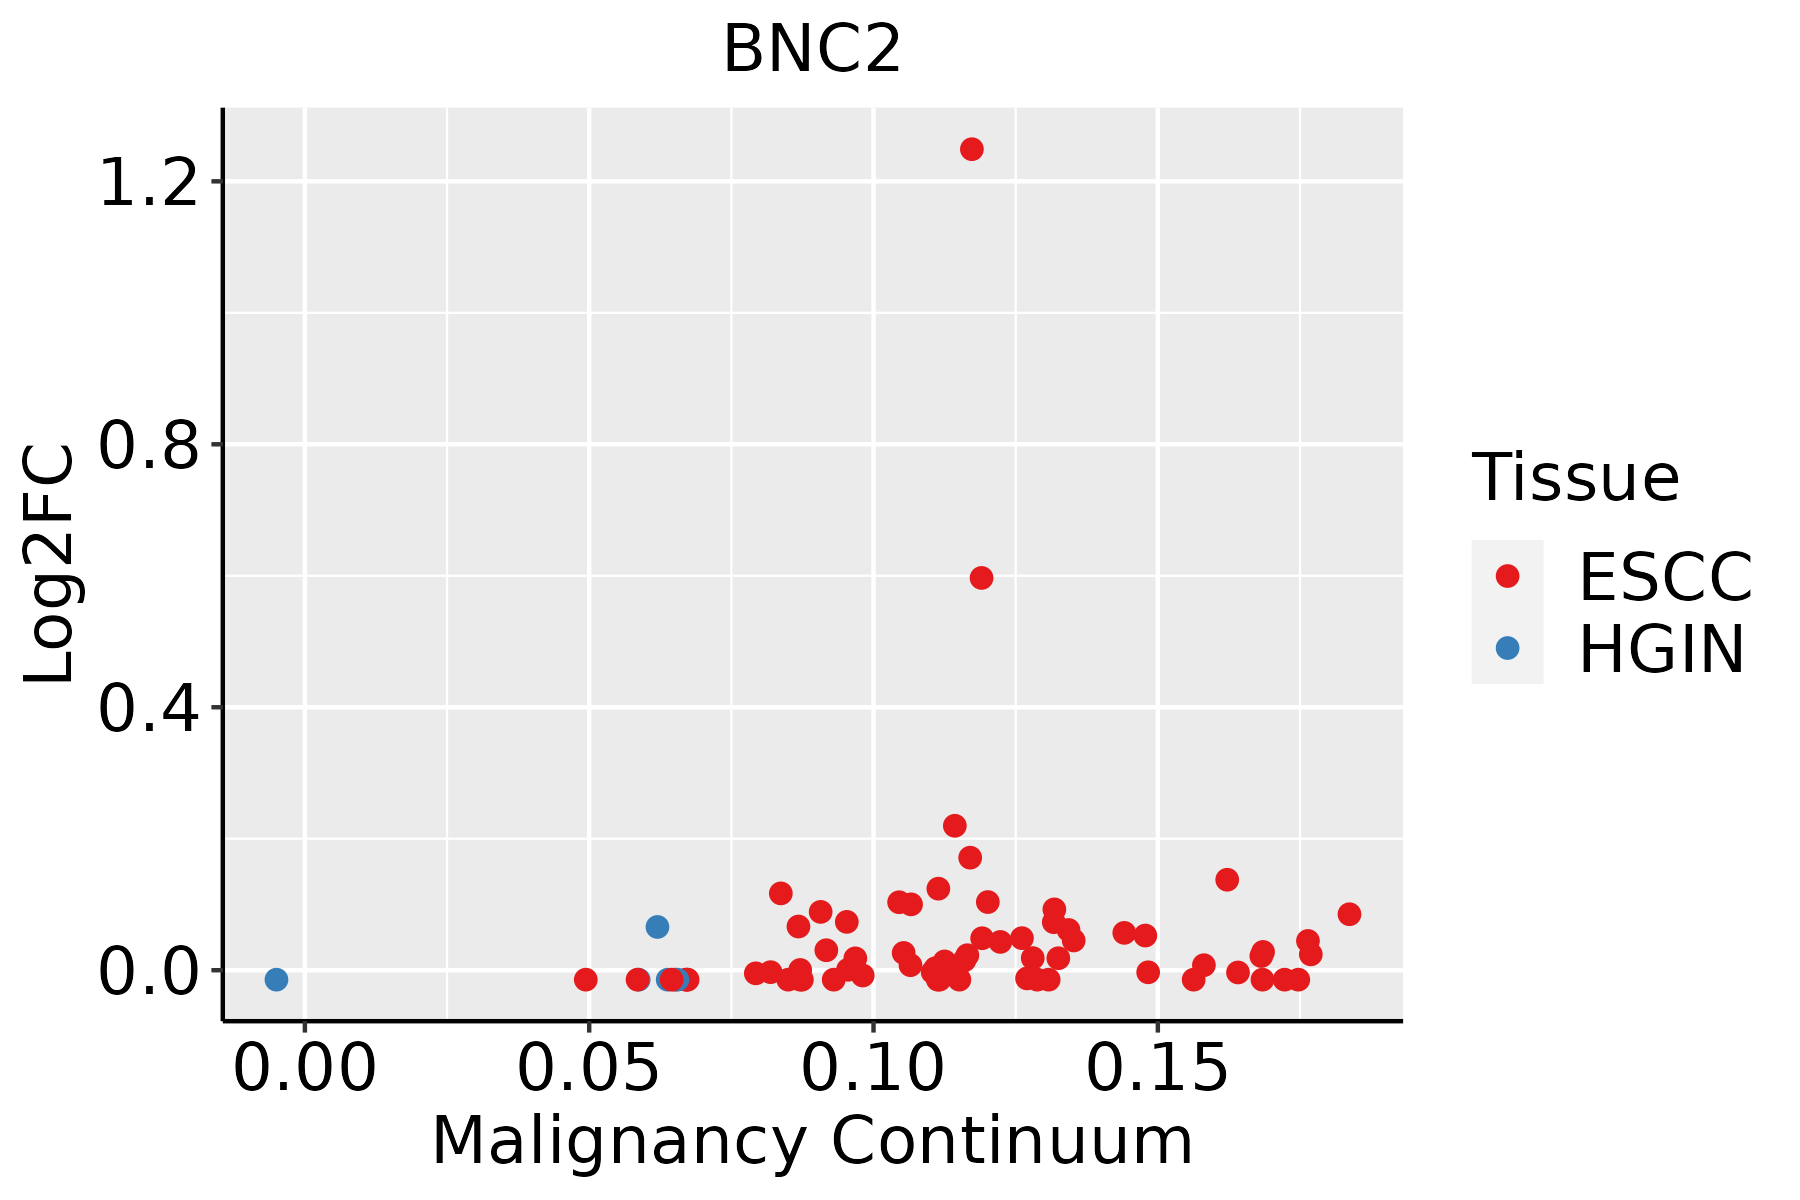 | ESCC: Esophageal squamous cell carcinoma |
| HGIN: High-grade intraepithelial neoplasias | ||
| LGIN: Low-grade intraepithelial neoplasias | ||
| Skin | 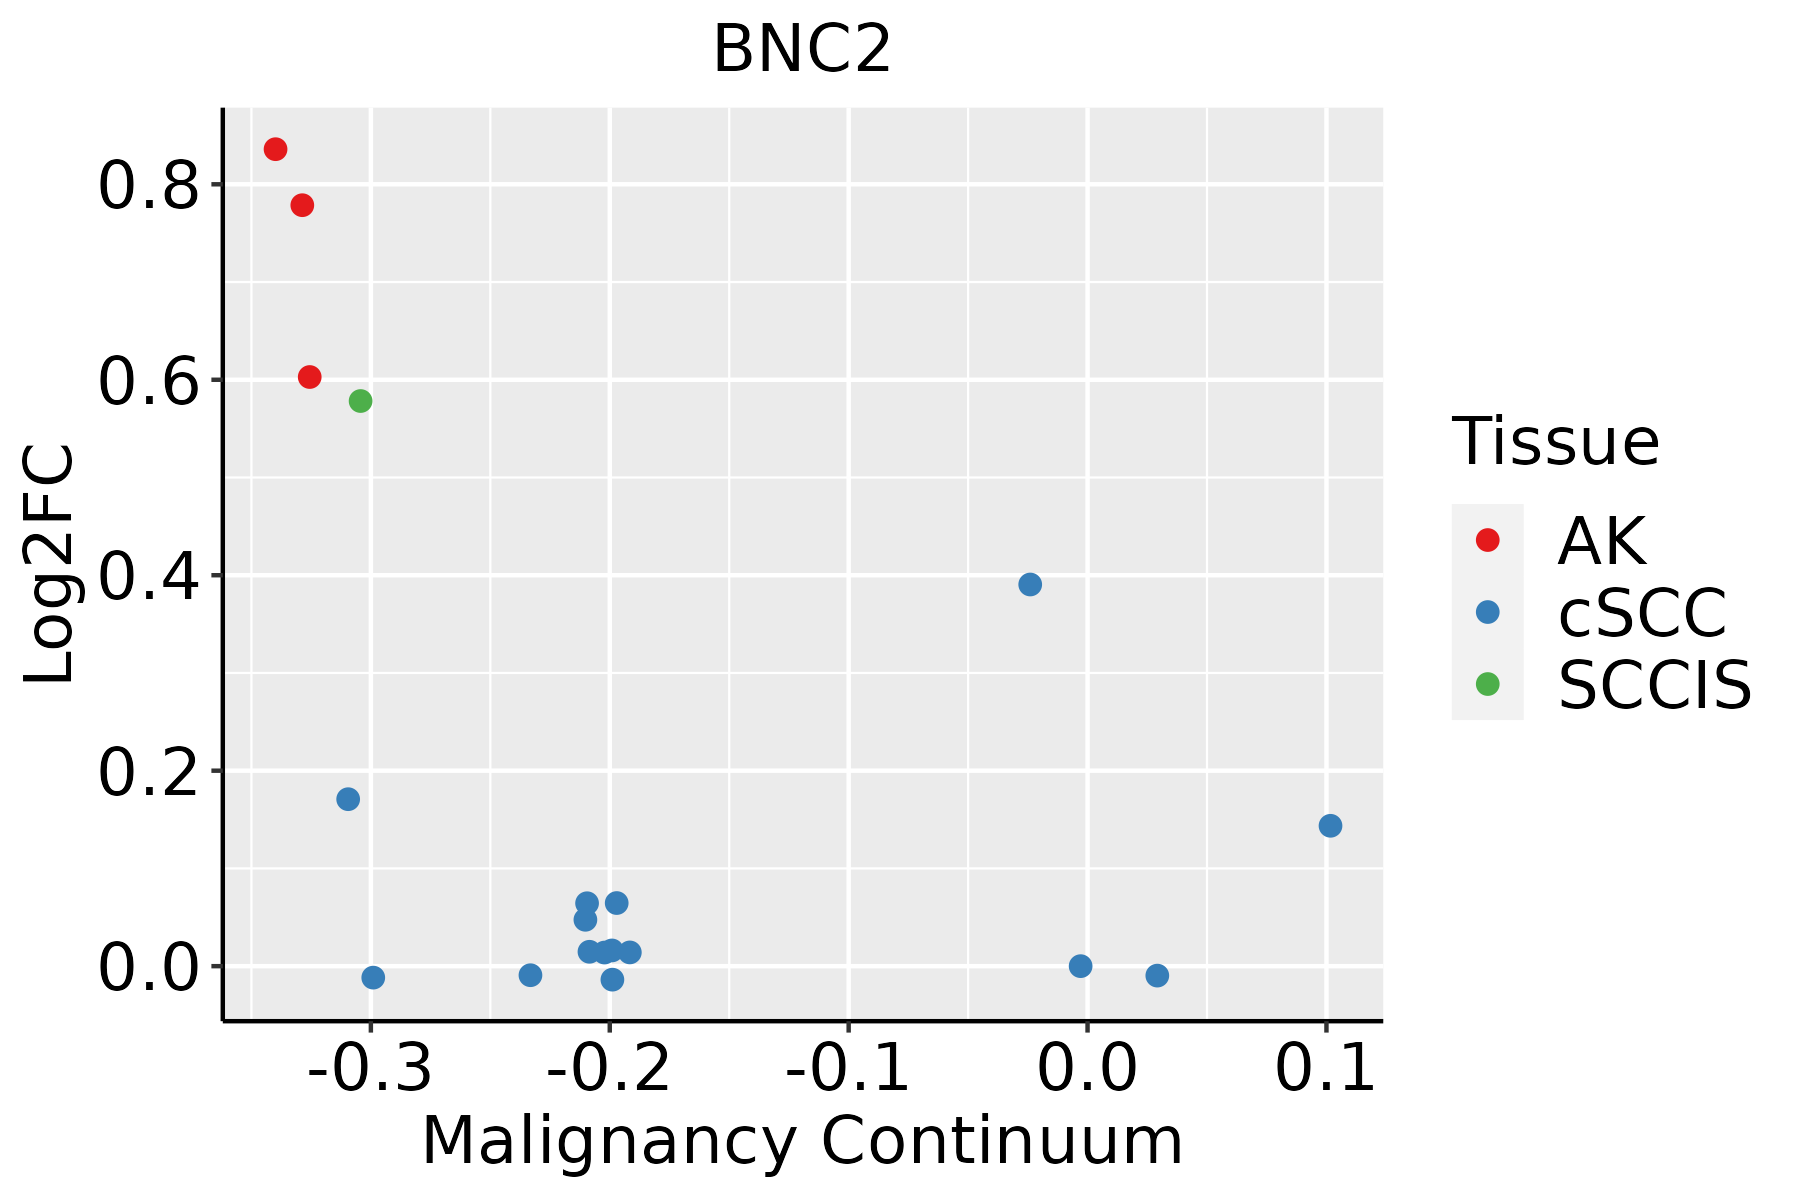 | AK: Actinic keratosis |
| cSCC: Cutaneous squamous cell carcinoma | ||
| SCCIS:squamous cell carcinoma in situ | ||
| Thyroid | 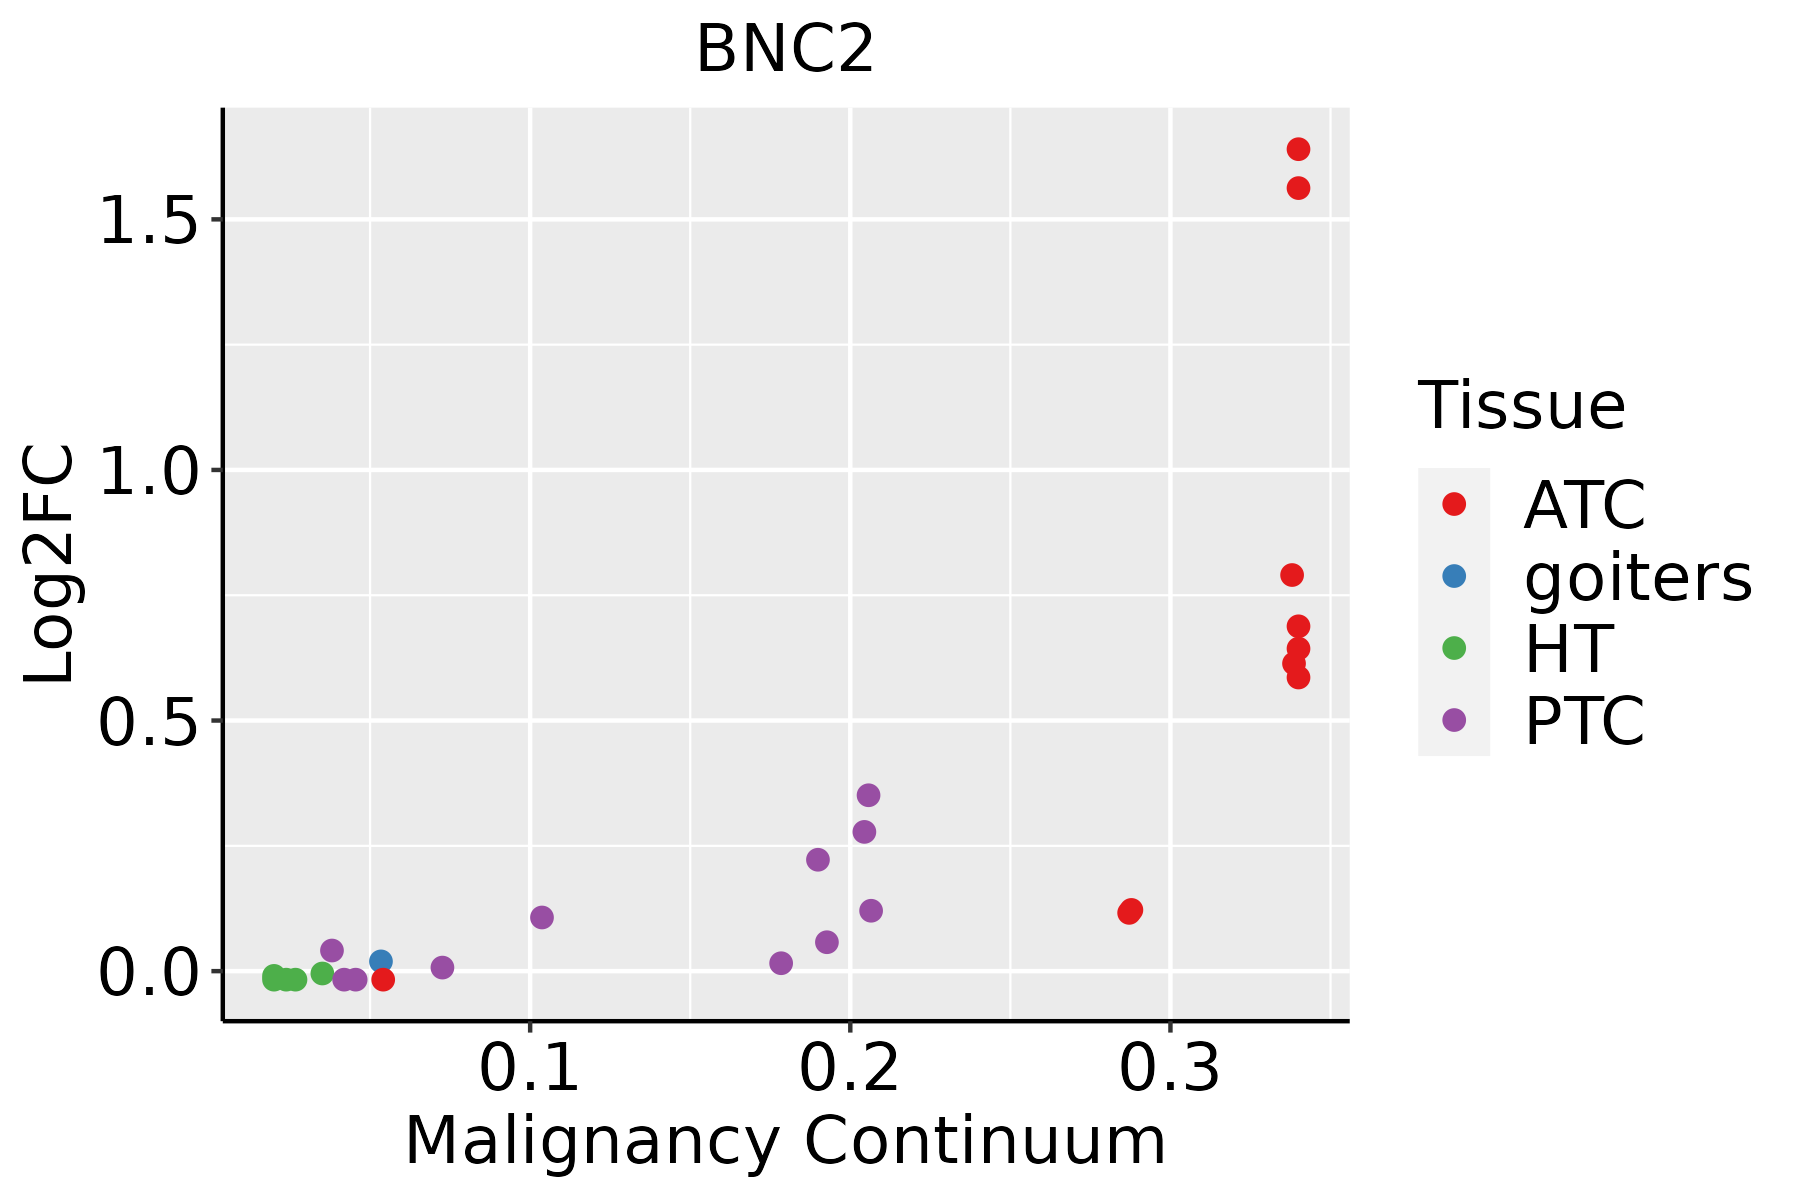 | ATC: Anaplastic thyroid cancer |
| HT: Hashimoto's thyroiditis | ||
| PTC: Papillary thyroid cancer |
| ∗log2FC in expression of this searched gene in stem-like cells from each diseased tissue sample relative to stem-like cells in normal samples in each tissue plotted against the malignancy continuum. Samples are colored based on if they are from different disease stage. |
Top |
Malignant transformation related pathway analysis |
| Find out the enriched GO biological processes and KEGG pathways involved in transition from healthy to precancer to cancer |
| Tissue | Disease Stage | Enriched GO biological Processes |
| Colorectum | AD |  |
| Colorectum | SER |  |
| Colorectum | MSS |  |
| Colorectum | MSI-H |  |
| Colorectum | FAP |  |
| ∗Top 15 enriched GO BP terms are showed in the bar plot of each disease state in each tissue. Each row represents a significant GO biological process which is colored according to the -log10(p.adjust). |
| Page: 1 2 3 4 5 6 7 8 9 |
| GO ID | Tissue | Disease Stage | Description | Gene Ratio | Bg Ratio | pvalue | p.adjust | Count |
| GO:0060485 | Colorectum | FAP | mesenchyme development | 59/2622 | 291/18723 | 1.94e-03 | 1.64e-02 | 59 |
| GO:00604856 | Esophagus | ESCC | mesenchyme development | 156/8552 | 291/18723 | 3.76e-03 | 1.53e-02 | 156 |
| GO:0003416 | Esophagus | ESCC | endochondral bone growth | 19/8552 | 26/18723 | 4.31e-03 | 1.71e-02 | 19 |
| GO:0060021 | Esophagus | ESCC | roof of mouth development | 50/8552 | 85/18723 | 1.00e-02 | 3.42e-02 | 50 |
| GO:00604857 | Skin | AK | mesenchyme development | 48/1910 | 291/18723 | 5.64e-04 | 5.06e-03 | 48 |
| GO:00352653 | Skin | AK | organ growth | 29/1910 | 178/18723 | 7.57e-03 | 3.86e-02 | 29 |
| GO:003526512 | Skin | SCCIS | organ growth | 17/919 | 178/18723 | 6.73e-03 | 4.96e-02 | 17 |
| GO:006048514 | Thyroid | PTC | mesenchyme development | 112/5968 | 291/18723 | 9.48e-03 | 3.90e-02 | 112 |
| GO:006048521 | Thyroid | ATC | mesenchyme development | 136/6293 | 291/18723 | 2.04e-06 | 2.43e-05 | 136 |
| GO:00600211 | Thyroid | ATC | roof of mouth development | 42/6293 | 85/18723 | 1.83e-03 | 9.02e-03 | 42 |
| GO:00352654 | Thyroid | ATC | organ growth | 77/6293 | 178/18723 | 4.45e-03 | 1.85e-02 | 77 |
| GO:00034161 | Thyroid | ATC | endochondral bone growth | 15/6293 | 26/18723 | 9.95e-03 | 3.63e-02 | 15 |
| GO:0098868 | Thyroid | ATC | bone growth | 16/6293 | 29/18723 | 1.37e-02 | 4.77e-02 | 16 |
| Page: 1 |
| Pathway ID | Tissue | Disease Stage | Description | Gene Ratio | Bg Ratio | pvalue | p.adjust | qvalue | Count |
| Page: 1 |
Top |
Cell-cell communication analysis |
| Identification of potential cell-cell interactions between two cell types and their ligand-receptor pairs for different disease states |
| Ligand | Receptor | LRpair | Pathway | Tissue | Disease Stage |
| Page: 1 |
Top |
Single-cell gene regulatory network inference analysis |
| Find out the significant the regulons (TFs) and the target genes of each regulon across cell types for different disease states |
| TF | Cell Type | Tissue | Disease Stage | Target Gene | RSS | Regulon Activity |
| BNC2 | FIB | Endometrium | ADJ | MIR99AHG,HTRA1,CCDC171, etc. | 2.13e-02 |  |
| BNC2 | MSC.MVA | Oral cavity | ADJ | GPC6,CSMD2,CHSY1, etc. | 6.07e-03 |  |
| BNC2 | CAF | Oral cavity | EOLP | GPC6,CSMD2,CHSY1, etc. | 1.15e-01 |  |
| BNC2 | MSC.MVA | Oral cavity | Healthy | GPC6,CSMD2,CHSY1, etc. | 2.80e-03 |  |
| BNC2 | MYOFIB | Oral cavity | Healthy | GPC6,CSMD2,CHSY1, etc. | 3.46e-04 | |
| BNC2 | ICAF | Oral cavity | Healthy | GPC6,CSMD2,CHSY1, etc. | 4.44e-16 | |
| ∗The dot plots of a searched regulon are shown for all cell subpopulations in each disease state of each tissue based on the regulon specific score inferred using pySCENIC and by calculating the average expression. |
| Page: 1 |
Top |
Somatic mutation of malignant transformation related genes |
| Annotation of somatic variants for genes involved in malignant transformation |
| Hugo Symbol | Variant Class | Variant Classification | dbSNP RS | HGVSc | HGVSp | HGVSp Short | SWISSPROT | BIOTYPE | SIFT | PolyPhen | Tumor Sample Barcode | Tissue | Histology | Sex | Age | Stage | Therapy Types | Drugs | Outcome |
| BNC2 | SNV | Missense_Mutation | novel | c.425N>G | p.Val142Gly | p.V142G | Q6ZN30 | protein_coding | deleterious(0) | probably_damaging(0.969) | TCGA-A2-A0CS-01 | Breast | breast invasive carcinoma | Female | >=65 | III/IV | Hormone Therapy | anastrozole | SD |
| BNC2 | SNV | Missense_Mutation | novel | c.425N>G | p.Val142Gly | p.V142G | Q6ZN30 | protein_coding | deleterious(0) | probably_damaging(0.969) | TCGA-A8-A0A6-01 | Breast | breast invasive carcinoma | Female | <65 | III/IV | Chemotherapy | epirubicin | CR |
| BNC2 | SNV | Missense_Mutation | novel | c.598N>C | p.Glu200Gln | p.E200Q | Q6ZN30 | protein_coding | deleterious(0.01) | possibly_damaging(0.71) | TCGA-AC-A8OS-01 | Breast | breast invasive carcinoma | Female | >=65 | I/II | Unknown | Unknown | SD |
| BNC2 | SNV | Missense_Mutation | novel | c.3265N>T | p.Leu1089Phe | p.L1089F | Q6ZN30 | protein_coding | deleterious(0.01) | probably_damaging(0.991) | TCGA-AN-A046-01 | Breast | breast invasive carcinoma | Female | >=65 | I/II | Unknown | Unknown | SD |
| BNC2 | SNV | Missense_Mutation | c.2918G>A | p.Ser973Asn | p.S973N | Q6ZN30 | protein_coding | deleterious(0.03) | probably_damaging(0.968) | TCGA-AR-A0TT-01 | Breast | breast invasive carcinoma | Female | <65 | III/IV | Chemotherapy | doxorubicin | SD | |
| BNC2 | SNV | Missense_Mutation | c.2676G>C | p.Leu892Phe | p.L892F | Q6ZN30 | protein_coding | deleterious(0) | possibly_damaging(0.637) | TCGA-AR-A1AR-01 | Breast | breast invasive carcinoma | Female | <65 | III/IV | Unspecific | Docetaxel | PD | |
| BNC2 | SNV | Missense_Mutation | c.601N>A | p.Glu201Lys | p.E201K | Q6ZN30 | protein_coding | deleterious(0) | possibly_damaging(0.696) | TCGA-AR-A24W-01 | Breast | breast invasive carcinoma | Female | <65 | I/II | Hormone Therapy | letrozole | SD | |
| BNC2 | SNV | Missense_Mutation | novel | c.895G>A | p.Ala299Thr | p.A299T | Q6ZN30 | protein_coding | tolerated(0.74) | benign(0.001) | TCGA-AR-A5QQ-01 | Breast | breast invasive carcinoma | Female | >=65 | III/IV | Chemotherapy | carboplatin | PD |
| BNC2 | SNV | Missense_Mutation | novel | c.425N>G | p.Val142Gly | p.V142G | Q6ZN30 | protein_coding | deleterious(0) | probably_damaging(0.969) | TCGA-BH-A0BR-01 | Breast | breast invasive carcinoma | Female | <65 | I/II | Unknown | Unknown | SD |
| BNC2 | SNV | Missense_Mutation | c.1972N>A | p.Asp658Asn | p.D658N | Q6ZN30 | protein_coding | deleterious(0.04) | benign(0.166) | TCGA-BH-A18U-01 | Breast | breast invasive carcinoma | Female | >=65 | III/IV | Unknown | Unknown | SD |
| Page: 1 2 3 4 5 6 7 8 9 10 11 12 13 14 15 16 17 18 19 20 21 22 23 |
Top |
Related drugs of malignant transformation related genes |
| Identification of chemicals and drugs interact with genes involved in malignant transfromation |
| (DGIdb 4.0) |
| Entrez ID | Symbol | Category | Interaction Types | Drug Claim Name | Drug Name | PMIDs |
| Page: 1 |

Copyright 2023-Present -The University of Texas Health Science Center at Houston |