
|
|||||
|
 | |
| |
| |
| |
| |
| |
|
Gene: BNC1 |
Gene summary for BNC1 |
| Gene information | Species | Human | Gene symbol | BNC1 | Gene ID | 646 |
| Gene name | basonuclin 1 | |
| Gene Alias | BNC | |
| Cytomap | 15q25.2 | |
| Gene Type | protein-coding | GO ID | GO:0000003 | UniProtAcc | B7Z885 |
Top |
Malignant transformation analysis |
| Identification of the aberrant gene expression in precancerous and cancerous lesions by comparing the gene expression of stem-like cells in diseased tissues with normal stem cells |
| Entrez ID | Symbol | Replicates | Species | Organ | Tissue | Adj P-value | Log2FC | Malignancy |
| 646 | BNC1 | SYSMH3 | Human | Oral cavity | OSCC | 1.20e-29 | 7.99e-01 | 0.2442 |
| 646 | BNC1 | SYSMH5 | Human | Oral cavity | OSCC | 8.01e-11 | 3.01e-01 | 0.0647 |
| 646 | BNC1 | P4_S8_cSCC | Human | Skin | cSCC | 4.27e-04 | 1.77e-01 | -0.3095 |
| 646 | BNC1 | P5_S10_cSCC | Human | Skin | cSCC | 2.09e-05 | 1.58e-01 | -0.299 |
| 646 | BNC1 | P1_cSCC | Human | Skin | cSCC | 5.19e-27 | 8.61e-01 | 0.0292 |
| 646 | BNC1 | P2_cSCC | Human | Skin | cSCC | 7.07e-08 | 3.67e-01 | -0.024 |
| 646 | BNC1 | P4_cSCC | Human | Skin | cSCC | 1.23e-18 | 5.98e-01 | -0.00290000000000005 |
| 646 | BNC1 | P10_cSCC | Human | Skin | cSCC | 1.17e-36 | 1.18e+00 | 0.1017 |
| Page: 1 2 |
| Tissue | Expression Dynamics | Abbreviation |
| Cervix |  | CC: Cervix cancer |
| HSIL_HPV: HPV-infected high-grade squamous intraepithelial lesions | ||
| N_HPV: HPV-infected normal cervix | ||
| Oral Cavity | 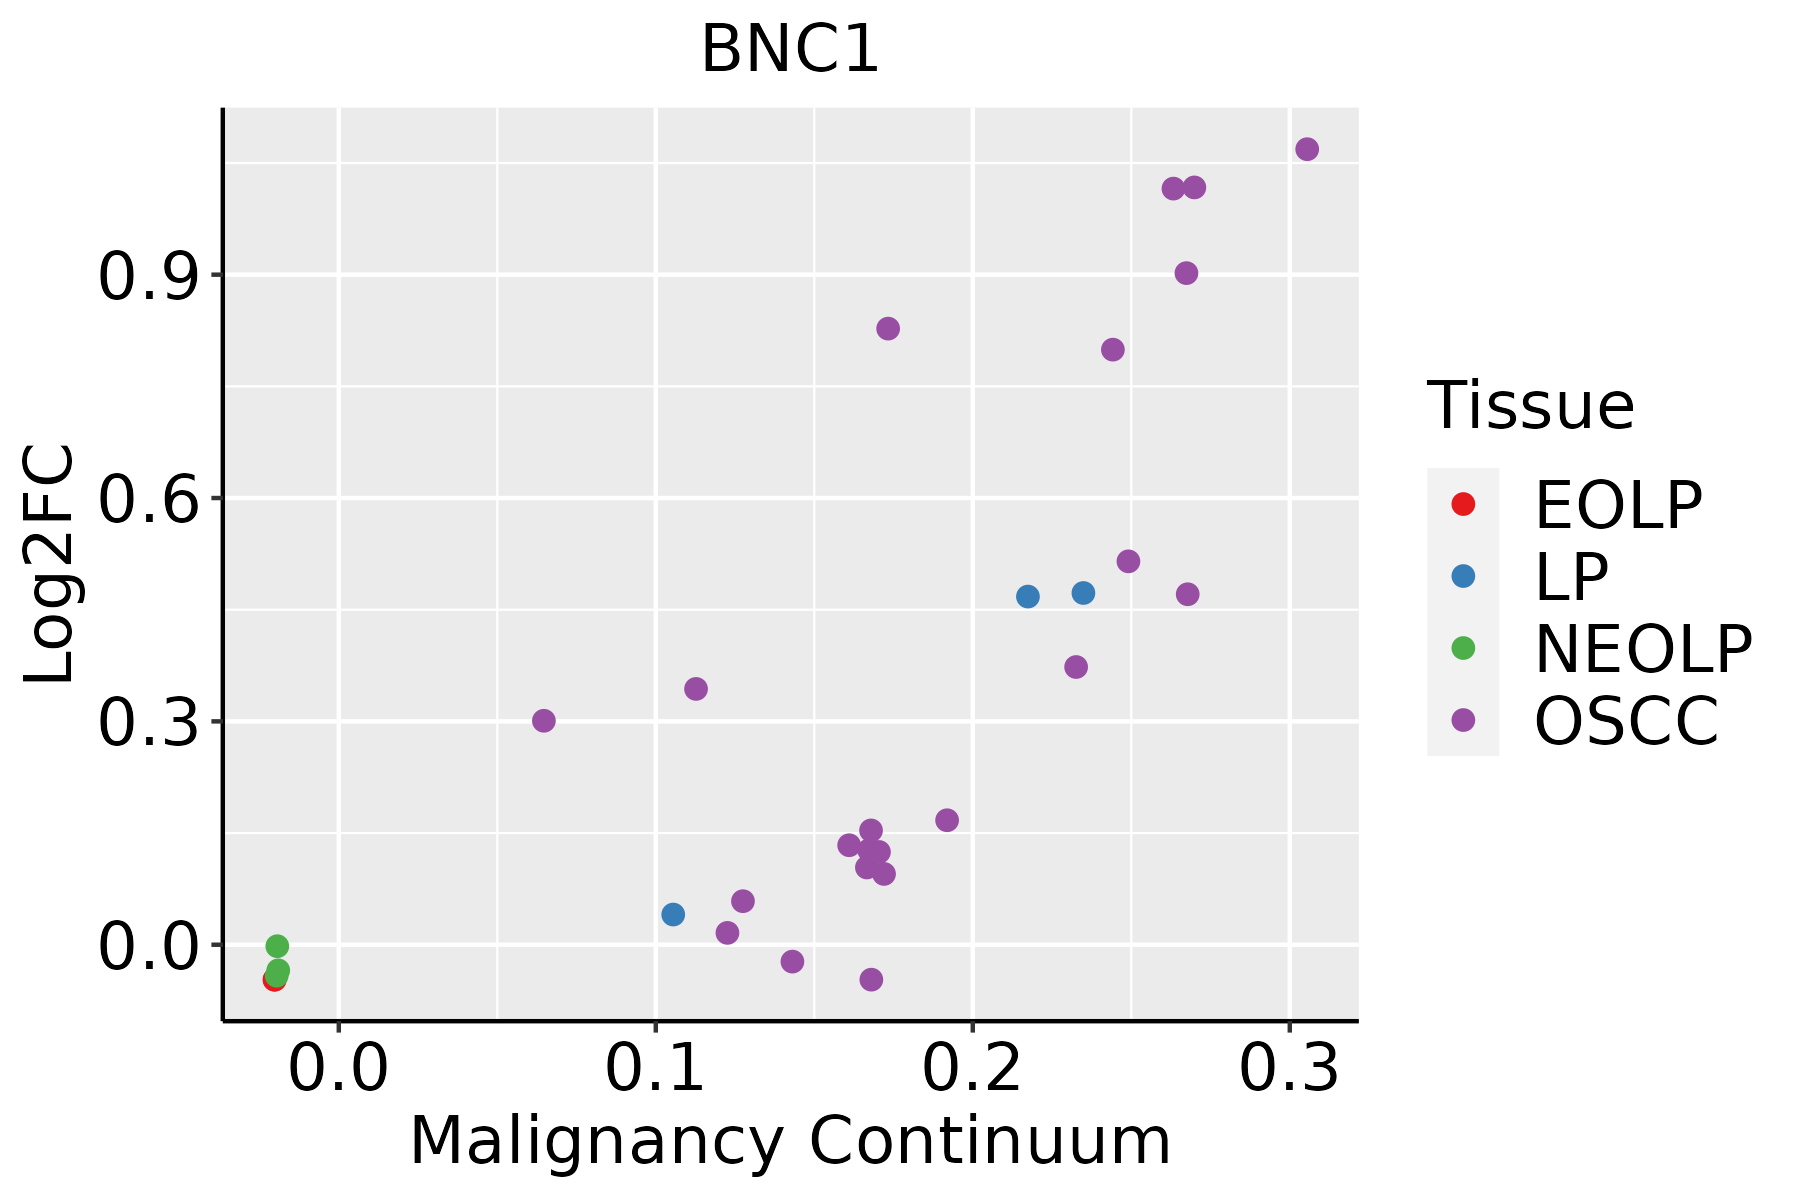 | EOLP: Erosive Oral lichen planus |
| LP: leukoplakia | ||
| NEOLP: Non-erosive oral lichen planus | ||
| OSCC: Oral squamous cell carcinoma | ||
| Skin | 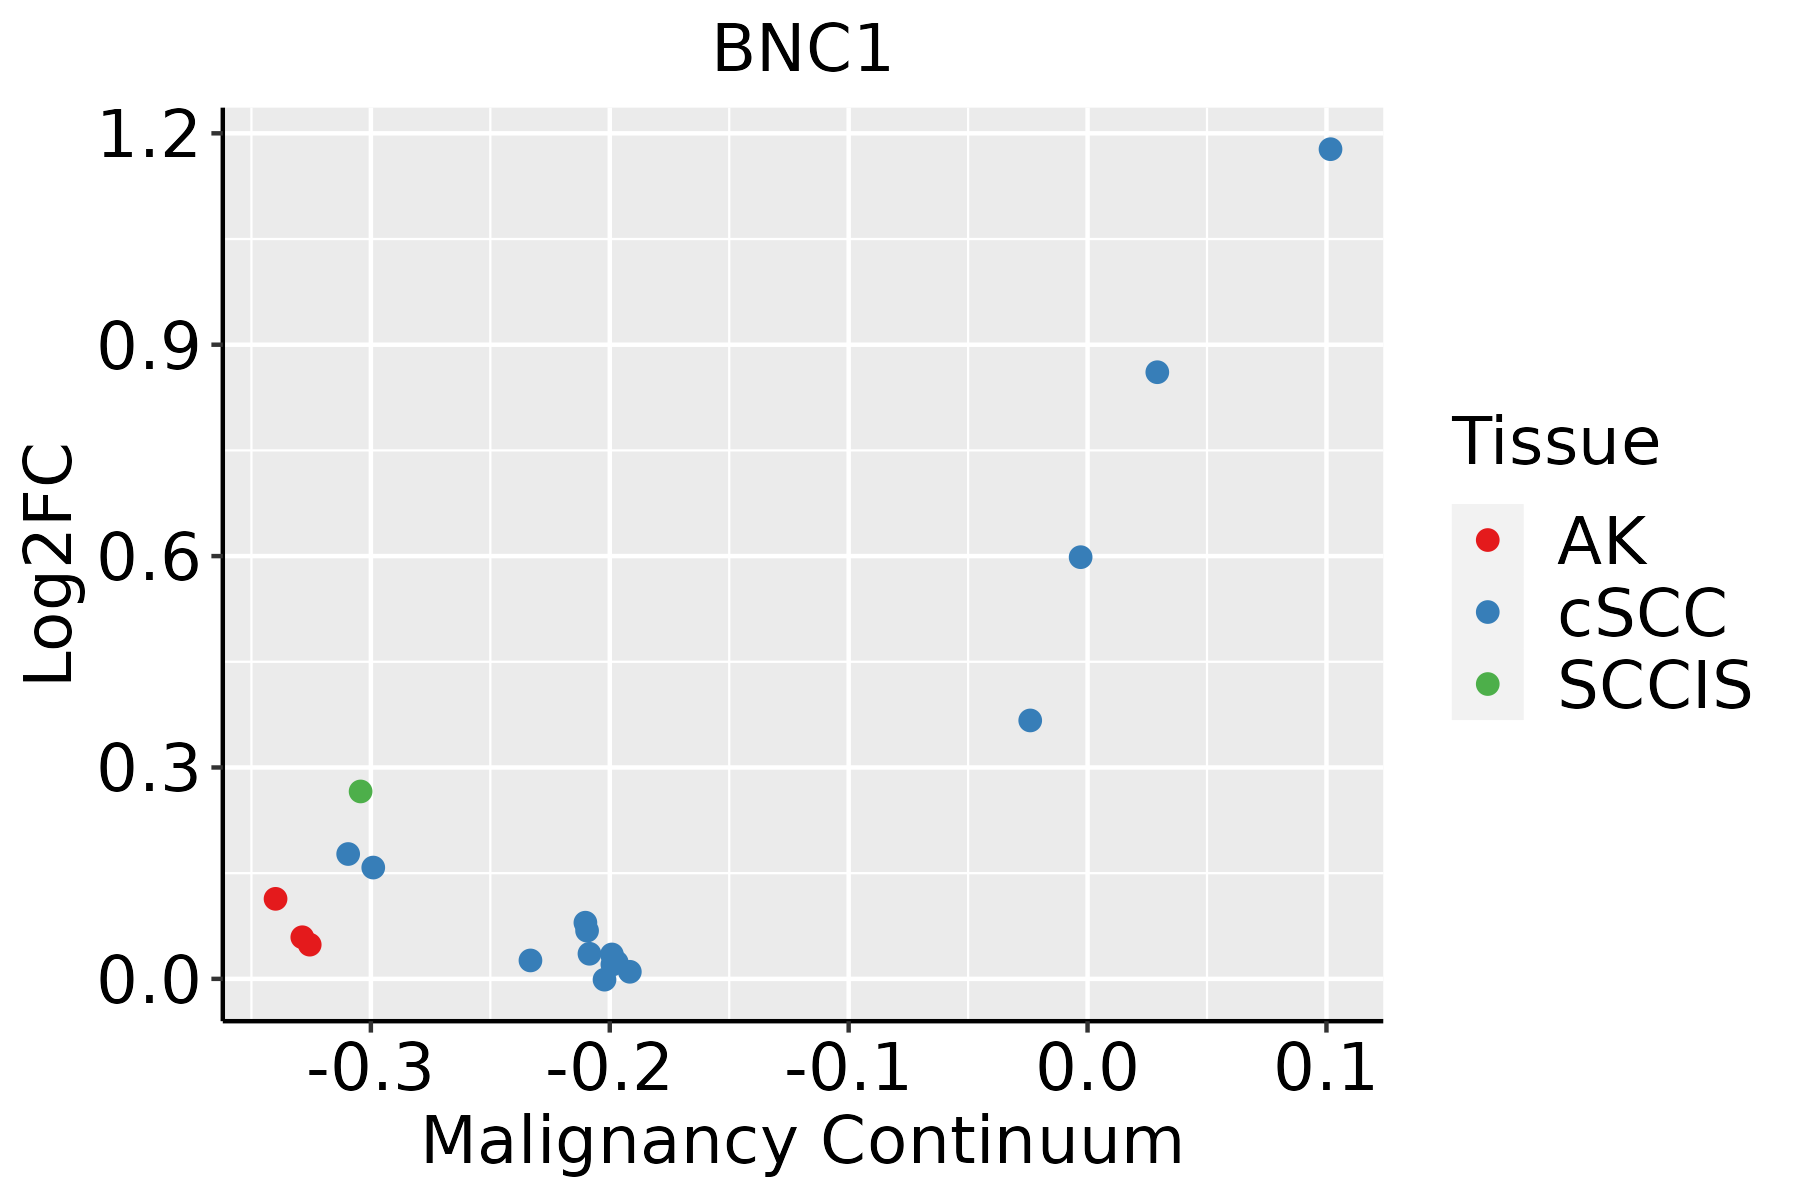 | AK: Actinic keratosis |
| cSCC: Cutaneous squamous cell carcinoma | ||
| SCCIS:squamous cell carcinoma in situ |
| ∗log2FC in expression of this searched gene in stem-like cells from each diseased tissue sample relative to stem-like cells in normal samples in each tissue plotted against the malignancy continuum. Samples are colored based on if they are from different disease stage. |
Top |
Malignant transformation related pathway analysis |
| Find out the enriched GO biological processes and KEGG pathways involved in transition from healthy to precancer to cancer |
| Tissue | Disease Stage | Enriched GO biological Processes |
| Colorectum | AD |  |
| Colorectum | SER |  |
| Colorectum | MSS |  |
| Colorectum | MSI-H |  |
| Colorectum | FAP |  |
| ∗Top 15 enriched GO BP terms are showed in the bar plot of each disease state in each tissue. Each row represents a significant GO biological process which is colored according to the -log10(p.adjust). |
| Page: 1 2 3 4 5 6 7 8 9 |
| GO ID | Tissue | Disease Stage | Description | Gene Ratio | Bg Ratio | pvalue | p.adjust | Count |
| GO:00085446 | Cervix | CC | epidermis development | 83/2311 | 324/18723 | 3.91e-11 | 8.54e-09 | 83 |
| GO:00107206 | Cervix | CC | positive regulation of cell development | 64/2311 | 298/18723 | 5.69e-06 | 1.41e-04 | 64 |
| GO:00085449 | Oral cavity | OSCC | epidermis development | 171/7305 | 324/18723 | 2.89e-07 | 4.43e-06 | 171 |
| GO:00107209 | Oral cavity | OSCC | positive regulation of cell development | 159/7305 | 298/18723 | 3.06e-07 | 4.66e-06 | 159 |
| GO:00063563 | Oral cavity | OSCC | regulation of transcription by RNA polymerase I | 25/7305 | 34/18723 | 4.63e-05 | 3.90e-04 | 25 |
| GO:00063601 | Oral cavity | OSCC | transcription by RNA polymerase I | 36/7305 | 55/18723 | 6.42e-05 | 5.22e-04 | 36 |
| GO:00459431 | Oral cavity | OSCC | positive regulation of transcription by RNA polymerase I | 18/7305 | 23/18723 | 1.47e-04 | 1.04e-03 | 18 |
| GO:000854416 | Oral cavity | LP | epidermis development | 112/4623 | 324/18723 | 3.81e-05 | 5.61e-04 | 112 |
| GO:001072014 | Oral cavity | LP | positive regulation of cell development | 93/4623 | 298/18723 | 6.07e-03 | 3.60e-02 | 93 |
| GO:000854425 | Skin | cSCC | epidermis development | 131/4864 | 324/18723 | 7.38e-09 | 2.39e-07 | 131 |
| GO:00063565 | Skin | cSCC | regulation of transcription by RNA polymerase I | 22/4864 | 34/18723 | 2.33e-06 | 3.77e-05 | 22 |
| GO:00063603 | Skin | cSCC | transcription by RNA polymerase I | 30/4864 | 55/18723 | 6.13e-06 | 8.70e-05 | 30 |
| GO:00459433 | Skin | cSCC | positive regulation of transcription by RNA polymerase I | 15/4864 | 23/18723 | 8.72e-05 | 8.21e-04 | 15 |
| GO:001072016 | Skin | cSCC | positive regulation of cell development | 105/4864 | 298/18723 | 2.30e-04 | 1.89e-03 | 105 |
| Page: 1 |
| Pathway ID | Tissue | Disease Stage | Description | Gene Ratio | Bg Ratio | pvalue | p.adjust | qvalue | Count |
| Page: 1 |
Top |
Cell-cell communication analysis |
| Identification of potential cell-cell interactions between two cell types and their ligand-receptor pairs for different disease states |
| Ligand | Receptor | LRpair | Pathway | Tissue | Disease Stage |
| Page: 1 |
Top |
Single-cell gene regulatory network inference analysis |
| Find out the significant the regulons (TFs) and the target genes of each regulon across cell types for different disease states |
| TF | Cell Type | Tissue | Disease Stage | Target Gene | RSS | Regulon Activity |
| ∗The dot plots of a searched regulon are shown for all cell subpopulations in each disease state of each tissue based on the regulon specific score inferred using pySCENIC and by calculating the average expression. |
| Page: 1 |
Top |
Somatic mutation of malignant transformation related genes |
| Annotation of somatic variants for genes involved in malignant transformation |
| Hugo Symbol | Variant Class | Variant Classification | dbSNP RS | HGVSc | HGVSp | HGVSp Short | SWISSPROT | BIOTYPE | SIFT | PolyPhen | Tumor Sample Barcode | Tissue | Histology | Sex | Age | Stage | Therapy Types | Drugs | Outcome |
| BNC1 | SNV | Missense_Mutation | c.1702C>A | p.Pro568Thr | p.P568T | Q01954 | protein_coding | deleterious(0.04) | benign(0.058) | TCGA-A2-A25A-01 | Breast | breast invasive carcinoma | Female | <65 | I/II | Unspecific | Cytoxan | SD | |
| BNC1 | SNV | Missense_Mutation | c.1220N>T | p.Ala407Val | p.A407V | Q01954 | protein_coding | deleterious(0) | possibly_damaging(0.793) | TCGA-A8-A08B-01 | Breast | breast invasive carcinoma | Female | <65 | I/II | Chemotherapy | 5-fluorouracil | CR | |
| BNC1 | SNV | Missense_Mutation | rs766072426 | c.2911C>T | p.Arg971Cys | p.R971C | Q01954 | protein_coding | deleterious(0) | probably_damaging(0.988) | TCGA-AN-A046-01 | Breast | breast invasive carcinoma | Female | >=65 | I/II | Unknown | Unknown | SD |
| BNC1 | SNV | Missense_Mutation | rs767533958 | c.2918G>A | p.Arg973Gln | p.R973Q | Q01954 | protein_coding | deleterious(0) | probably_damaging(0.987) | TCGA-AN-A0FW-01 | Breast | breast invasive carcinoma | Female | >=65 | III/IV | Unknown | Unknown | SD |
| BNC1 | SNV | Missense_Mutation | c.2821N>A | p.Gly941Arg | p.G941R | Q01954 | protein_coding | deleterious(0) | probably_damaging(0.999) | TCGA-AO-A03R-01 | Breast | breast invasive carcinoma | Female | <65 | I/II | Chemotherapy | doxorubicin | SD | |
| BNC1 | SNV | Missense_Mutation | c.320N>A | p.Arg107His | p.R107H | Q01954 | protein_coding | deleterious(0) | probably_damaging(0.998) | TCGA-B6-A40B-01 | Breast | breast invasive carcinoma | Female | >=65 | I/II | Unknown | Unknown | SD | |
| BNC1 | SNV | Missense_Mutation | rs149687703 | c.1576N>A | p.Glu526Lys | p.E526K | Q01954 | protein_coding | tolerated(0.12) | benign(0.057) | TCGA-BH-A1EV-01 | Breast | breast invasive carcinoma | Female | <65 | III/IV | Unknown | Unknown | PD |
| BNC1 | SNV | Missense_Mutation | c.2008G>A | p.Asp670Asn | p.D670N | Q01954 | protein_coding | tolerated(0.16) | benign(0) | TCGA-D8-A1J9-01 | Breast | breast invasive carcinoma | Female | <65 | I/II | Unknown | Unknown | SD | |
| BNC1 | SNV | Missense_Mutation | c.2491N>C | p.Val831Leu | p.V831L | Q01954 | protein_coding | deleterious(0.03) | benign(0.184) | TCGA-D8-A1XK-01 | Breast | breast invasive carcinoma | Female | <65 | I/II | Chemotherapy | doxorubicine+cyclophosphamide | SD | |
| BNC1 | SNV | Missense_Mutation | c.548T>A | p.Met183Lys | p.M183K | Q01954 | protein_coding | deleterious(0) | probably_damaging(0.991) | TCGA-E2-A10C-01 | Breast | breast invasive carcinoma | Female | <65 | I/II | Chemotherapy | cytoxan | SD |
| Page: 1 2 3 4 5 6 7 8 9 10 11 12 13 14 |
Top |
Related drugs of malignant transformation related genes |
| Identification of chemicals and drugs interact with genes involved in malignant transfromation |
| (DGIdb 4.0) |
| Entrez ID | Symbol | Category | Interaction Types | Drug Claim Name | Drug Name | PMIDs |
| Page: 1 |

Copyright 2023-Present -The University of Texas Health Science Center at Houston |