
|
|||||
|
 | |
| |
| |
| |
| |
| |
|
Gene: BMP2K |
Gene summary for BMP2K |
| Gene information | Species | Human | Gene symbol | BMP2K | Gene ID | 55589 |
| Gene name | BMP2 inducible kinase | |
| Gene Alias | BIKE | |
| Cytomap | 4q21.21 | |
| Gene Type | protein-coding | GO ID | GO:0001503 | UniProtAcc | Q9NSY1 |
Top |
Malignant transformation analysis |
| Identification of the aberrant gene expression in precancerous and cancerous lesions by comparing the gene expression of stem-like cells in diseased tissues with normal stem cells |
| Entrez ID | Symbol | Replicates | Species | Organ | Tissue | Adj P-value | Log2FC | Malignancy |
| 55589 | BMP2K | HTA11_6818_2000001021 | Human | Colorectum | AD | 1.12e-02 | -4.54e-01 | 0.0588 |
| 55589 | BMP2K | HTA11_99999970781_79442 | Human | Colorectum | MSS | 5.55e-18 | -5.94e-01 | 0.294 |
| 55589 | BMP2K | HTA11_99999971662_82457 | Human | Colorectum | MSS | 2.79e-06 | -4.18e-01 | 0.3859 |
| 55589 | BMP2K | HTA11_99999973899_84307 | Human | Colorectum | MSS | 4.92e-06 | -6.48e-01 | 0.2585 |
| 55589 | BMP2K | HTA11_99999974143_84620 | Human | Colorectum | MSS | 8.81e-19 | -5.79e-01 | 0.3005 |
| 55589 | BMP2K | A015-C-203 | Human | Colorectum | FAP | 6.90e-22 | -3.99e-01 | -0.1294 |
| 55589 | BMP2K | A015-C-204 | Human | Colorectum | FAP | 9.65e-04 | -2.78e-01 | -0.0228 |
| 55589 | BMP2K | A002-C-201 | Human | Colorectum | FAP | 1.13e-09 | -2.94e-01 | 0.0324 |
| 55589 | BMP2K | A001-C-119 | Human | Colorectum | FAP | 9.86e-04 | -4.41e-01 | -0.1557 |
| 55589 | BMP2K | A001-C-108 | Human | Colorectum | FAP | 2.99e-13 | -2.11e-01 | -0.0272 |
| 55589 | BMP2K | A002-C-205 | Human | Colorectum | FAP | 3.59e-17 | -3.76e-01 | -0.1236 |
| 55589 | BMP2K | A001-C-104 | Human | Colorectum | FAP | 6.94e-03 | -1.67e-01 | 0.0184 |
| 55589 | BMP2K | A015-C-006 | Human | Colorectum | FAP | 6.14e-14 | -4.83e-01 | -0.0994 |
| 55589 | BMP2K | A015-C-106 | Human | Colorectum | FAP | 7.12e-08 | -1.54e-01 | -0.0511 |
| 55589 | BMP2K | A002-C-114 | Human | Colorectum | FAP | 1.18e-11 | -3.27e-01 | -0.1561 |
| 55589 | BMP2K | A015-C-104 | Human | Colorectum | FAP | 2.05e-23 | -3.17e-01 | -0.1899 |
| 55589 | BMP2K | A001-C-014 | Human | Colorectum | FAP | 3.44e-06 | -2.27e-01 | 0.0135 |
| 55589 | BMP2K | A002-C-016 | Human | Colorectum | FAP | 4.81e-13 | -1.87e-01 | 0.0521 |
| 55589 | BMP2K | A015-C-002 | Human | Colorectum | FAP | 1.67e-07 | -2.24e-01 | -0.0763 |
| 55589 | BMP2K | A001-C-203 | Human | Colorectum | FAP | 8.57e-08 | -1.57e-01 | -0.0481 |
| Page: 1 2 3 4 |
| Tissue | Expression Dynamics | Abbreviation |
| Cervix |  | CC: Cervix cancer |
| HSIL_HPV: HPV-infected high-grade squamous intraepithelial lesions | ||
| N_HPV: HPV-infected normal cervix | ||
| Colorectum (GSE201348) |  | FAP: Familial adenomatous polyposis |
| CRC: Colorectal cancer | ||
| Colorectum (HTA11) |  | AD: Adenomas |
| SER: Sessile serrated lesions | ||
| MSI-H: Microsatellite-high colorectal cancer | ||
| MSS: Microsatellite stable colorectal cancer | ||
| Lung | 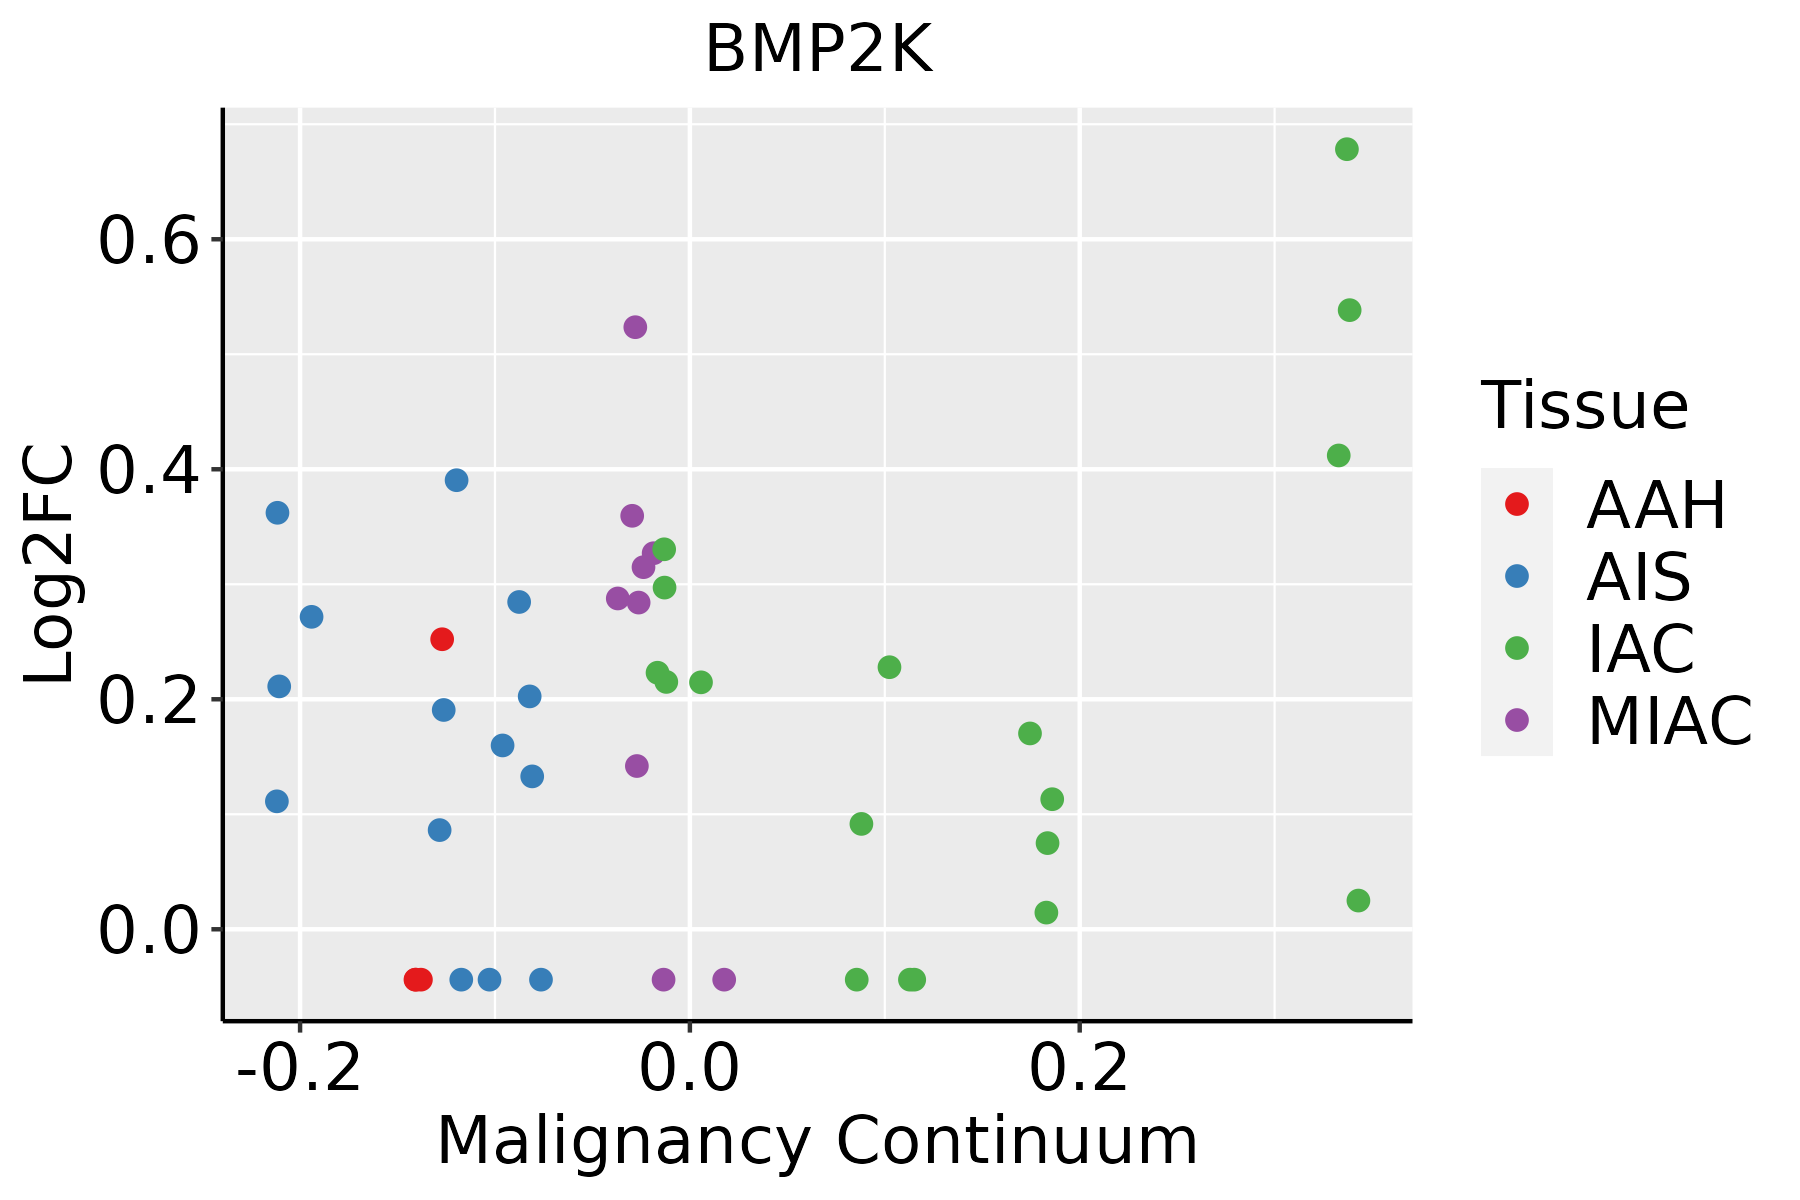 | AAH: Atypical adenomatous hyperplasia |
| AIS: Adenocarcinoma in situ | ||
| IAC: Invasive lung adenocarcinoma | ||
| MIA: Minimally invasive adenocarcinoma | ||
| Oral Cavity |  | EOLP: Erosive Oral lichen planus |
| LP: leukoplakia | ||
| NEOLP: Non-erosive oral lichen planus | ||
| OSCC: Oral squamous cell carcinoma | ||
| Thyroid | 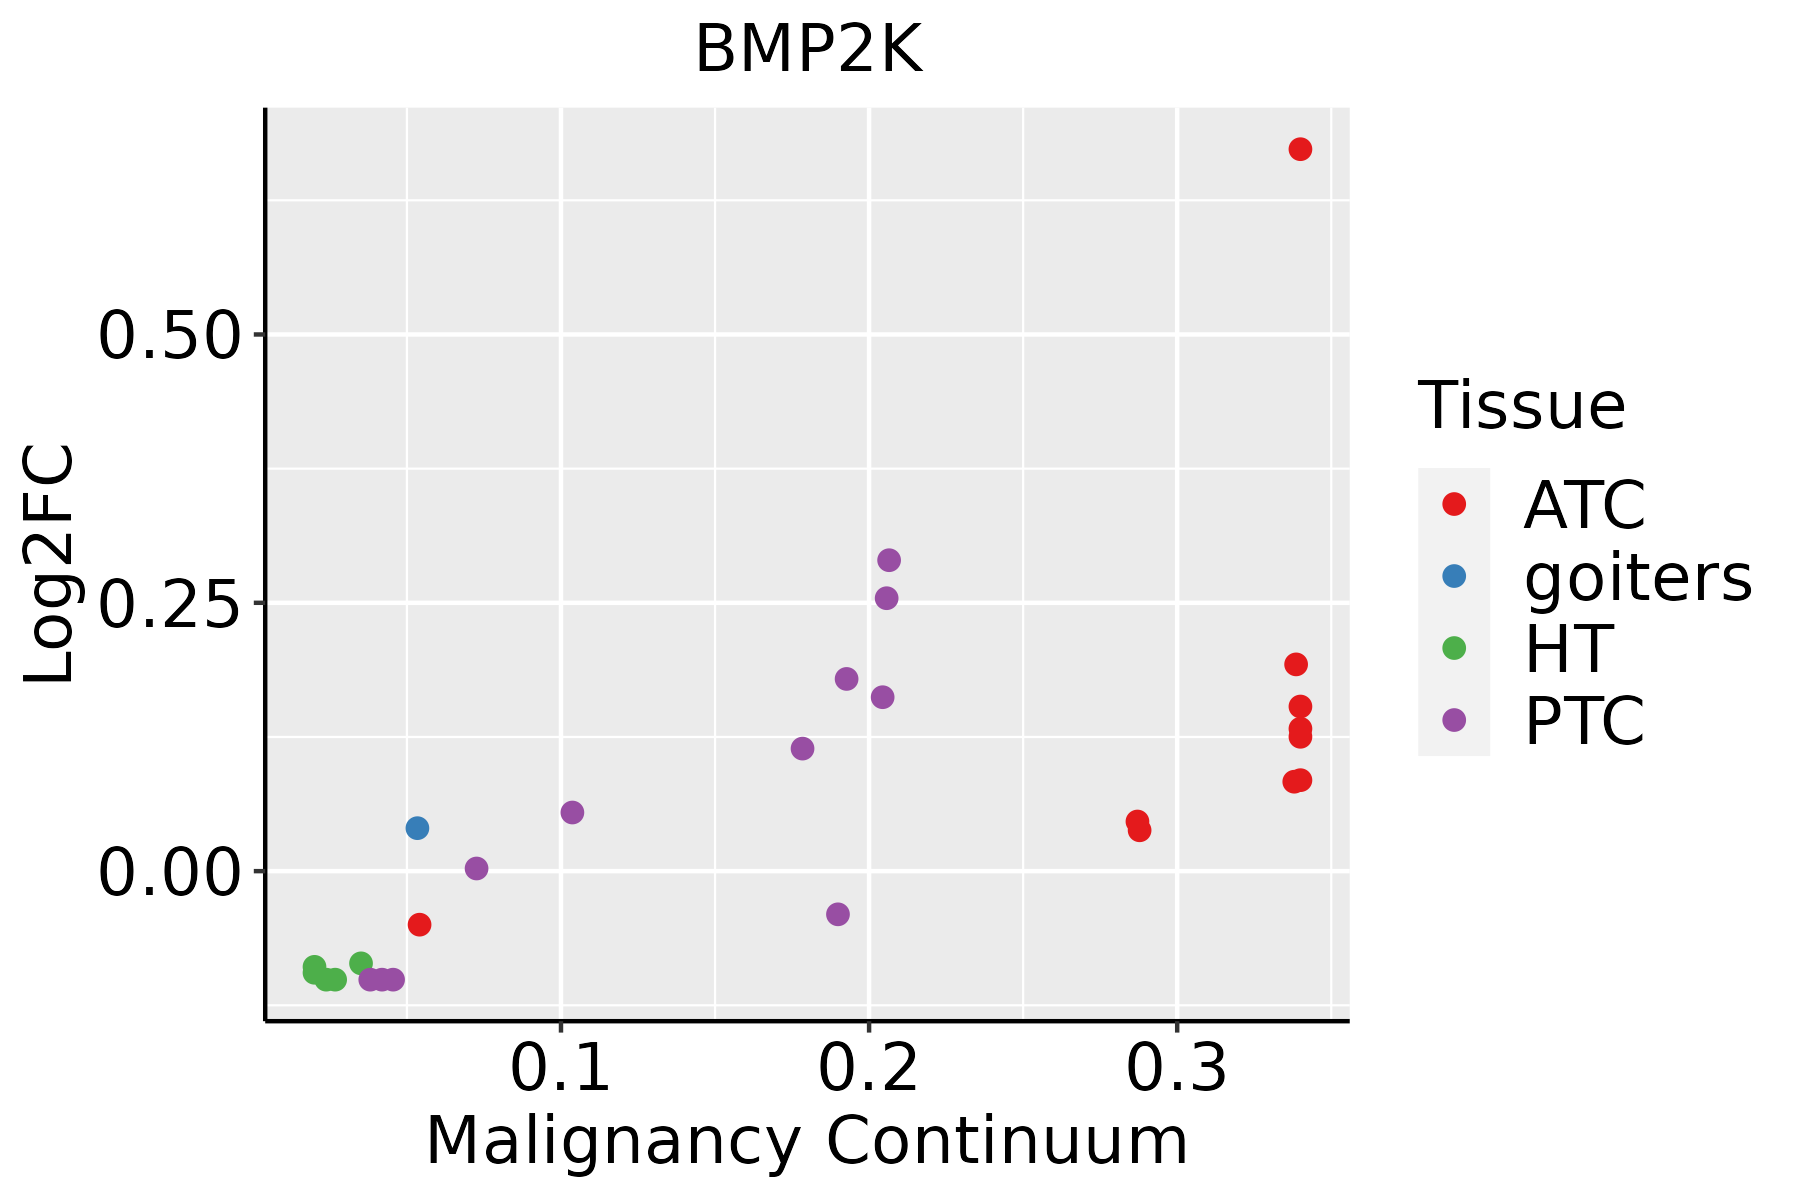 | ATC: Anaplastic thyroid cancer |
| HT: Hashimoto's thyroiditis | ||
| PTC: Papillary thyroid cancer |
| ∗log2FC in expression of this searched gene in stem-like cells from each diseased tissue sample relative to stem-like cells in normal samples in each tissue plotted against the malignancy continuum. Samples are colored based on if they are from different disease stage. |
Top |
Malignant transformation related pathway analysis |
| Find out the enriched GO biological processes and KEGG pathways involved in transition from healthy to precancer to cancer |
| Tissue | Disease Stage | Enriched GO biological Processes |
| Colorectum | AD |  |
| Colorectum | SER |  |
| Colorectum | MSS |  |
| Colorectum | MSI-H |  |
| Colorectum | FAP |  |
| ∗Top 15 enriched GO BP terms are showed in the bar plot of each disease state in each tissue. Each row represents a significant GO biological process which is colored according to the -log10(p.adjust). |
| Page: 1 2 3 4 5 6 7 8 9 |
| GO ID | Tissue | Disease Stage | Description | Gene Ratio | Bg Ratio | pvalue | p.adjust | Count |
| GO:00068987 | Cervix | CC | receptor-mediated endocytosis | 53/2311 | 244/18723 | 2.52e-05 | 4.29e-04 | 53 |
| GO:00301008 | Cervix | CC | regulation of endocytosis | 47/2311 | 211/18723 | 3.65e-05 | 5.82e-04 | 47 |
| GO:00725836 | Cervix | CC | clathrin-dependent endocytosis | 16/2311 | 47/18723 | 9.56e-05 | 1.25e-03 | 16 |
| GO:00072194 | Cervix | CC | Notch signaling pathway | 39/2311 | 172/18723 | 1.08e-04 | 1.38e-03 | 39 |
| GO:00085933 | Cervix | CC | regulation of Notch signaling pathway | 25/2311 | 95/18723 | 1.61e-04 | 1.93e-03 | 25 |
| GO:00015037 | Cervix | CC | ossification | 71/2311 | 408/18723 | 1.67e-03 | 1.28e-02 | 71 |
| GO:00482597 | Cervix | CC | regulation of receptor-mediated endocytosis | 24/2311 | 110/18723 | 3.62e-03 | 2.31e-02 | 24 |
| GO:0045747 | Cervix | CC | positive regulation of Notch signaling pathway | 13/2311 | 47/18723 | 3.62e-03 | 2.31e-02 | 13 |
| GO:00302781 | Cervix | CC | regulation of ossification | 24/2311 | 115/18723 | 6.51e-03 | 3.61e-02 | 24 |
| GO:0031214 | Cervix | CC | biomineral tissue development | 32/2311 | 169/18723 | 8.73e-03 | 4.48e-02 | 32 |
| GO:0030282 | Cervix | CC | bone mineralization | 24/2311 | 119/18723 | 1.00e-02 | 4.89e-02 | 24 |
| GO:0110148 | Cervix | CC | biomineralization | 32/2311 | 171/18723 | 1.04e-02 | 4.97e-02 | 32 |
| GO:000689814 | Cervix | HSIL_HPV | receptor-mediated endocytosis | 20/737 | 244/18723 | 1.64e-03 | 1.78e-02 | 20 |
| GO:000689824 | Cervix | N_HPV | receptor-mediated endocytosis | 17/534 | 244/18723 | 6.68e-04 | 8.57e-03 | 17 |
| GO:000721911 | Cervix | N_HPV | Notch signaling pathway | 12/534 | 172/18723 | 3.92e-03 | 3.08e-02 | 12 |
| GO:000150312 | Cervix | N_HPV | ossification | 21/534 | 408/18723 | 6.98e-03 | 4.61e-02 | 21 |
| GO:003010013 | Cervix | N_HPV | regulation of endocytosis | 13/534 | 211/18723 | 7.72e-03 | 4.97e-02 | 13 |
| GO:0072583 | Colorectum | AD | clathrin-dependent endocytosis | 24/3918 | 47/18723 | 4.60e-06 | 1.22e-04 | 24 |
| GO:0006898 | Colorectum | AD | receptor-mediated endocytosis | 76/3918 | 244/18723 | 1.07e-04 | 1.59e-03 | 76 |
| GO:0030100 | Colorectum | AD | regulation of endocytosis | 67/3918 | 211/18723 | 1.42e-04 | 2.01e-03 | 67 |
| Page: 1 2 3 4 5 |
| Pathway ID | Tissue | Disease Stage | Description | Gene Ratio | Bg Ratio | pvalue | p.adjust | qvalue | Count |
| hsa05202 | Colorectum | FAP | Transcriptional misregulation in cancer | 45/1404 | 193/8465 | 9.19e-03 | 3.33e-02 | 2.03e-02 | 45 |
| hsa052021 | Colorectum | FAP | Transcriptional misregulation in cancer | 45/1404 | 193/8465 | 9.19e-03 | 3.33e-02 | 2.03e-02 | 45 |
| hsa052026 | Lung | IAC | Transcriptional misregulation in cancer | 40/1053 | 193/8465 | 6.90e-04 | 5.90e-03 | 3.92e-03 | 40 |
| hsa0520211 | Lung | IAC | Transcriptional misregulation in cancer | 40/1053 | 193/8465 | 6.90e-04 | 5.90e-03 | 3.92e-03 | 40 |
| hsa052022 | Lung | AIS | Transcriptional misregulation in cancer | 39/961 | 193/8465 | 2.15e-04 | 2.41e-03 | 1.54e-03 | 39 |
| hsa052023 | Lung | AIS | Transcriptional misregulation in cancer | 39/961 | 193/8465 | 2.15e-04 | 2.41e-03 | 1.54e-03 | 39 |
| Page: 1 |
Top |
Cell-cell communication analysis |
| Identification of potential cell-cell interactions between two cell types and their ligand-receptor pairs for different disease states |
| Ligand | Receptor | LRpair | Pathway | Tissue | Disease Stage |
| Page: 1 |
Top |
Single-cell gene regulatory network inference analysis |
| Find out the significant the regulons (TFs) and the target genes of each regulon across cell types for different disease states |
| TF | Cell Type | Tissue | Disease Stage | Target Gene | RSS | Regulon Activity |
| ∗The dot plots of a searched regulon are shown for all cell subpopulations in each disease state of each tissue based on the regulon specific score inferred using pySCENIC and by calculating the average expression. |
| Page: 1 |
Top |
Somatic mutation of malignant transformation related genes |
| Annotation of somatic variants for genes involved in malignant transformation |
| Hugo Symbol | Variant Class | Variant Classification | dbSNP RS | HGVSc | HGVSp | HGVSp Short | SWISSPROT | BIOTYPE | SIFT | PolyPhen | Tumor Sample Barcode | Tissue | Histology | Sex | Age | Stage | Therapy Types | Drugs | Outcome |
| BMP2K | SNV | Missense_Mutation | novel | c.683N>T | p.Ser228Leu | p.S228L | Q9NSY1 | protein_coding | deleterious(0) | probably_damaging(0.952) | TCGA-3C-AALJ-01 | Breast | breast invasive carcinoma | Female | <65 | I/II | Chemotherapy | doxorubicin | SD |
| BMP2K | SNV | Missense_Mutation | novel | c.1462N>T | p.His488Tyr | p.H488Y | Q9NSY1 | protein_coding | tolerated_low_confidence(1) | benign(0.152) | TCGA-A7-A0DB-01 | Breast | breast invasive carcinoma | Female | <65 | I/II | Hormone Therapy | arimidex | SD |
| BMP2K | SNV | Missense_Mutation | c.995N>G | p.Ser332Cys | p.S332C | Q9NSY1 | protein_coding | deleterious(0.01) | benign(0.046) | TCGA-A8-A0A7-01 | Breast | breast invasive carcinoma | Female | <65 | I/II | Unknown | Unknown | SD | |
| BMP2K | SNV | Missense_Mutation | novel | c.3284N>C | p.His1095Pro | p.H1095P | Q9NSY1 | protein_coding | deleterious_low_confidence(0.03) | benign(0.003) | TCGA-AO-A0JB-01 | Breast | breast invasive carcinoma | Female | <65 | III/IV | Chemotherapy | cyclophosphamide | SD |
| BMP2K | SNV | Missense_Mutation | c.923N>C | p.Ile308Thr | p.I308T | Q9NSY1 | protein_coding | deleterious(0) | probably_damaging(0.999) | TCGA-BH-A0HN-01 | Breast | breast invasive carcinoma | Female | >=65 | I/II | Hormone Therapy | arimidex | SD | |
| BMP2K | SNV | Missense_Mutation | c.2127N>G | p.Ile709Met | p.I709M | Q9NSY1 | protein_coding | tolerated_low_confidence(0.12) | benign(0) | TCGA-BH-A0HP-01 | Breast | breast invasive carcinoma | Female | >=65 | III/IV | Chemotherapy | doxorubicin | SD | |
| BMP2K | insertion | In_Frame_Ins | novel | c.3285_3286insCTTCTCCTAAGAGCAGTGAAGAGGAAGAGCAAGATGATG | p.His1095_Asn1096insLeuLeuLeuArgAlaValLysArgLysSerLysMetMet | p.H1095_N1096insLLLRAVKRKSKMM | Q9NSY1 | protein_coding | TCGA-AO-A0JB-01 | Breast | breast invasive carcinoma | Female | <65 | III/IV | Chemotherapy | cyclophosphamide | SD | ||
| BMP2K | SNV | Missense_Mutation | rs769519712 | c.2600G>A | p.Arg867His | p.R867H | Q9NSY1 | protein_coding | tolerated_low_confidence(0.47) | benign(0) | TCGA-2W-A8YY-01 | Cervix | cervical & endocervical cancer | Female | <65 | I/II | Chemotherapy | cisplatin | CR |
| BMP2K | SNV | Missense_Mutation | c.614A>C | p.Lys205Thr | p.K205T | Q9NSY1 | protein_coding | deleterious(0.01) | probably_damaging(0.965) | TCGA-A6-6141-01 | Colorectum | colon adenocarcinoma | Male | <65 | I/II | Chemotherapy | 5-fu | SD | |
| BMP2K | SNV | Missense_Mutation | rs560165697 | c.2326G>A | p.Asp776Asn | p.D776N | Q9NSY1 | protein_coding | deleterious_low_confidence(0.03) | possibly_damaging(0.879) | TCGA-AA-3710-01 | Colorectum | colon adenocarcinoma | Female | >=65 | I/II | Unknown | Unknown | SD |
| Page: 1 2 3 4 5 6 7 8 9 |
Top |
Related drugs of malignant transformation related genes |
| Identification of chemicals and drugs interact with genes involved in malignant transfromation |
| (DGIdb 4.0) |
| Entrez ID | Symbol | Category | Interaction Types | Drug Claim Name | Drug Name | PMIDs |
| 55589 | BMP2K | KINASE, SERINE THREONINE KINASE, DRUGGABLE GENOME, ENZYME | inhibitor | HESPERADIN | HESPERADIN | 19035792 |
| 55589 | BMP2K | KINASE, SERINE THREONINE KINASE, DRUGGABLE GENOME, ENZYME | inhibitor | 223366123 | BARICITINIB | |
| 55589 | BMP2K | KINASE, SERINE THREONINE KINASE, DRUGGABLE GENOME, ENZYME | inhibitor | 249565886 |
| Page: 1 |

Copyright 2023-Present -The University of Texas Health Science Center at Houston |