
|
|||||
|
 | |
| |
| |
| |
| |
| |
|
Gene: BMP1 |
Gene summary for BMP1 |
| Gene information | Species | Human | Gene symbol | BMP1 | Gene ID | 649 |
| Gene name | bone morphogenetic protein 1 | |
| Gene Alias | OI13 | |
| Cytomap | 8p21.3 | |
| Gene Type | protein-coding | GO ID | GO:0001501 | UniProtAcc | P13497 |
Top |
Malignant transformation analysis |
| Identification of the aberrant gene expression in precancerous and cancerous lesions by comparing the gene expression of stem-like cells in diseased tissues with normal stem cells |
| Entrez ID | Symbol | Replicates | Species | Organ | Tissue | Adj P-value | Log2FC | Malignancy |
| 649 | BMP1 | P27T-E | Human | Esophagus | ESCC | 2.20e-10 | 2.41e-01 | 0.1055 |
| 649 | BMP1 | P28T-E | Human | Esophagus | ESCC | 3.56e-26 | 4.57e-01 | 0.1149 |
| 649 | BMP1 | P30T-E | Human | Esophagus | ESCC | 7.28e-11 | 4.97e-01 | 0.137 |
| 649 | BMP1 | P31T-E | Human | Esophagus | ESCC | 4.67e-19 | 2.68e-01 | 0.1251 |
| 649 | BMP1 | P32T-E | Human | Esophagus | ESCC | 7.43e-28 | 8.26e-01 | 0.1666 |
| 649 | BMP1 | P36T-E | Human | Esophagus | ESCC | 1.29e-08 | 2.78e-01 | 0.1187 |
| 649 | BMP1 | P37T-E | Human | Esophagus | ESCC | 3.28e-36 | 8.04e-01 | 0.1371 |
| 649 | BMP1 | P38T-E | Human | Esophagus | ESCC | 1.33e-03 | 1.54e-01 | 0.127 |
| 649 | BMP1 | P39T-E | Human | Esophagus | ESCC | 2.74e-05 | 1.12e-01 | 0.0894 |
| 649 | BMP1 | P42T-E | Human | Esophagus | ESCC | 1.99e-12 | 5.74e-01 | 0.1175 |
| 649 | BMP1 | P44T-E | Human | Esophagus | ESCC | 7.30e-08 | 4.23e-01 | 0.1096 |
| 649 | BMP1 | P47T-E | Human | Esophagus | ESCC | 3.25e-09 | 2.97e-01 | 0.1067 |
| 649 | BMP1 | P48T-E | Human | Esophagus | ESCC | 2.88e-07 | 1.90e-01 | 0.0959 |
| 649 | BMP1 | P49T-E | Human | Esophagus | ESCC | 1.18e-05 | 3.83e-01 | 0.1768 |
| 649 | BMP1 | P52T-E | Human | Esophagus | ESCC | 1.23e-18 | 3.78e-01 | 0.1555 |
| 649 | BMP1 | P54T-E | Human | Esophagus | ESCC | 1.98e-14 | 2.90e-01 | 0.0975 |
| 649 | BMP1 | P57T-E | Human | Esophagus | ESCC | 5.25e-03 | 5.26e-02 | 0.0926 |
| 649 | BMP1 | P61T-E | Human | Esophagus | ESCC | 2.12e-15 | 2.81e-01 | 0.099 |
| 649 | BMP1 | P62T-E | Human | Esophagus | ESCC | 5.10e-07 | 1.78e-01 | 0.1302 |
| 649 | BMP1 | P65T-E | Human | Esophagus | ESCC | 8.86e-04 | 4.41e-02 | 0.0978 |
| Page: 1 2 3 4 5 |
| Tissue | Expression Dynamics | Abbreviation |
| Esophagus | 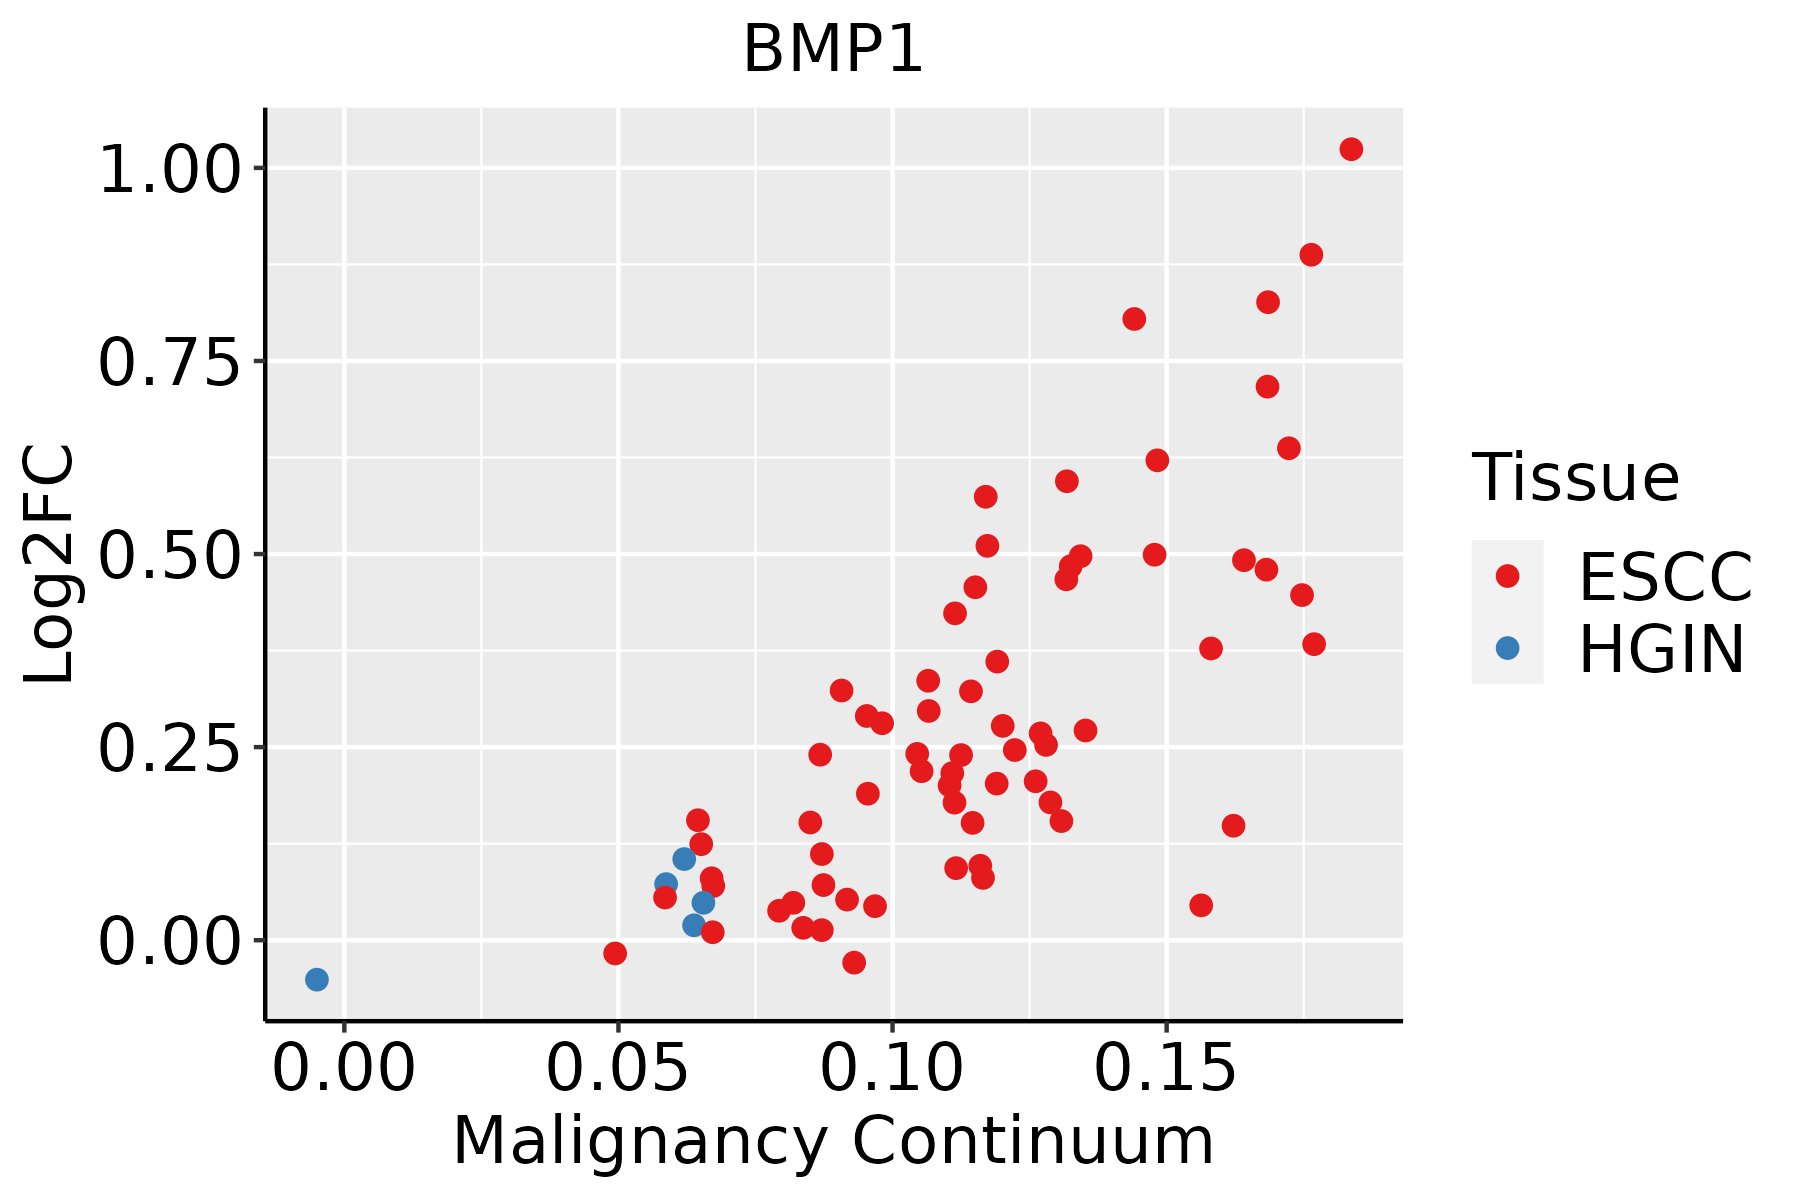 | ESCC: Esophageal squamous cell carcinoma |
| HGIN: High-grade intraepithelial neoplasias | ||
| LGIN: Low-grade intraepithelial neoplasias | ||
| Liver |  | HCC: Hepatocellular carcinoma |
| NAFLD: Non-alcoholic fatty liver disease | ||
| Oral Cavity | 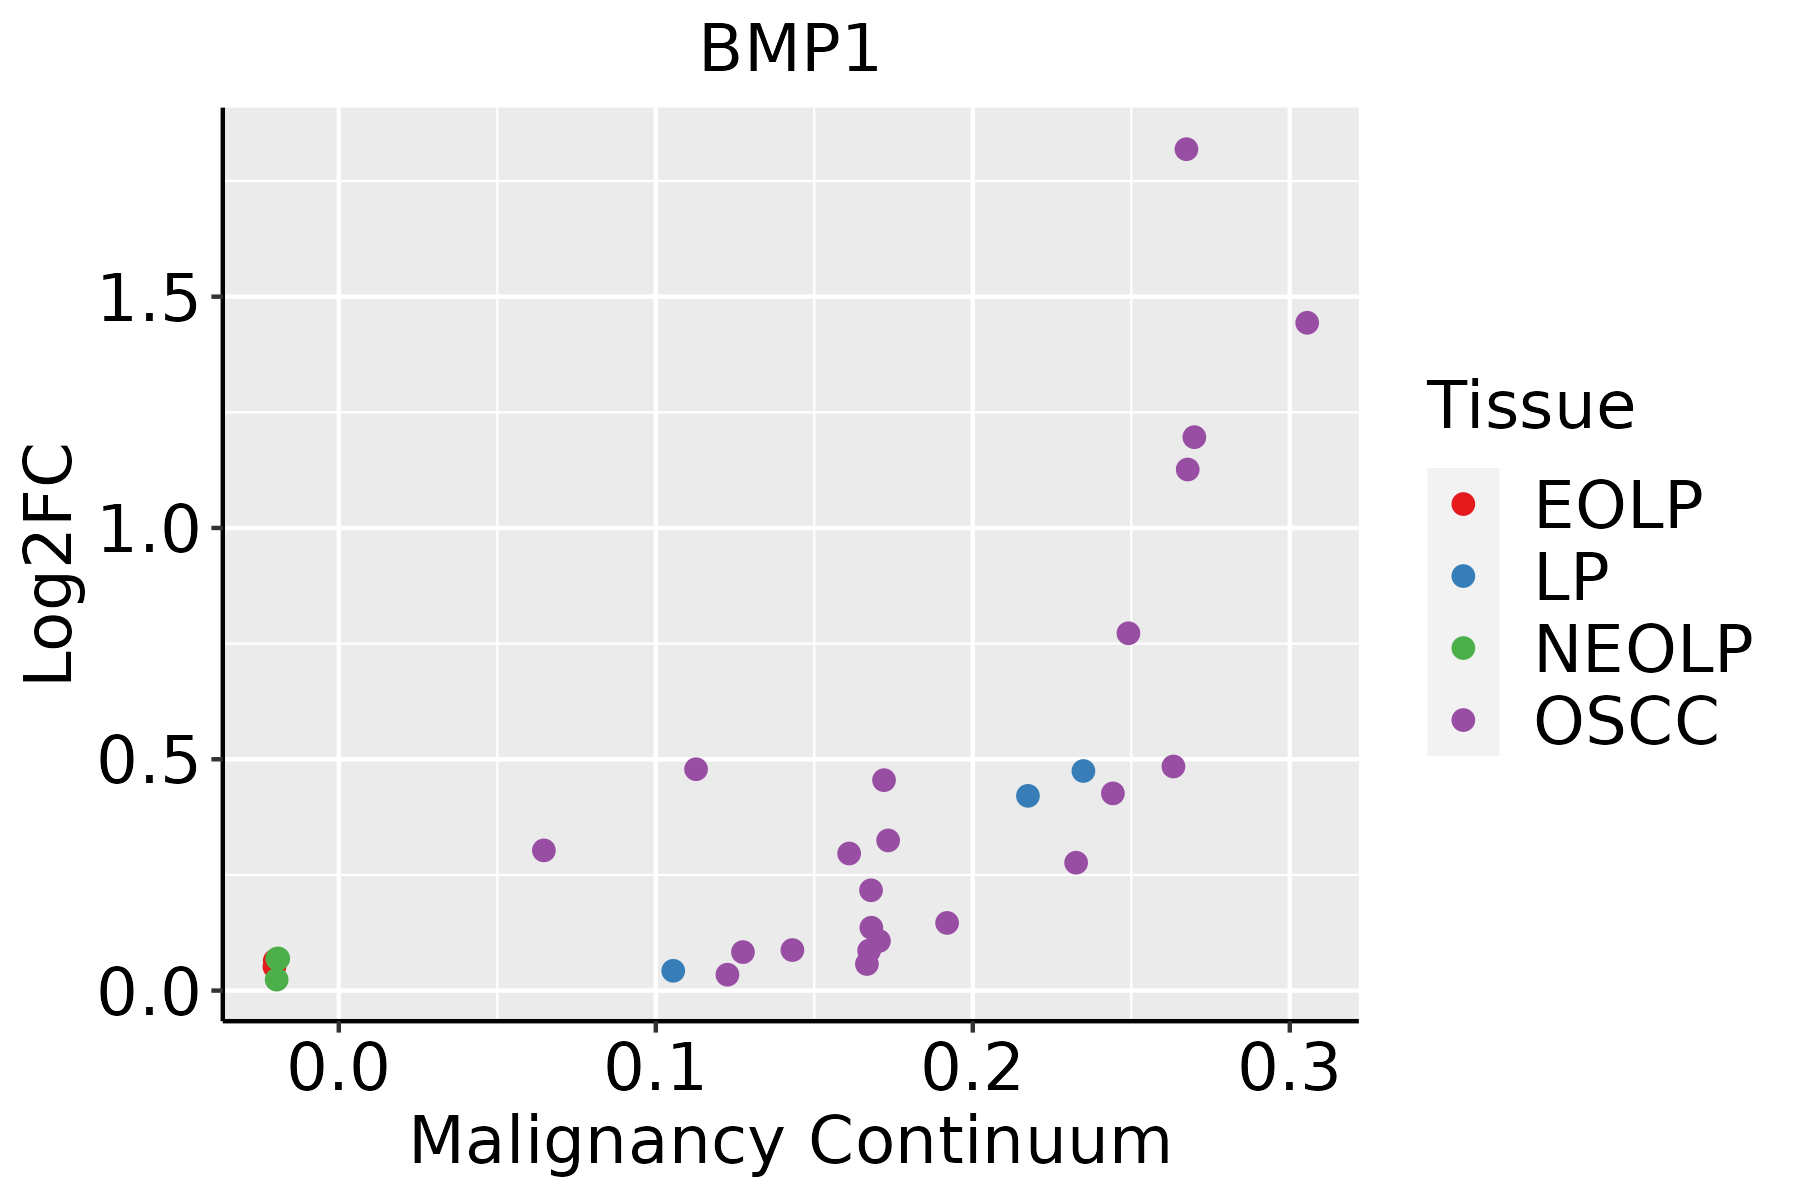 | EOLP: Erosive Oral lichen planus |
| LP: leukoplakia | ||
| NEOLP: Non-erosive oral lichen planus | ||
| OSCC: Oral squamous cell carcinoma | ||
| Skin |  | AK: Actinic keratosis |
| cSCC: Cutaneous squamous cell carcinoma | ||
| SCCIS:squamous cell carcinoma in situ | ||
| Thyroid | 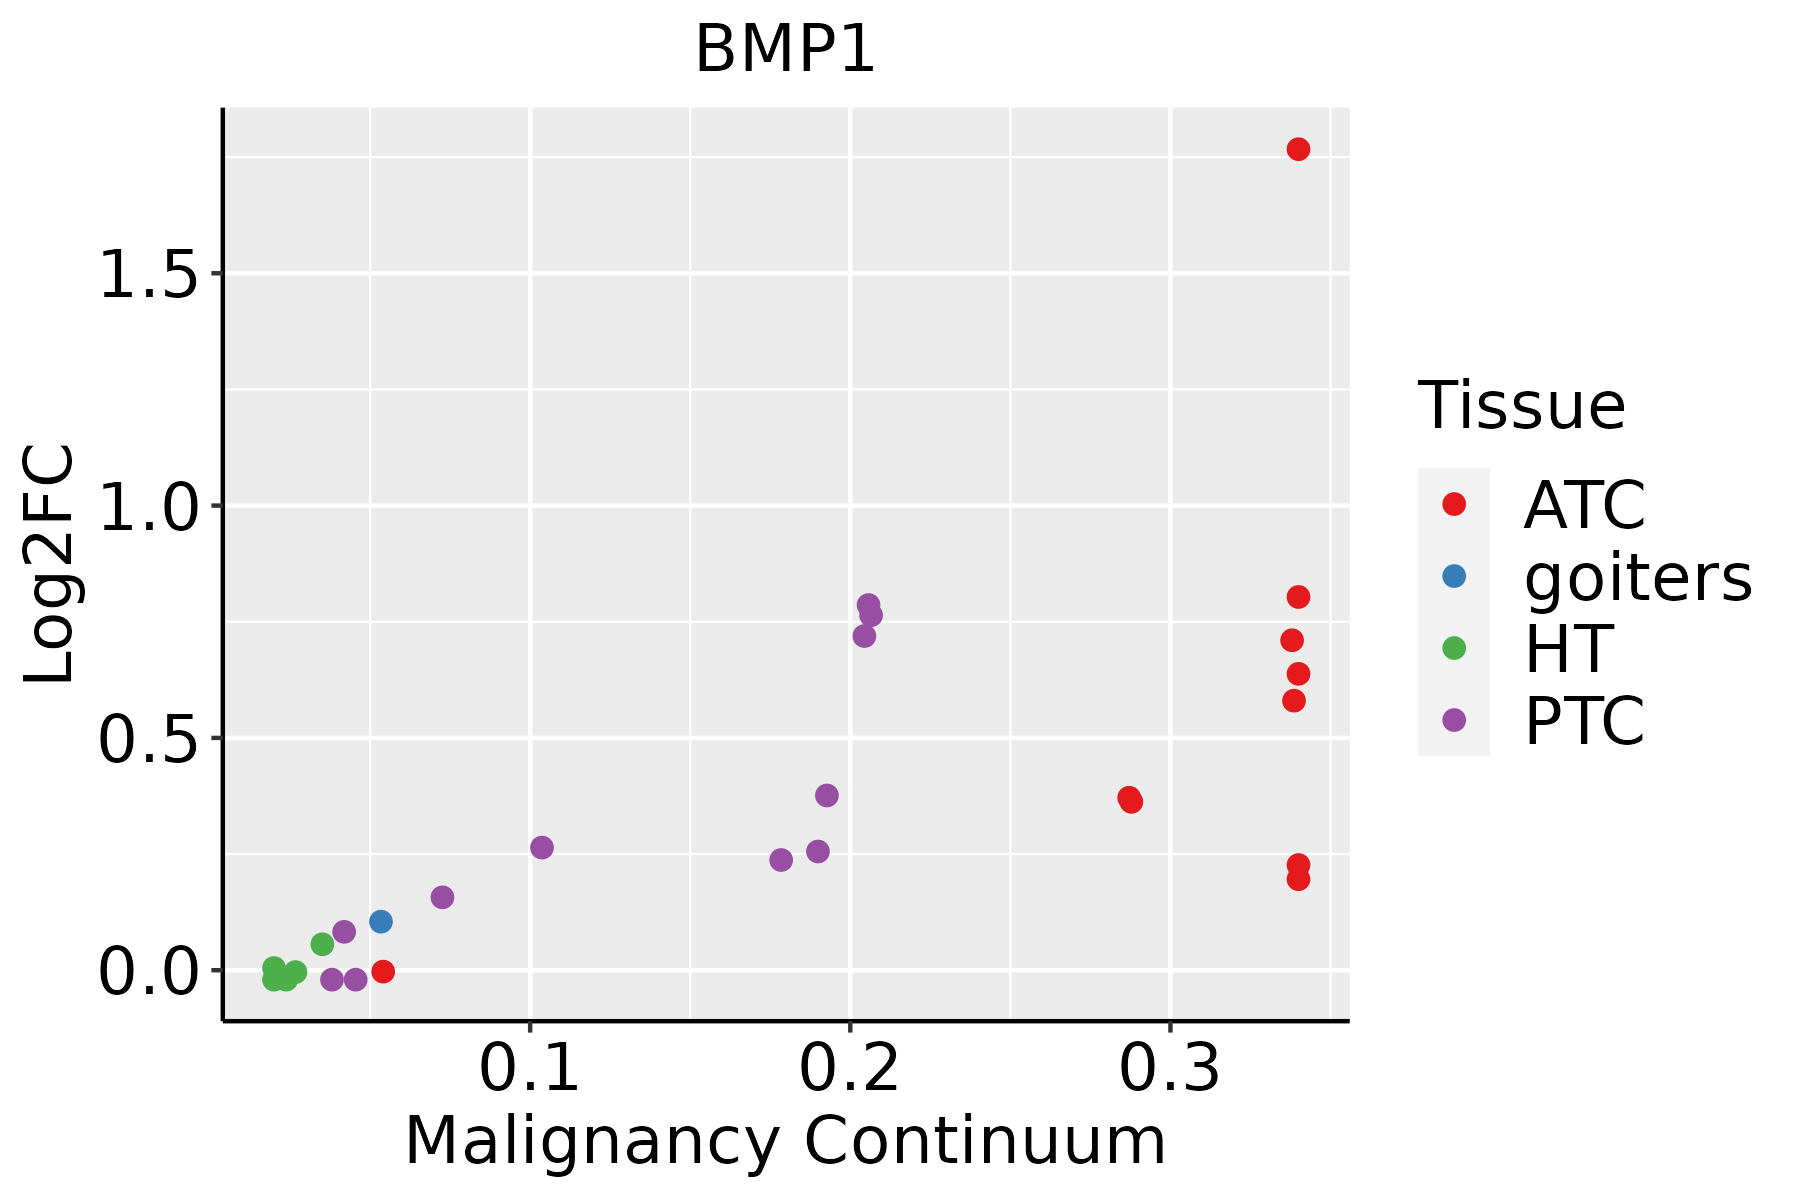 | ATC: Anaplastic thyroid cancer |
| HT: Hashimoto's thyroiditis | ||
| PTC: Papillary thyroid cancer |
| ∗log2FC in expression of this searched gene in stem-like cells from each diseased tissue sample relative to stem-like cells in normal samples in each tissue plotted against the malignancy continuum. Samples are colored based on if they are from different disease stage. |
Top |
Malignant transformation related pathway analysis |
| Find out the enriched GO biological processes and KEGG pathways involved in transition from healthy to precancer to cancer |
| Tissue | Disease Stage | Enriched GO biological Processes |
| Colorectum | AD |  |
| Colorectum | SER |  |
| Colorectum | MSS |  |
| Colorectum | MSI-H |  |
| Colorectum | FAP |  |
| ∗Top 15 enriched GO BP terms are showed in the bar plot of each disease state in each tissue. Each row represents a significant GO biological process which is colored according to the -log10(p.adjust). |
| Page: 1 2 3 4 5 6 7 8 9 |
| GO ID | Tissue | Disease Stage | Description | Gene Ratio | Bg Ratio | pvalue | p.adjust | Count |
| GO:000150317 | Esophagus | ESCC | ossification | 232/8552 | 408/18723 | 3.00e-06 | 3.40e-05 | 232 |
| GO:00301984 | Esophagus | ESCC | extracellular matrix organization | 171/8552 | 301/18723 | 6.08e-05 | 4.67e-04 | 171 |
| GO:00430624 | Esophagus | ESCC | extracellular structure organization | 171/8552 | 302/18723 | 7.73e-05 | 5.76e-04 | 171 |
| GO:00452294 | Esophagus | ESCC | external encapsulating structure organization | 172/8552 | 304/18723 | 7.80e-05 | 5.80e-04 | 172 |
| GO:00301993 | Esophagus | ESCC | collagen fibril organization | 40/8552 | 61/18723 | 1.35e-03 | 6.44e-03 | 40 |
| GO:00487052 | Esophagus | ESCC | skeletal system morphogenesis | 120/8552 | 220/18723 | 4.90e-03 | 1.89e-02 | 120 |
| GO:00512161 | Esophagus | ESCC | cartilage development | 103/8552 | 190/18723 | 1.08e-02 | 3.67e-02 | 103 |
| GO:000150310 | Oral cavity | OSCC | ossification | 203/7305 | 408/18723 | 5.54e-06 | 6.19e-05 | 203 |
| GO:00301983 | Oral cavity | OSCC | extracellular matrix organization | 146/7305 | 301/18723 | 4.67e-04 | 2.77e-03 | 146 |
| GO:00452293 | Oral cavity | OSCC | external encapsulating structure organization | 147/7305 | 304/18723 | 5.30e-04 | 3.08e-03 | 147 |
| GO:00430623 | Oral cavity | OSCC | extracellular structure organization | 146/7305 | 302/18723 | 5.59e-04 | 3.23e-03 | 146 |
| GO:000150323 | Skin | cSCC | ossification | 137/4864 | 408/18723 | 3.39e-04 | 2.68e-03 | 137 |
| GO:0001503110 | Thyroid | PTC | ossification | 176/5968 | 408/18723 | 9.26e-07 | 1.40e-05 | 176 |
| GO:00301986 | Thyroid | PTC | extracellular matrix organization | 124/5968 | 301/18723 | 3.75e-04 | 2.53e-03 | 124 |
| GO:00430626 | Thyroid | PTC | extracellular structure organization | 124/5968 | 302/18723 | 4.38e-04 | 2.92e-03 | 124 |
| GO:00452296 | Thyroid | PTC | external encapsulating structure organization | 124/5968 | 304/18723 | 5.96e-04 | 3.79e-03 | 124 |
| GO:00301995 | Thyroid | PTC | collagen fibril organization | 29/5968 | 61/18723 | 7.57e-03 | 3.23e-02 | 29 |
| GO:000150332 | Thyroid | ATC | ossification | 206/6293 | 408/18723 | 9.23e-13 | 3.95e-11 | 206 |
| GO:003019812 | Thyroid | ATC | extracellular matrix organization | 152/6293 | 301/18723 | 8.63e-10 | 2.24e-08 | 152 |
| GO:004306212 | Thyroid | ATC | extracellular structure organization | 152/6293 | 302/18723 | 1.17e-09 | 2.94e-08 | 152 |
| Page: 1 2 |
| Pathway ID | Tissue | Disease Stage | Description | Gene Ratio | Bg Ratio | pvalue | p.adjust | qvalue | Count |
| Page: 1 |
Top |
Cell-cell communication analysis |
| Identification of potential cell-cell interactions between two cell types and their ligand-receptor pairs for different disease states |
| Ligand | Receptor | LRpair | Pathway | Tissue | Disease Stage |
| Page: 1 |
Top |
Single-cell gene regulatory network inference analysis |
| Find out the significant the regulons (TFs) and the target genes of each regulon across cell types for different disease states |
| TF | Cell Type | Tissue | Disease Stage | Target Gene | RSS | Regulon Activity |
| ∗The dot plots of a searched regulon are shown for all cell subpopulations in each disease state of each tissue based on the regulon specific score inferred using pySCENIC and by calculating the average expression. |
| Page: 1 |
Top |
Somatic mutation of malignant transformation related genes |
| Annotation of somatic variants for genes involved in malignant transformation |
| Hugo Symbol | Variant Class | Variant Classification | dbSNP RS | HGVSc | HGVSp | HGVSp Short | SWISSPROT | BIOTYPE | SIFT | PolyPhen | Tumor Sample Barcode | Tissue | Histology | Sex | Age | Stage | Therapy Types | Drugs | Outcome |
| BMP1 | SNV | Missense_Mutation | c.1030G>A | p.Ala344Thr | p.A344T | P13497 | protein_coding | tolerated(0.22) | benign(0.06) | TCGA-B6-A0I6-01 | Breast | breast invasive carcinoma | Female | <65 | I/II | Unknown | Unknown | PD | |
| BMP1 | SNV | Missense_Mutation | novel | c.1152N>A | p.Asp384Glu | p.D384E | P13497 | protein_coding | deleterious(0.03) | probably_damaging(0.986) | TCGA-BH-A0HK-01 | Breast | breast invasive carcinoma | Female | >=65 | I/II | Hormone Therapy | arimidex | SD |
| BMP1 | SNV | Missense_Mutation | rs145735409 | c.2014N>A | p.Glu672Lys | p.E672K | P13497 | protein_coding | tolerated(0.2) | possibly_damaging(0.87) | TCGA-GM-A2DH-01 | Breast | breast invasive carcinoma | Female | <65 | I/II | Chemotherapy | taxol | CR |
| BMP1 | insertion | In_Frame_Ins | novel | c.1150_1151insTACGTGTTCTTC | p.Asp384delinsValArgValLeuHis | p.D384delinsVRVLH | P13497 | protein_coding | TCGA-BH-A0HK-01 | Breast | breast invasive carcinoma | Female | >=65 | I/II | Hormone Therapy | arimidex | SD | ||
| BMP1 | SNV | Missense_Mutation | rs762071697 | c.1523N>A | p.Arg508His | p.R508H | P13497 | protein_coding | tolerated(0.34) | benign(0.198) | TCGA-2W-A8YY-01 | Cervix | cervical & endocervical cancer | Female | <65 | I/II | Chemotherapy | cisplatin | CR |
| BMP1 | SNV | Missense_Mutation | novel | c.1051C>T | p.Arg351Cys | p.R351C | P13497 | protein_coding | deleterious(0) | possibly_damaging(0.773) | TCGA-C5-A8XK-01 | Cervix | cervical & endocervical cancer | Female | <65 | I/II | Chemotherapy | cisplatin | SD |
| BMP1 | SNV | Missense_Mutation | rs752066503 | c.1954C>T | p.Arg652Cys | p.R652C | P13497 | protein_coding | deleterious(0.05) | probably_damaging(0.982) | TCGA-EA-A410-01 | Cervix | cervical & endocervical cancer | Female | <65 | I/II | Unknown | Unknown | SD |
| BMP1 | SNV | Missense_Mutation | c.1789A>G | p.Lys597Glu | p.K597E | P13497 | protein_coding | tolerated(0.23) | benign(0.118) | TCGA-A6-A565-01 | Colorectum | colon adenocarcinoma | Female | <65 | III/IV | Unspecific | 5FU | PD | |
| BMP1 | SNV | Missense_Mutation | novel | c.508N>G | p.Thr170Ala | p.T170A | P13497 | protein_coding | tolerated(0.06) | benign(0.009) | TCGA-AA-3492-01 | Colorectum | colon adenocarcinoma | Female | >=65 | I/II | Unknown | Unknown | SD |
| BMP1 | SNV | Missense_Mutation | rs886062818 | c.178N>A | p.Glu60Lys | p.E60K | P13497 | protein_coding | deleterious(0.02) | benign(0.005) | TCGA-AA-3510-01 | Colorectum | colon adenocarcinoma | Male | >=65 | I/II | Unknown | Unknown | SD |
| Page: 1 2 3 4 5 6 7 8 9 10 |
Top |
Related drugs of malignant transformation related genes |
| Identification of chemicals and drugs interact with genes involved in malignant transfromation |
| (DGIdb 4.0) |
| Entrez ID | Symbol | Category | Interaction Types | Drug Claim Name | Drug Name | PMIDs |
| 649 | BMP1 | PROTEASE, NEUTRAL ZINC METALLOPEPTIDASE, GROWTH FACTOR, DRUGGABLE GENOME, ENZYME | inhibitor | 252166763 |
| Page: 1 |

Copyright 2023-Present -The University of Texas Health Science Center at Houston |