| Tissue | Expression Dynamics | Abbreviation |
| Colorectum (GSE201348) | 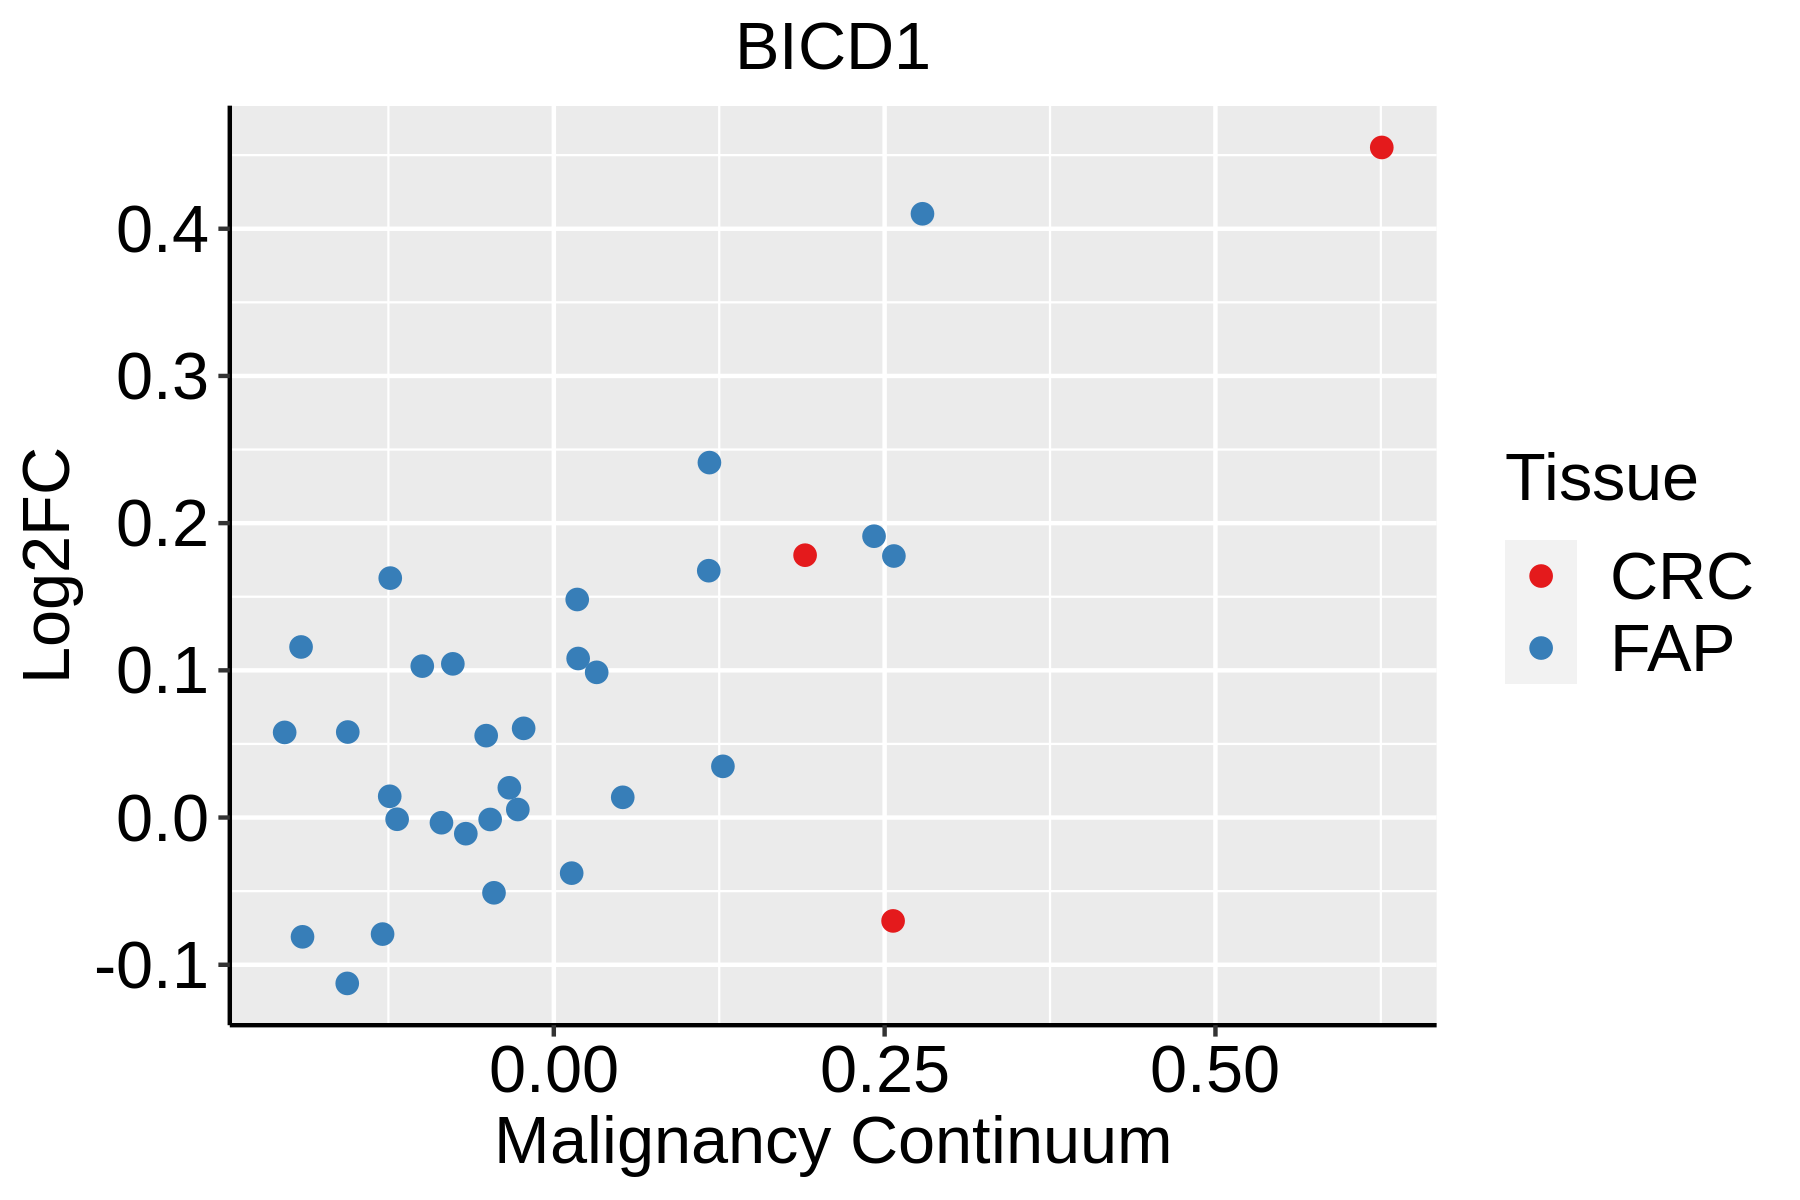 | FAP: Familial adenomatous polyposis |
| CRC: Colorectal cancer |
| Colorectum (HTA11) | 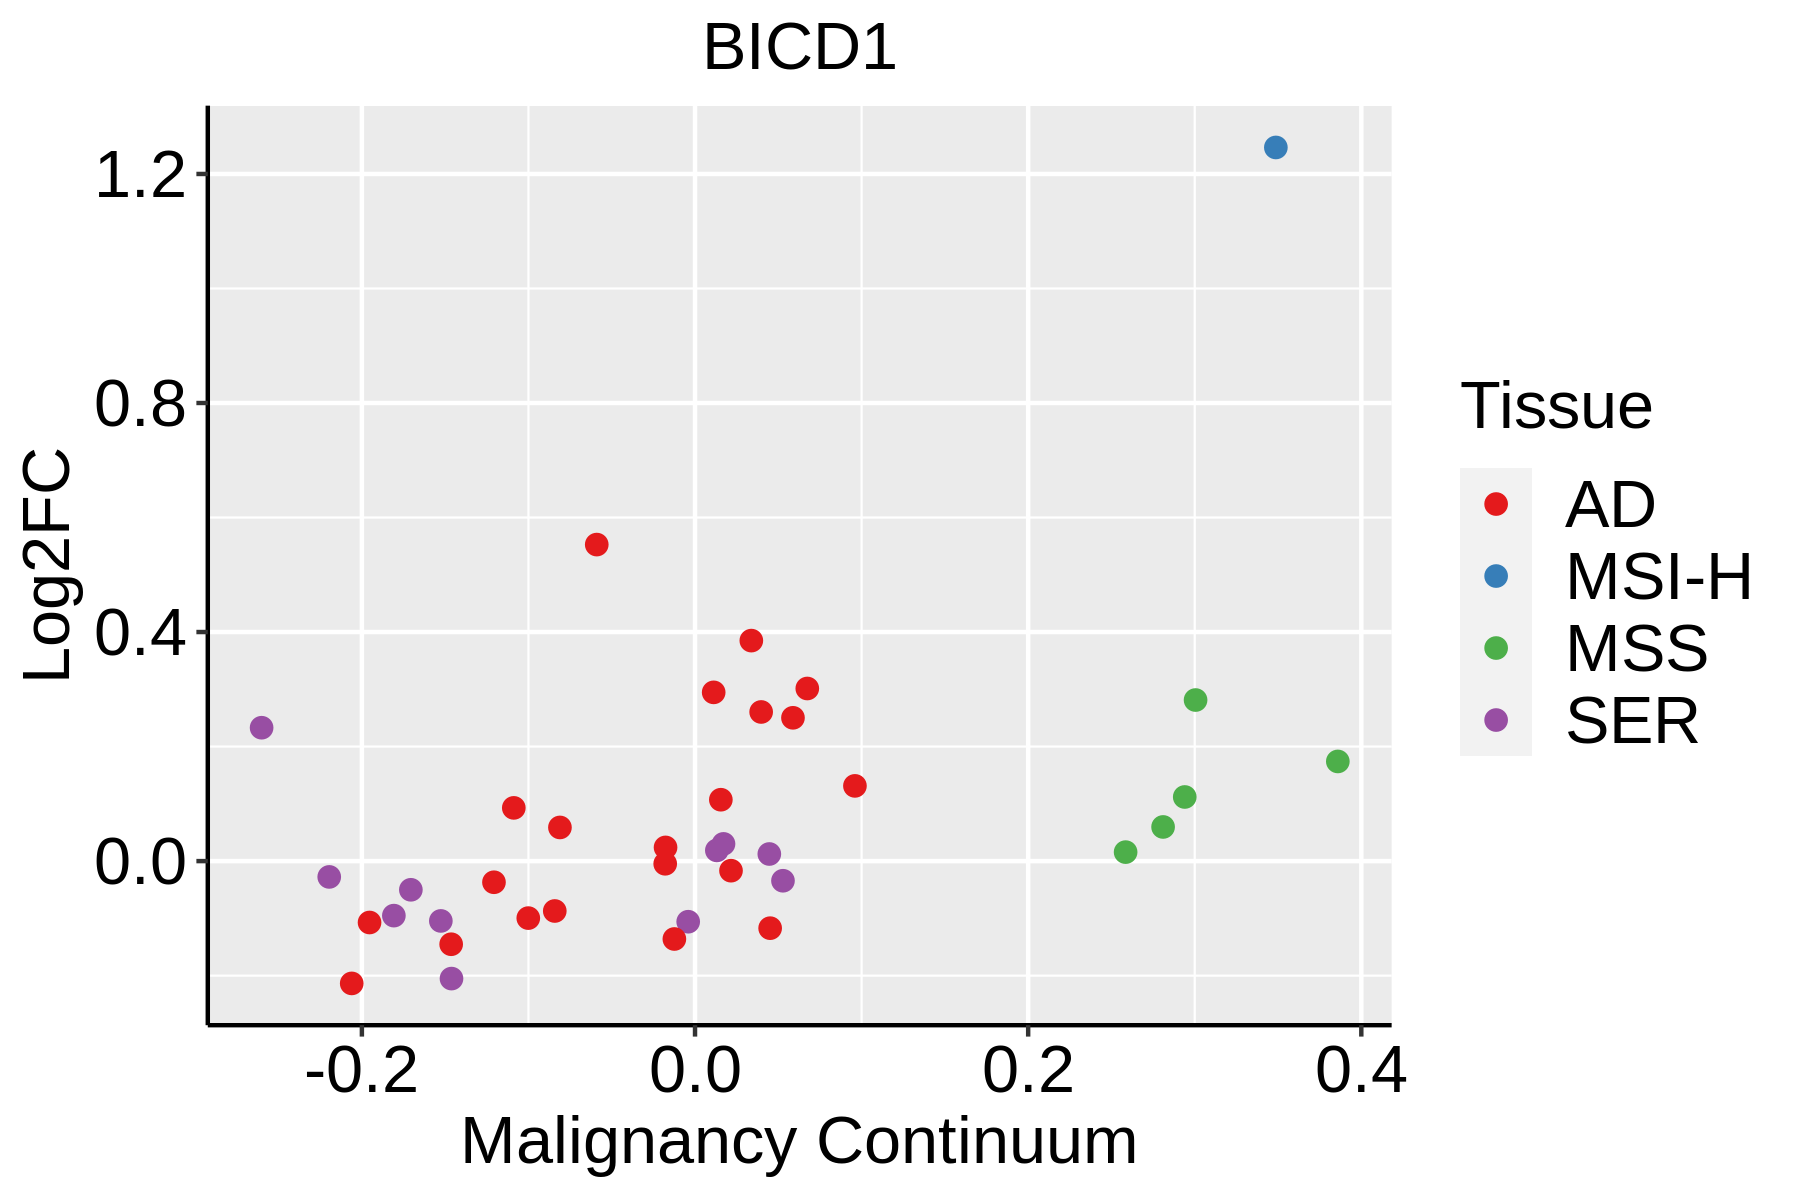 | AD: Adenomas |
| SER: Sessile serrated lesions |
| MSI-H: Microsatellite-high colorectal cancer |
| MSS: Microsatellite stable colorectal cancer |
| Endometrium |  | AEH: Atypical endometrial hyperplasia |
| EEC: Endometrioid Cancer |
| Esophagus |  | ESCC: Esophageal squamous cell carcinoma |
| HGIN: High-grade intraepithelial neoplasias |
| LGIN: Low-grade intraepithelial neoplasias |
| Lung | 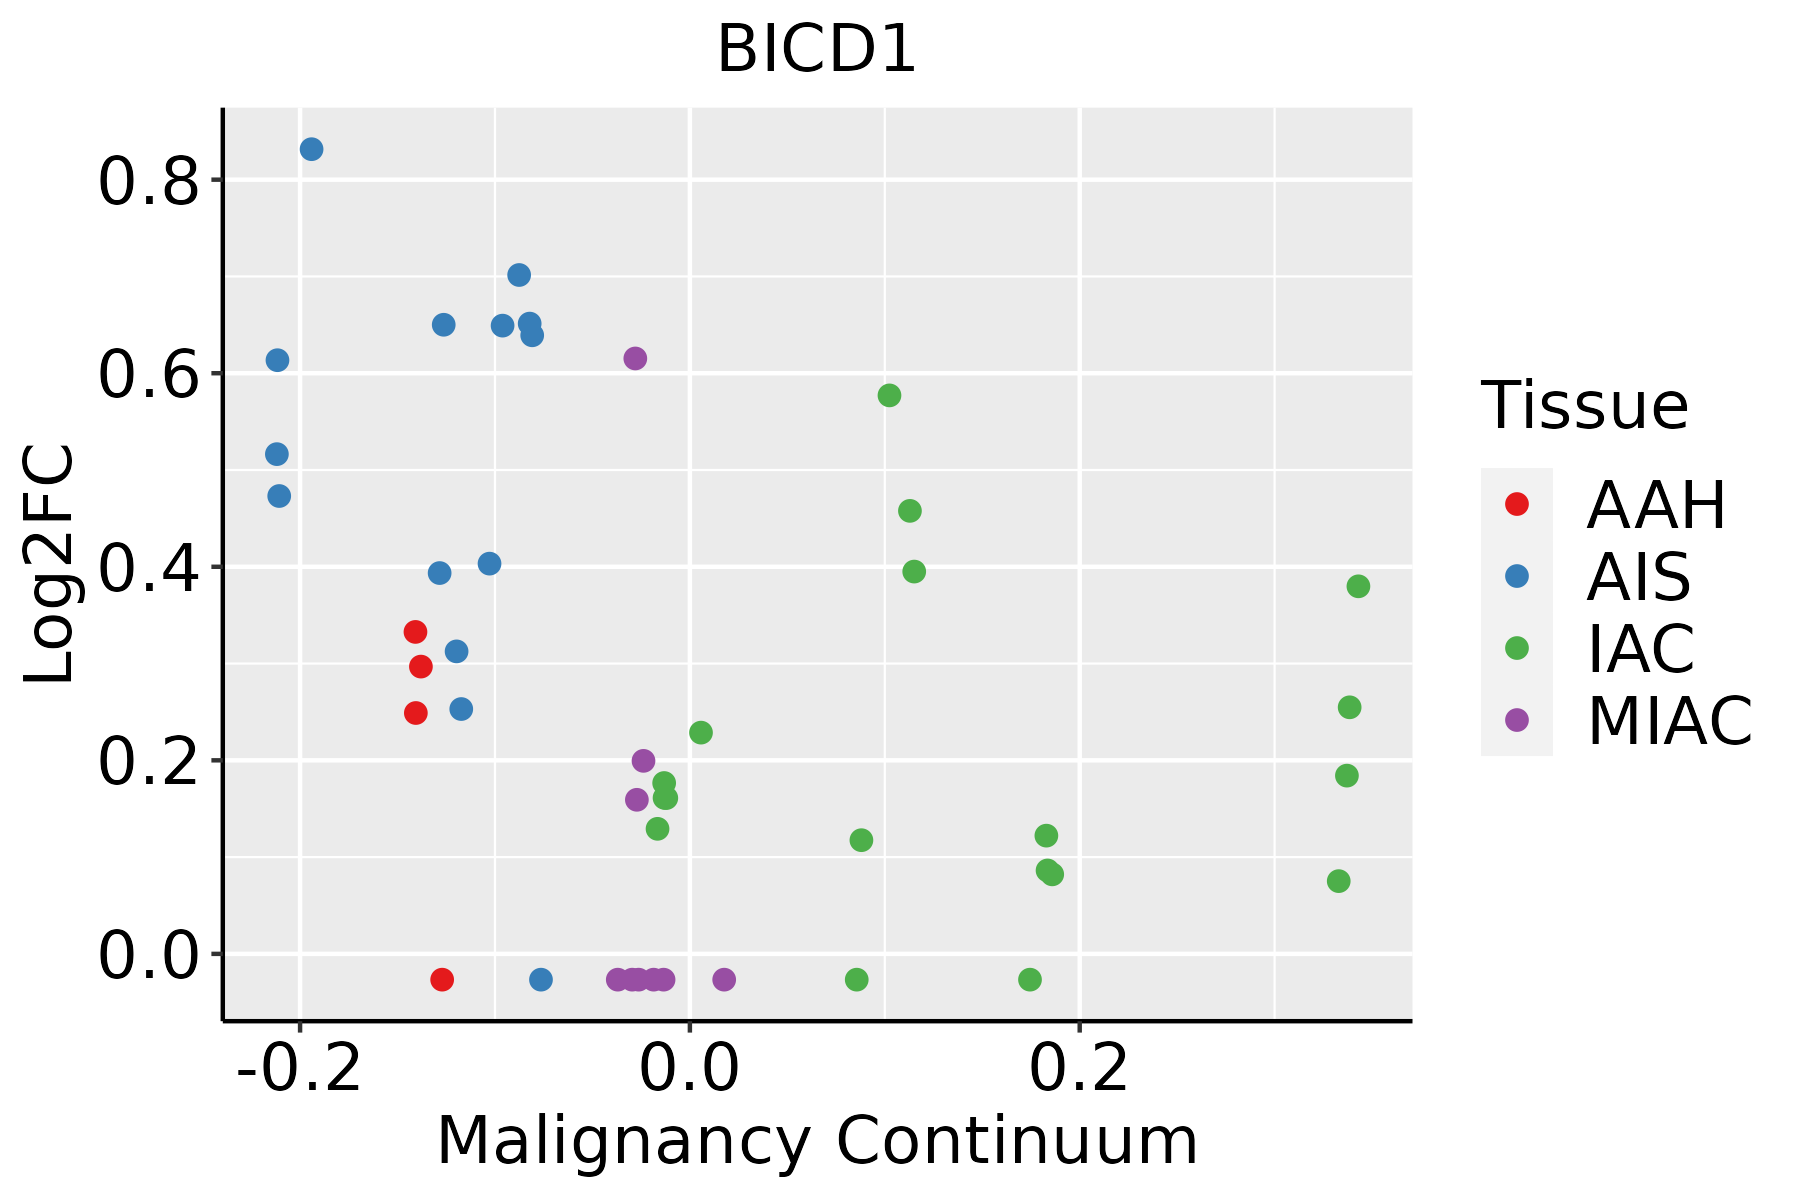 | AAH: Atypical adenomatous hyperplasia |
| AIS: Adenocarcinoma in situ |
| IAC: Invasive lung adenocarcinoma |
| MIA: Minimally invasive adenocarcinoma |
| Thyroid | 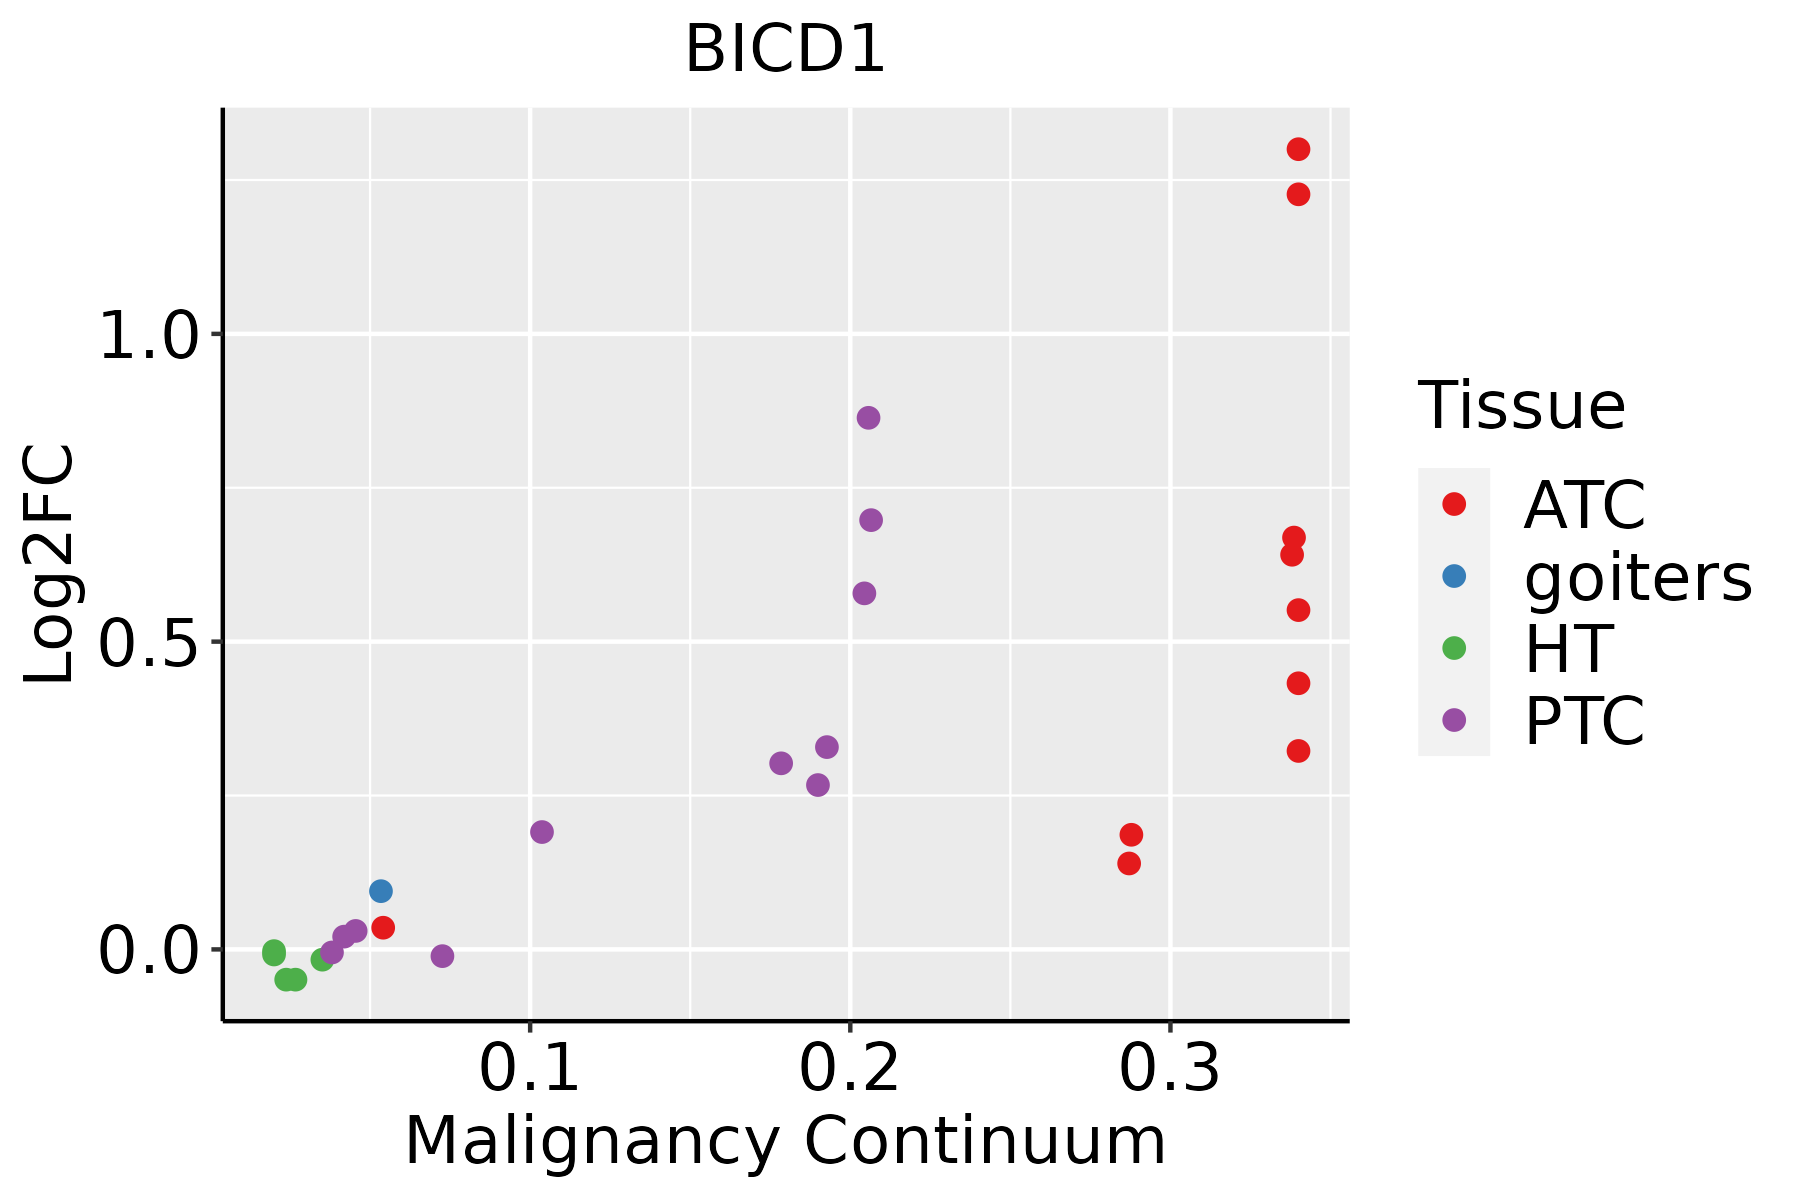 | ATC: Anaplastic thyroid cancer |
| HT: Hashimoto's thyroiditis |
| PTC: Papillary thyroid cancer |
| GO ID | Tissue | Disease Stage | Description | Gene Ratio | Bg Ratio | pvalue | p.adjust | Count |
| GO:0016032 | Colorectum | AD | viral process | 168/3918 | 415/18723 | 4.67e-20 | 3.66e-17 | 168 |
| GO:1903829 | Colorectum | AD | positive regulation of cellular protein localization | 110/3918 | 276/18723 | 4.58e-13 | 8.44e-11 | 110 |
| GO:0051656 | Colorectum | AD | establishment of organelle localization | 131/3918 | 390/18723 | 3.00e-09 | 2.06e-07 | 131 |
| GO:0006403 | Colorectum | AD | RNA localization | 71/3918 | 201/18723 | 1.54e-06 | 4.76e-05 | 71 |
| GO:0006898 | Colorectum | AD | receptor-mediated endocytosis | 76/3918 | 244/18723 | 1.07e-04 | 1.59e-03 | 76 |
| GO:0030100 | Colorectum | AD | regulation of endocytosis | 67/3918 | 211/18723 | 1.42e-04 | 2.01e-03 | 67 |
| GO:0071539 | Colorectum | AD | protein localization to centrosome | 16/3918 | 33/18723 | 3.86e-04 | 4.41e-03 | 16 |
| GO:0030705 | Colorectum | AD | cytoskeleton-dependent intracellular transport | 60/3918 | 195/18723 | 7.56e-04 | 7.59e-03 | 60 |
| GO:0045807 | Colorectum | AD | positive regulation of endocytosis | 35/3918 | 100/18723 | 7.78e-04 | 7.78e-03 | 35 |
| GO:1905508 | Colorectum | AD | protein localization to microtubule organizing center | 16/3918 | 35/18723 | 8.76e-04 | 8.51e-03 | 16 |
| GO:0048260 | Colorectum | AD | positive regulation of receptor-mediated endocytosis | 20/3918 | 52/18723 | 2.87e-03 | 2.14e-02 | 20 |
| GO:0048259 | Colorectum | AD | regulation of receptor-mediated endocytosis | 35/3918 | 110/18723 | 4.85e-03 | 3.27e-02 | 35 |
| GO:0072384 | Colorectum | AD | organelle transport along microtubule | 28/3918 | 85/18723 | 6.55e-03 | 4.07e-02 | 28 |
| GO:0070507 | Colorectum | AD | regulation of microtubule cytoskeleton organization | 44/3918 | 148/18723 | 7.05e-03 | 4.31e-02 | 44 |
| GO:00160322 | Colorectum | MSS | viral process | 157/3467 | 415/18723 | 7.94e-21 | 6.19e-18 | 157 |
| GO:19038292 | Colorectum | MSS | positive regulation of cellular protein localization | 103/3467 | 276/18723 | 1.12e-13 | 2.67e-11 | 103 |
| GO:00064032 | Colorectum | MSS | RNA localization | 69/3467 | 201/18723 | 6.33e-08 | 3.26e-06 | 69 |
| GO:00516562 | Colorectum | MSS | establishment of organelle localization | 115/3467 | 390/18723 | 7.30e-08 | 3.67e-06 | 115 |
| GO:00301002 | Colorectum | MSS | regulation of endocytosis | 63/3467 | 211/18723 | 4.05e-05 | 7.66e-04 | 63 |
| GO:00715391 | Colorectum | MSS | protein localization to centrosome | 16/3467 | 33/18723 | 8.66e-05 | 1.40e-03 | 16 |
| Hugo Symbol | Variant Class | Variant Classification | dbSNP RS | HGVSc | HGVSp | HGVSp Short | SWISSPROT | BIOTYPE | SIFT | PolyPhen | Tumor Sample Barcode | Tissue | Histology | Sex | Age | Stage | Therapy Types | Drugs | Outcome |
| BICD1 | SNV | Missense_Mutation | | c.316N>G | p.Leu106Val | p.L106V | Q96G01 | protein_coding | tolerated(0.38) | possibly_damaging(0.468) | TCGA-A2-A0CX-01 | Breast | breast invasive carcinoma | Female | <65 | I/II | Chemotherapy | adriamycin | SD |
| BICD1 | SNV | Missense_Mutation | | c.751N>C | p.Glu251Gln | p.E251Q | Q96G01 | protein_coding | deleterious(0.01) | possibly_damaging(0.809) | TCGA-AC-A23H-01 | Breast | breast invasive carcinoma | Female | >=65 | I/II | Unknown | Unknown | PD |
| BICD1 | SNV | Missense_Mutation | | c.1861G>C | p.Glu621Gln | p.E621Q | Q96G01 | protein_coding | deleterious(0) | probably_damaging(0.998) | TCGA-BH-A0BA-01 | Breast | breast invasive carcinoma | Female | <65 | III/IV | Chemotherapy | cytoxan | SD |
| BICD1 | deletion | Frame_Shift_Del | novel | c.1190delN | p.Asp398ThrfsTer16 | p.D398Tfs*16 | Q96G01 | protein_coding | | | TCGA-D8-A27V-01 | Breast | breast invasive carcinoma | Female | <65 | I/II | Hormone Therapy | tamoxiphen | SD |
| BICD1 | SNV | Missense_Mutation | rs756217437 | c.490N>T | p.Arg164Trp | p.R164W | Q96G01 | protein_coding | deleterious(0) | probably_damaging(1) | TCGA-2W-A8YY-01 | Cervix | cervical & endocervical cancer | Female | <65 | I/II | Chemotherapy | cisplatin | CR |
| BICD1 | SNV | Missense_Mutation | | c.1958N>C | p.Arg653Thr | p.R653T | Q96G01 | protein_coding | deleterious(0) | possibly_damaging(0.572) | TCGA-EK-A2RB-01 | Cervix | cervical & endocervical cancer | Female | <65 | I/II | Unknown | Unknown | SD |
| BICD1 | SNV | Missense_Mutation | rs757213231 | c.2792N>T | p.Pro931Leu | p.P931L | Q96G01 | protein_coding | tolerated_low_confidence(0.06) | benign(0.198) | TCGA-MA-AA42-01 | Cervix | cervical & endocervical cancer | Female | >=65 | I/II | Unknown | Unknown | SD |
| BICD1 | SNV | Missense_Mutation | | c.58C>A | p.Leu20Ile | p.L20I | Q96G01 | protein_coding | deleterious(0) | probably_damaging(0.952) | TCGA-AA-3663-01 | Colorectum | colon adenocarcinoma | Male | <65 | I/II | Unknown | Unknown | SD |
| BICD1 | SNV | Missense_Mutation | | c.1813N>G | p.Thr605Ala | p.T605A | Q96G01 | protein_coding | tolerated(0.56) | benign(0.009) | TCGA-AA-3811-01 | Colorectum | colon adenocarcinoma | Female | >=65 | III/IV | Unknown | Unknown | PD |
| BICD1 | SNV | Missense_Mutation | | c.2528N>C | p.Gln843Pro | p.Q843P | Q96G01 | protein_coding | tolerated_low_confidence(0.1) | benign(0.374) | TCGA-AA-3815-01 | Colorectum | colon adenocarcinoma | Female | >=65 | I/II | Unknown | Unknown | SD |


