
|
|||||
|
 | |
| |
| |
| |
| |
| |
|
Gene: BARX2 |
Gene summary for BARX2 |
| Gene information | Species | Human | Gene symbol | BARX2 | Gene ID | 8538 |
| Gene name | BARX homeobox 2 | |
| Gene Alias | BARX2 | |
| Cytomap | 11q24.3 | |
| Gene Type | protein-coding | GO ID | GO:0000122 | UniProtAcc | Q9UMQ3 |
Top |
Malignant transformation analysis |
| Identification of the aberrant gene expression in precancerous and cancerous lesions by comparing the gene expression of stem-like cells in diseased tissues with normal stem cells |
| Entrez ID | Symbol | Replicates | Species | Organ | Tissue | Adj P-value | Log2FC | Malignancy |
| 8538 | BARX2 | P38T-E | Human | Esophagus | ESCC | 2.29e-04 | 1.34e-01 | 0.127 |
| 8538 | BARX2 | P39T-E | Human | Esophagus | ESCC | 3.97e-04 | -2.64e-01 | 0.0894 |
| 8538 | BARX2 | P42T-E | Human | Esophagus | ESCC | 2.20e-05 | -3.73e-02 | 0.1175 |
| 8538 | BARX2 | P44T-E | Human | Esophagus | ESCC | 1.37e-03 | -4.00e-02 | 0.1096 |
| 8538 | BARX2 | P47T-E | Human | Esophagus | ESCC | 2.46e-03 | -2.23e-01 | 0.1067 |
| 8538 | BARX2 | P61T-E | Human | Esophagus | ESCC | 1.33e-03 | -2.64e-01 | 0.099 |
| 8538 | BARX2 | P62T-E | Human | Esophagus | ESCC | 2.51e-19 | 2.91e-01 | 0.1302 |
| 8538 | BARX2 | P65T-E | Human | Esophagus | ESCC | 7.29e-03 | -2.31e-01 | 0.0978 |
| 8538 | BARX2 | P74T-E | Human | Esophagus | ESCC | 2.24e-09 | 7.61e-02 | 0.1479 |
| 8538 | BARX2 | P75T-E | Human | Esophagus | ESCC | 3.73e-04 | -1.95e-01 | 0.1125 |
| 8538 | BARX2 | P76T-E | Human | Esophagus | ESCC | 4.84e-06 | -1.05e-01 | 0.1207 |
| 8538 | BARX2 | P79T-E | Human | Esophagus | ESCC | 2.91e-05 | -4.26e-02 | 0.1154 |
| 8538 | BARX2 | P80T-E | Human | Esophagus | ESCC | 4.35e-22 | 7.67e-01 | 0.155 |
| 8538 | BARX2 | P83T-E | Human | Esophagus | ESCC | 1.68e-07 | 2.48e-02 | 0.1738 |
| 8538 | BARX2 | P89T-E | Human | Esophagus | ESCC | 1.05e-04 | 5.44e-01 | 0.1752 |
| 8538 | BARX2 | P107T-E | Human | Esophagus | ESCC | 6.70e-04 | 1.41e-01 | 0.171 |
| 8538 | BARX2 | P127T-E | Human | Esophagus | ESCC | 3.93e-04 | -1.52e-01 | 0.0826 |
| 8538 | BARX2 | P128T-E | Human | Esophagus | ESCC | 5.82e-03 | 1.19e-01 | 0.1241 |
| 8538 | BARX2 | P130T-E | Human | Esophagus | ESCC | 2.17e-09 | -4.85e-02 | 0.1676 |
| 8538 | BARX2 | P1_S1_AK | Human | Skin | AK | 1.25e-27 | 7.54e-01 | -0.3399 |
| Page: 1 2 3 |
| Tissue | Expression Dynamics | Abbreviation |
| Esophagus |  | ESCC: Esophageal squamous cell carcinoma |
| HGIN: High-grade intraepithelial neoplasias | ||
| LGIN: Low-grade intraepithelial neoplasias | ||
| Skin | 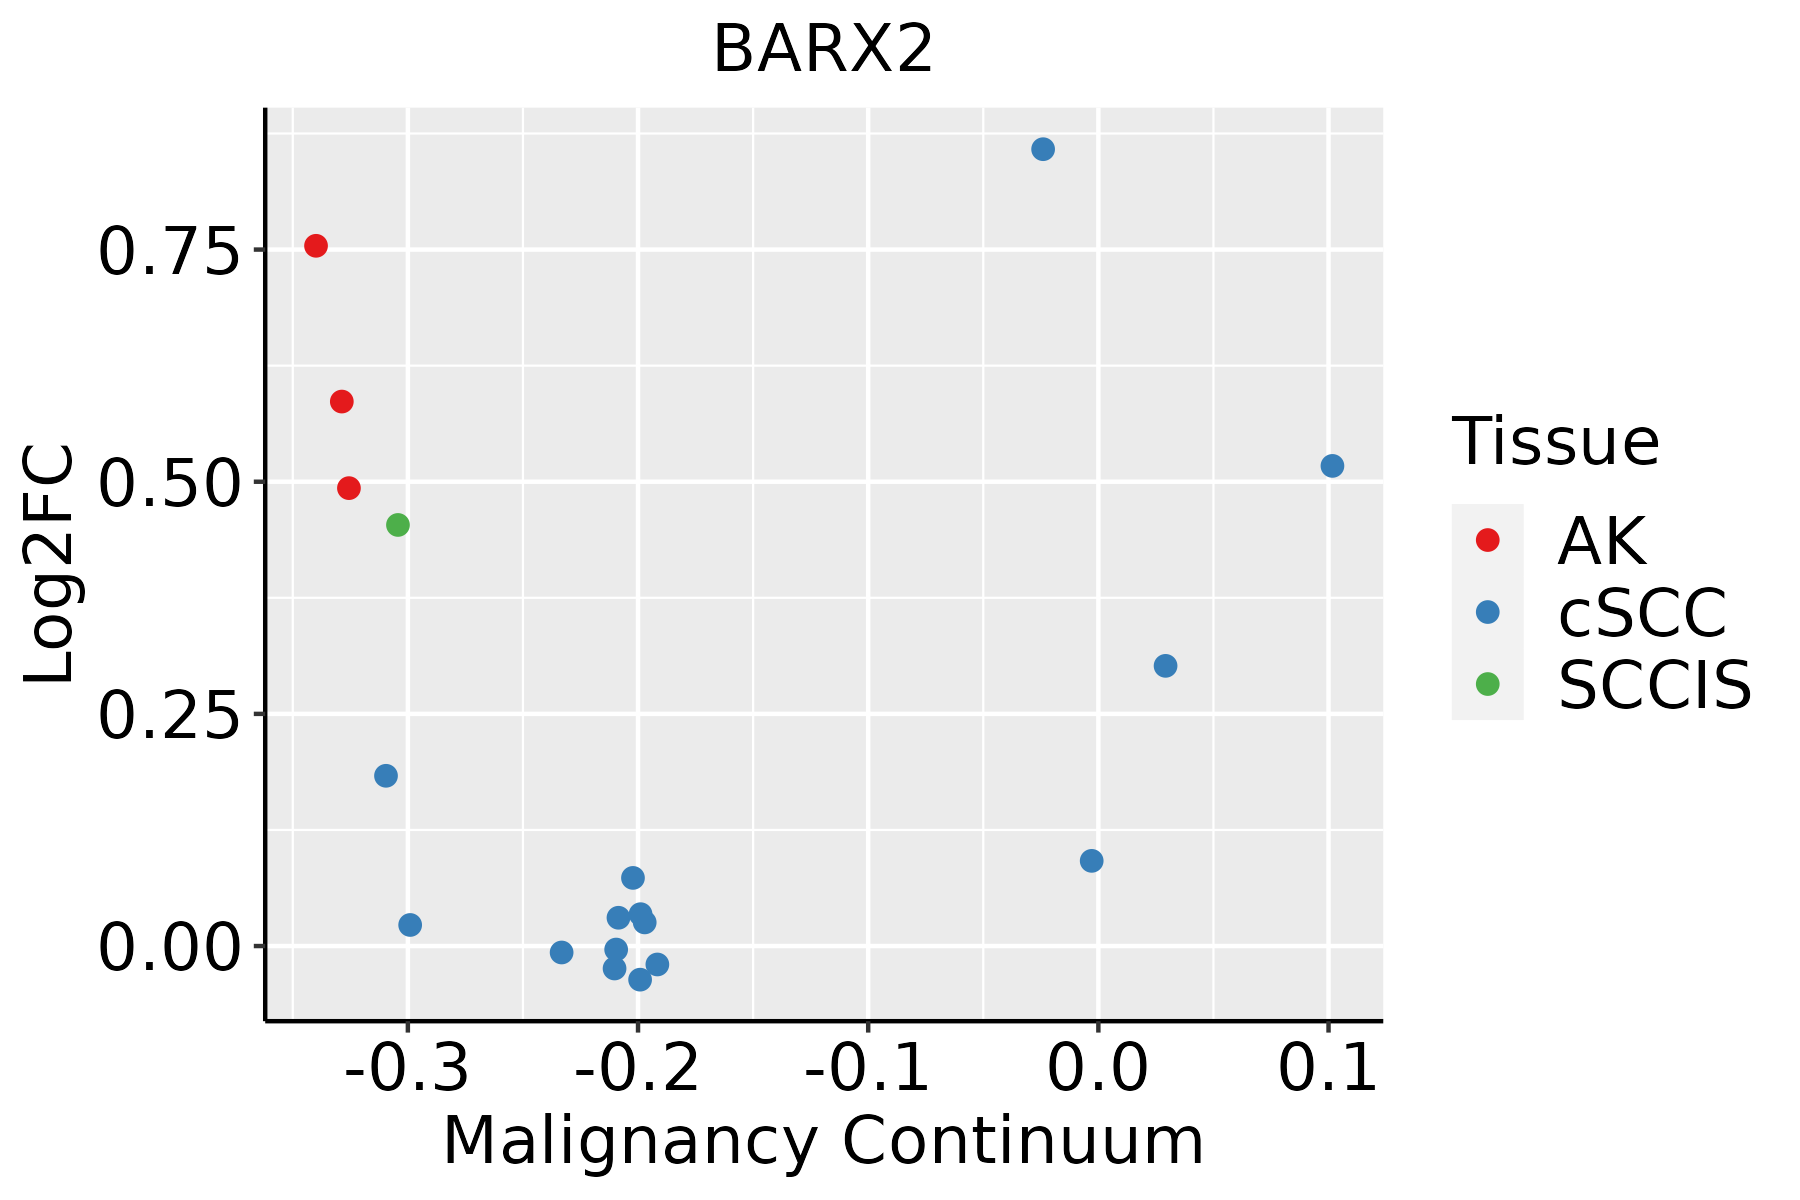 | AK: Actinic keratosis |
| cSCC: Cutaneous squamous cell carcinoma | ||
| SCCIS:squamous cell carcinoma in situ |
| ∗log2FC in expression of this searched gene in stem-like cells from each diseased tissue sample relative to stem-like cells in normal samples in each tissue plotted against the malignancy continuum. Samples are colored based on if they are from different disease stage. |
Top |
Malignant transformation related pathway analysis |
| Find out the enriched GO biological processes and KEGG pathways involved in transition from healthy to precancer to cancer |
| Tissue | Disease Stage | Enriched GO biological Processes |
| Colorectum | AD |  |
| Colorectum | SER |  |
| Colorectum | MSS |  |
| Colorectum | MSI-H |  |
| Colorectum | FAP |  |
| ∗Top 15 enriched GO BP terms are showed in the bar plot of each disease state in each tissue. Each row represents a significant GO biological process which is colored according to the -log10(p.adjust). |
| Page: 1 2 3 4 5 6 7 8 9 |
| GO ID | Tissue | Disease Stage | Description | Gene Ratio | Bg Ratio | pvalue | p.adjust | Count |
| GO:00487052 | Esophagus | ESCC | skeletal system morphogenesis | 120/8552 | 220/18723 | 4.90e-03 | 1.89e-02 | 120 |
| GO:00512161 | Esophagus | ESCC | cartilage development | 103/8552 | 190/18723 | 1.08e-02 | 3.67e-02 | 103 |
| GO:00426928 | Skin | AK | muscle cell differentiation | 64/1910 | 384/18723 | 5.51e-05 | 8.38e-04 | 64 |
| GO:00614483 | Skin | AK | connective tissue development | 40/1910 | 252/18723 | 3.17e-03 | 1.95e-02 | 40 |
| GO:00512162 | Skin | AK | cartilage development | 31/1910 | 190/18723 | 5.79e-03 | 3.14e-02 | 31 |
| GO:00511468 | Skin | AK | striated muscle cell differentiation | 42/1910 | 283/18723 | 8.46e-03 | 4.19e-02 | 42 |
| GO:004269215 | Skin | SCCIS | muscle cell differentiation | 37/919 | 384/18723 | 7.38e-05 | 1.71e-03 | 37 |
| GO:005114616 | Skin | SCCIS | striated muscle cell differentiation | 25/919 | 283/18723 | 3.38e-03 | 3.01e-02 | 25 |
| GO:005121611 | Skin | SCCIS | cartilage development | 18/919 | 190/18723 | 5.86e-03 | 4.52e-02 | 18 |
| GO:006144811 | Skin | SCCIS | connective tissue development | 22/919 | 252/18723 | 6.57e-03 | 4.89e-02 | 22 |
| Page: 1 |
| Pathway ID | Tissue | Disease Stage | Description | Gene Ratio | Bg Ratio | pvalue | p.adjust | qvalue | Count |
| Page: 1 |
Top |
Cell-cell communication analysis |
| Identification of potential cell-cell interactions between two cell types and their ligand-receptor pairs for different disease states |
| Ligand | Receptor | LRpair | Pathway | Tissue | Disease Stage |
| Page: 1 |
Top |
Single-cell gene regulatory network inference analysis |
| Find out the significant the regulons (TFs) and the target genes of each regulon across cell types for different disease states |
| TF | Cell Type | Tissue | Disease Stage | Target Gene | RSS | Regulon Activity |
| BARX2 | TRANS | Cervix | Healthy | LY6D,CRABP2,KRT13, etc. | 2.62e-01 |  |
| BARX2 | IMENT | Colorectum | Healthy | ZNF622,SEMA3C,CA13, etc. | 3.12e-01 |  |
| ∗The dot plots of a searched regulon are shown for all cell subpopulations in each disease state of each tissue based on the regulon specific score inferred using pySCENIC and by calculating the average expression. |
| Page: 1 |
Top |
Somatic mutation of malignant transformation related genes |
| Annotation of somatic variants for genes involved in malignant transformation |
| Hugo Symbol | Variant Class | Variant Classification | dbSNP RS | HGVSc | HGVSp | HGVSp Short | SWISSPROT | BIOTYPE | SIFT | PolyPhen | Tumor Sample Barcode | Tissue | Histology | Sex | Age | Stage | Therapy Types | Drugs | Outcome |
| BARX2 | SNV | Missense_Mutation | novel | c.569N>C | p.Lys190Thr | p.K190T | Q9UMQ3 | protein_coding | deleterious(0) | probably_damaging(0.998) | TCGA-AN-A046-01 | Breast | breast invasive carcinoma | Female | >=65 | I/II | Unknown | Unknown | SD |
| BARX2 | SNV | Missense_Mutation | rs551250441 | c.221N>T | p.Ser74Leu | p.S74L | Q9UMQ3 | protein_coding | deleterious(0) | probably_damaging(0.992) | TCGA-AN-A0XV-01 | Breast | breast invasive carcinoma | Female | >=65 | III/IV | Unknown | Unknown | SD |
| BARX2 | SNV | Missense_Mutation | novel | c.212N>T | p.Pro71Leu | p.P71L | Q9UMQ3 | protein_coding | deleterious(0) | probably_damaging(0.998) | TCGA-EW-A2FR-01 | Breast | breast invasive carcinoma | Female | <65 | III/IV | Chemotherapy | epirubicin | SD |
| BARX2 | insertion | Nonsense_Mutation | novel | c.259_260insGCCTAGCTAGAAGTGTACTCAAAGAATAAGAGAAGCTATT | p.Val87GlyfsTer10 | p.V87Gfs*10 | Q9UMQ3 | protein_coding | TCGA-B6-A0RE-01 | Breast | breast invasive carcinoma | Female | <65 | I/II | Unknown | Unknown | SD | ||
| BARX2 | SNV | Missense_Mutation | rs867138901 | c.340N>A | p.Glu114Lys | p.E114K | Q9UMQ3 | protein_coding | tolerated(0.49) | benign(0.053) | TCGA-IR-A3LK-01 | Cervix | cervical & endocervical cancer | Female | >=65 | I/II | Chemotherapy | cisplatin | PD |
| BARX2 | SNV | Missense_Mutation | c.102N>T | p.Glu34Asp | p.E34D | Q9UMQ3 | protein_coding | tolerated(0.05) | probably_damaging(0.967) | TCGA-AA-A010-01 | Colorectum | colon adenocarcinoma | Female | <65 | I/II | Chemotherapy | folinic | CR | |
| BARX2 | SNV | Missense_Mutation | rs769021373 | c.616N>T | p.Arg206Cys | p.R206C | Q9UMQ3 | protein_coding | deleterious(0) | probably_damaging(0.996) | TCGA-A5-A2K3-01 | Endometrium | uterine corpus endometrioid carcinoma | Female | >=65 | I/II | Chemotherapy | carboplatin | SD |
| BARX2 | SNV | Missense_Mutation | rs376626609 | c.818N>T | p.Ser273Leu | p.S273L | Q9UMQ3 | protein_coding | tolerated_low_confidence(0.2) | benign(0) | TCGA-A5-A2K5-01 | Endometrium | uterine corpus endometrioid carcinoma | Female | >=65 | I/II | Unknown | Unknown | SD |
| BARX2 | SNV | Missense_Mutation | c.56N>T | p.Arg19Met | p.R19M | Q9UMQ3 | protein_coding | deleterious_low_confidence(0) | probably_damaging(0.994) | TCGA-AP-A051-01 | Endometrium | uterine corpus endometrioid carcinoma | Female | >=65 | I/II | Unknown | Unknown | SD | |
| BARX2 | SNV | Missense_Mutation | c.358N>A | p.Glu120Lys | p.E120K | Q9UMQ3 | protein_coding | tolerated(0.07) | probably_damaging(0.986) | TCGA-AP-A056-01 | Endometrium | uterine corpus endometrioid carcinoma | Female | <65 | I/II | Unknown | Unknown | SD |
| Page: 1 2 3 |
Top |
Related drugs of malignant transformation related genes |
| Identification of chemicals and drugs interact with genes involved in malignant transfromation |
| (DGIdb 4.0) |
| Entrez ID | Symbol | Category | Interaction Types | Drug Claim Name | Drug Name | PMIDs |
| Page: 1 |

Copyright 2023-Present -The University of Texas Health Science Center at Houston |