
|
|||||
|
 | |
| |
| |
| |
| |
| |
|
Gene: ATG101 |
Gene summary for ATG101 |
| Gene information | Species | Human | Gene symbol | ATG101 | Gene ID | 60673 |
| Gene name | autophagy related 101 | |
| Gene Alias | C12orf44 | |
| Cytomap | 12q13.13 | |
| Gene Type | protein-coding | GO ID | GO:0000045 | UniProtAcc | A0A024R128 |
Top |
Malignant transformation analysis |
| Identification of the aberrant gene expression in precancerous and cancerous lesions by comparing the gene expression of stem-like cells in diseased tissues with normal stem cells |
| Entrez ID | Symbol | Replicates | Species | Organ | Tissue | Adj P-value | Log2FC | Malignancy |
| 60673 | ATG101 | P21T-E | Human | Esophagus | ESCC | 1.13e-32 | 7.91e-01 | 0.1617 |
| 60673 | ATG101 | P22T-E | Human | Esophagus | ESCC | 3.41e-20 | 3.44e-01 | 0.1236 |
| 60673 | ATG101 | P23T-E | Human | Esophagus | ESCC | 7.09e-33 | 1.13e+00 | 0.108 |
| 60673 | ATG101 | P24T-E | Human | Esophagus | ESCC | 2.41e-34 | 8.57e-01 | 0.1287 |
| 60673 | ATG101 | P26T-E | Human | Esophagus | ESCC | 8.50e-48 | 9.83e-01 | 0.1276 |
| 60673 | ATG101 | P27T-E | Human | Esophagus | ESCC | 1.34e-35 | 9.08e-01 | 0.1055 |
| 60673 | ATG101 | P28T-E | Human | Esophagus | ESCC | 5.73e-34 | 8.83e-01 | 0.1149 |
| 60673 | ATG101 | P30T-E | Human | Esophagus | ESCC | 3.80e-17 | 9.49e-01 | 0.137 |
| 60673 | ATG101 | P31T-E | Human | Esophagus | ESCC | 1.99e-25 | 5.73e-01 | 0.1251 |
| 60673 | ATG101 | P32T-E | Human | Esophagus | ESCC | 5.92e-41 | 8.81e-01 | 0.1666 |
| 60673 | ATG101 | P36T-E | Human | Esophagus | ESCC | 2.59e-16 | 7.39e-01 | 0.1187 |
| 60673 | ATG101 | P37T-E | Human | Esophagus | ESCC | 1.98e-15 | 5.75e-01 | 0.1371 |
| 60673 | ATG101 | P38T-E | Human | Esophagus | ESCC | 4.11e-10 | 4.10e-01 | 0.127 |
| 60673 | ATG101 | P39T-E | Human | Esophagus | ESCC | 2.23e-27 | 5.83e-01 | 0.0894 |
| 60673 | ATG101 | P40T-E | Human | Esophagus | ESCC | 8.99e-15 | 4.58e-01 | 0.109 |
| 60673 | ATG101 | P42T-E | Human | Esophagus | ESCC | 2.30e-09 | 6.96e-01 | 0.1175 |
| 60673 | ATG101 | P44T-E | Human | Esophagus | ESCC | 1.83e-08 | 2.82e-01 | 0.1096 |
| 60673 | ATG101 | P47T-E | Human | Esophagus | ESCC | 3.69e-22 | 5.91e-01 | 0.1067 |
| 60673 | ATG101 | P48T-E | Human | Esophagus | ESCC | 5.85e-16 | 5.13e-01 | 0.0959 |
| 60673 | ATG101 | P49T-E | Human | Esophagus | ESCC | 1.13e-07 | 1.37e+00 | 0.1768 |
| Page: 1 2 3 4 5 6 7 |
| Tissue | Expression Dynamics | Abbreviation |
| Esophagus | 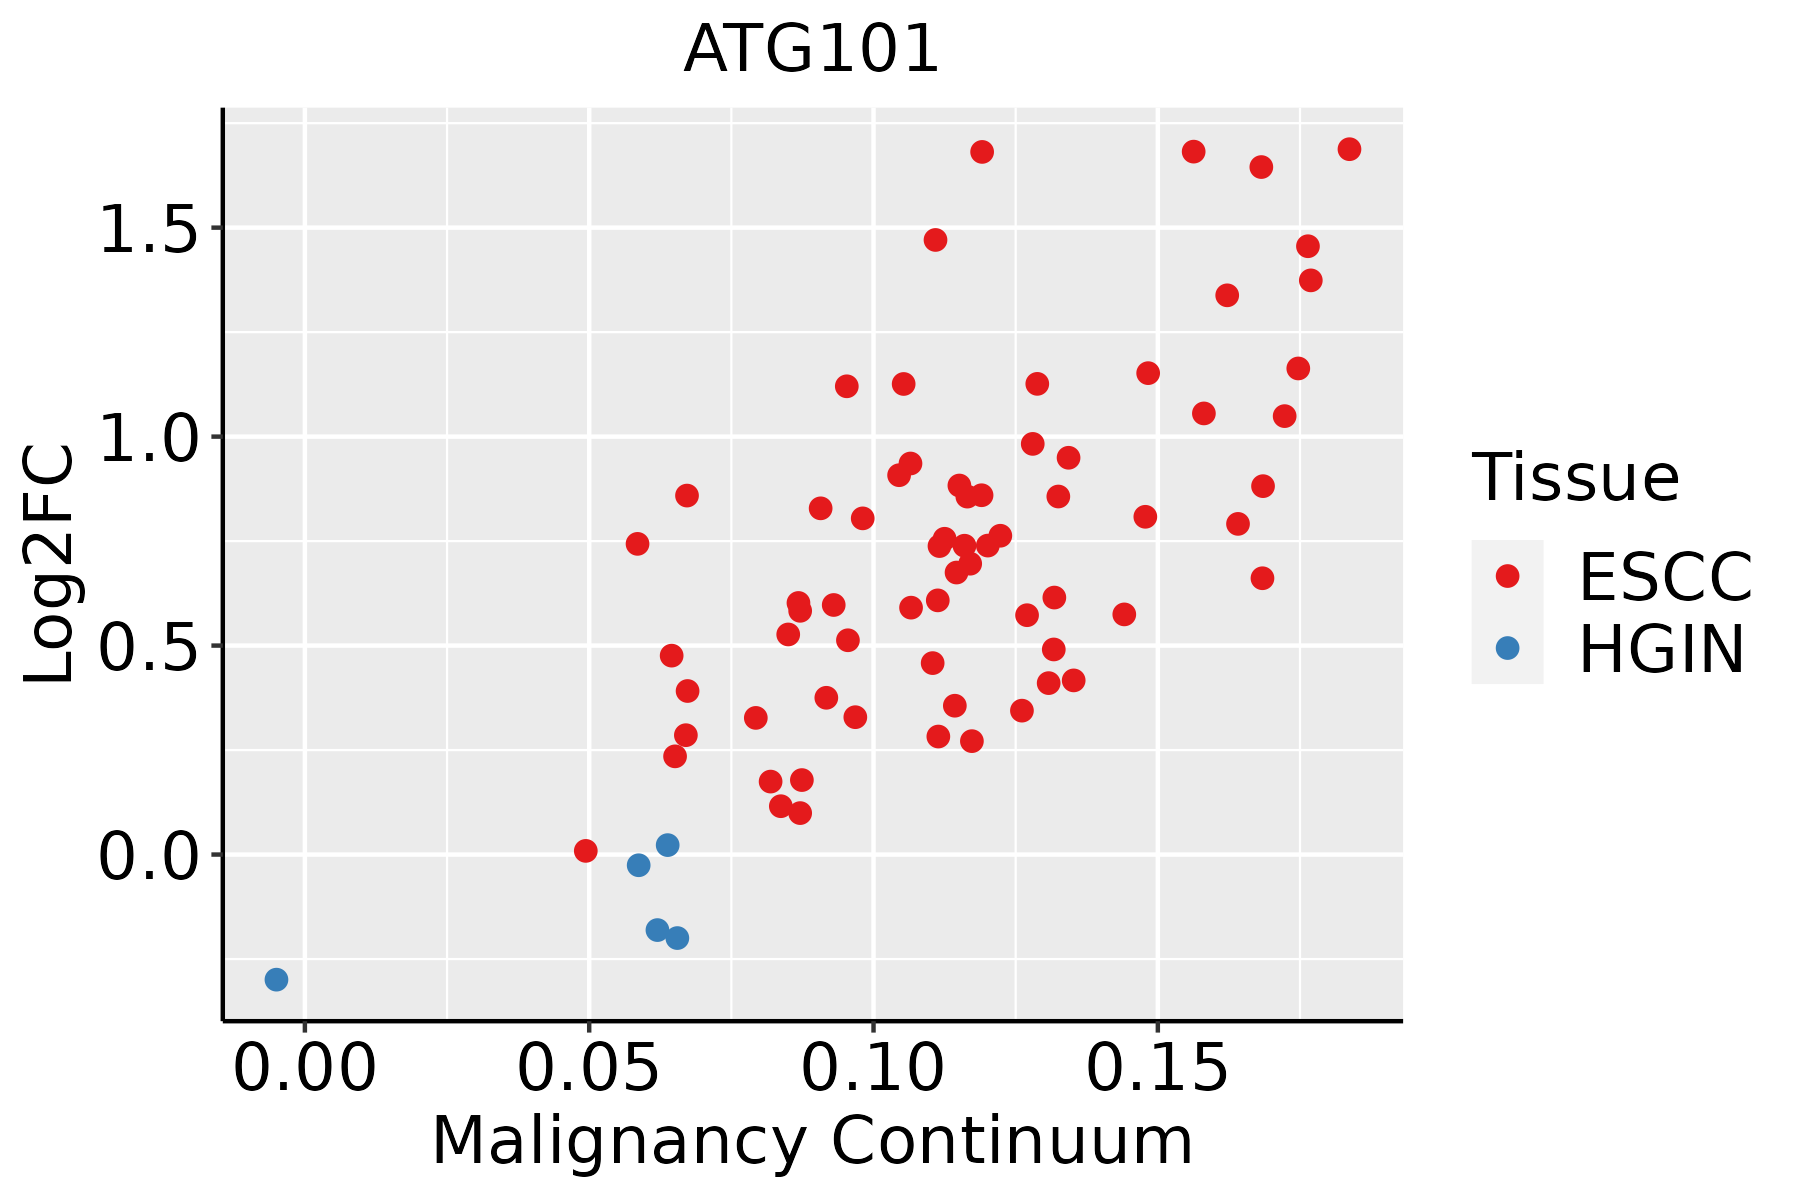 | ESCC: Esophageal squamous cell carcinoma |
| HGIN: High-grade intraepithelial neoplasias | ||
| LGIN: Low-grade intraepithelial neoplasias | ||
| Liver |  | HCC: Hepatocellular carcinoma |
| NAFLD: Non-alcoholic fatty liver disease | ||
| Oral Cavity | 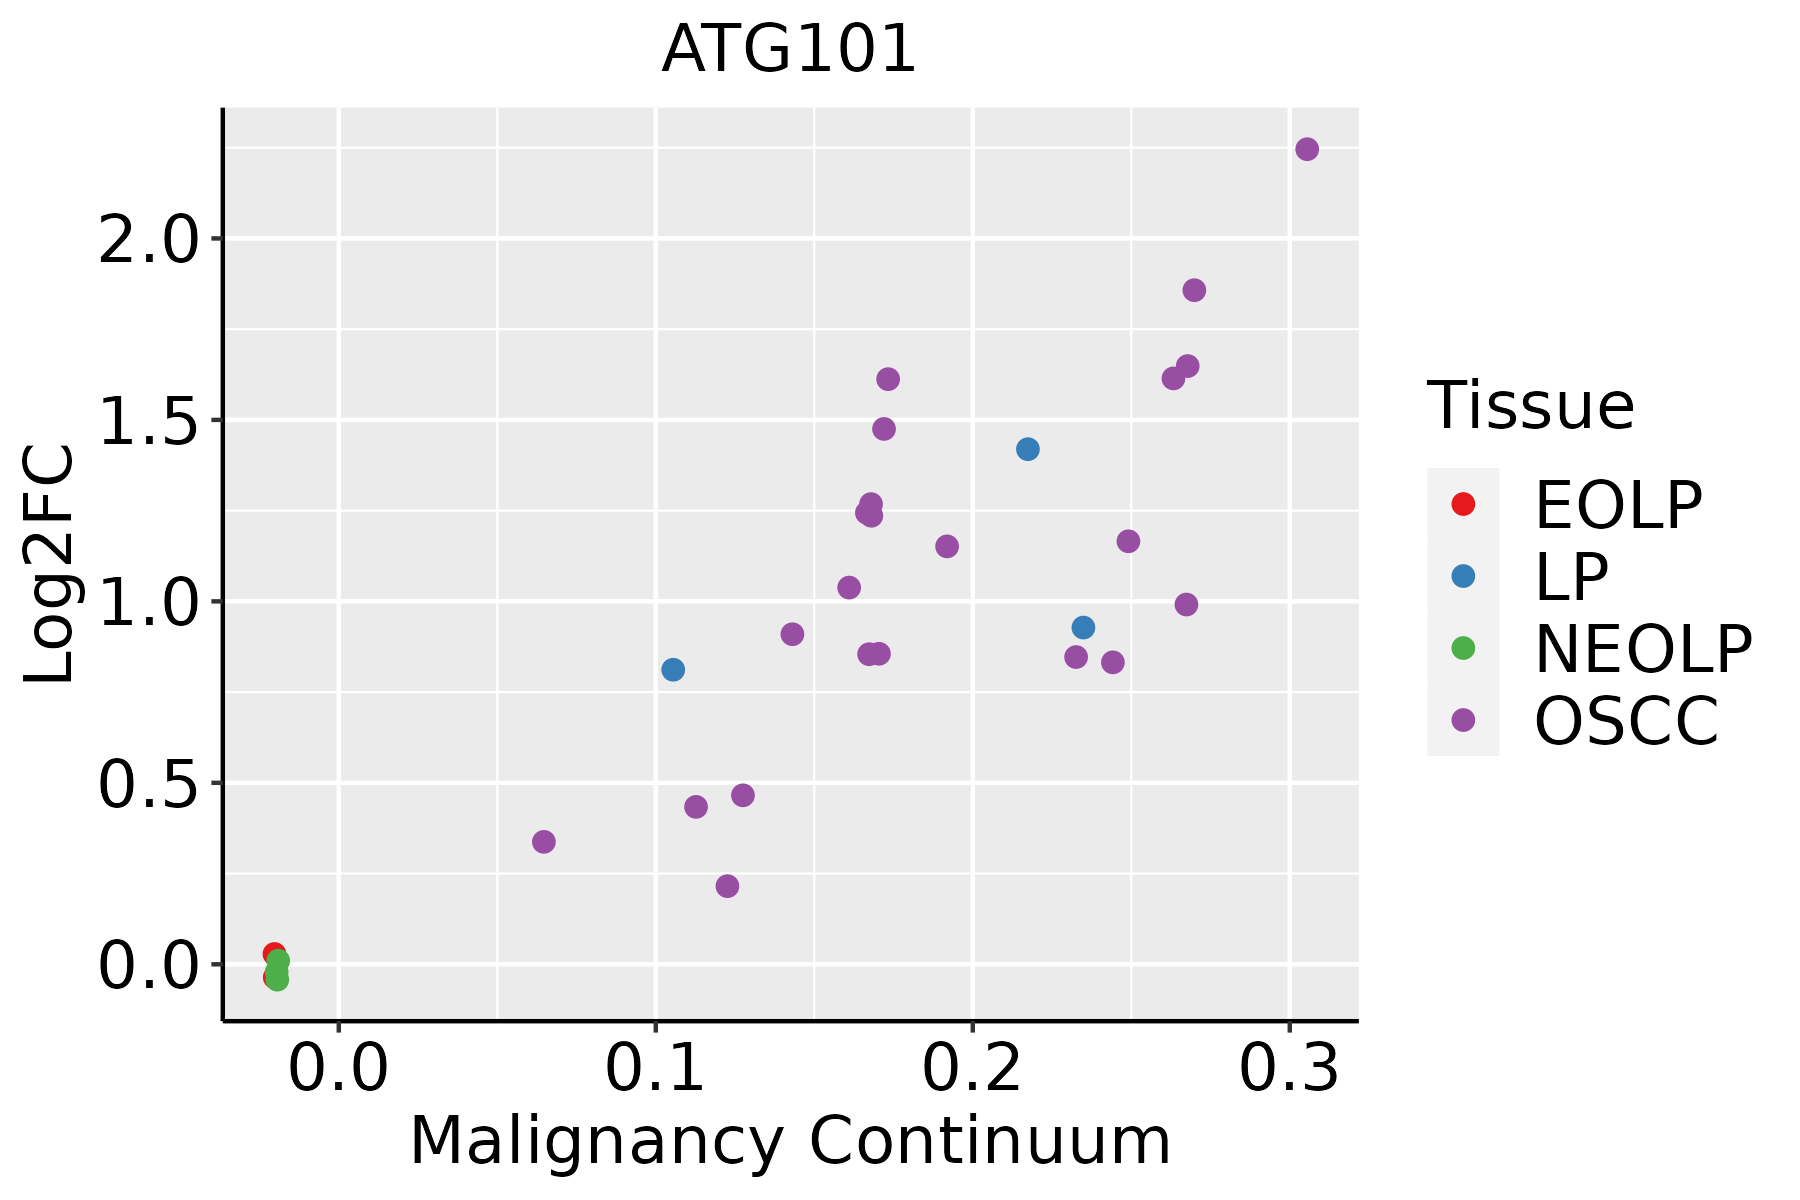 | EOLP: Erosive Oral lichen planus |
| LP: leukoplakia | ||
| NEOLP: Non-erosive oral lichen planus | ||
| OSCC: Oral squamous cell carcinoma | ||
| Prostate |  | BPH: Benign Prostatic Hyperplasia |
| Thyroid | 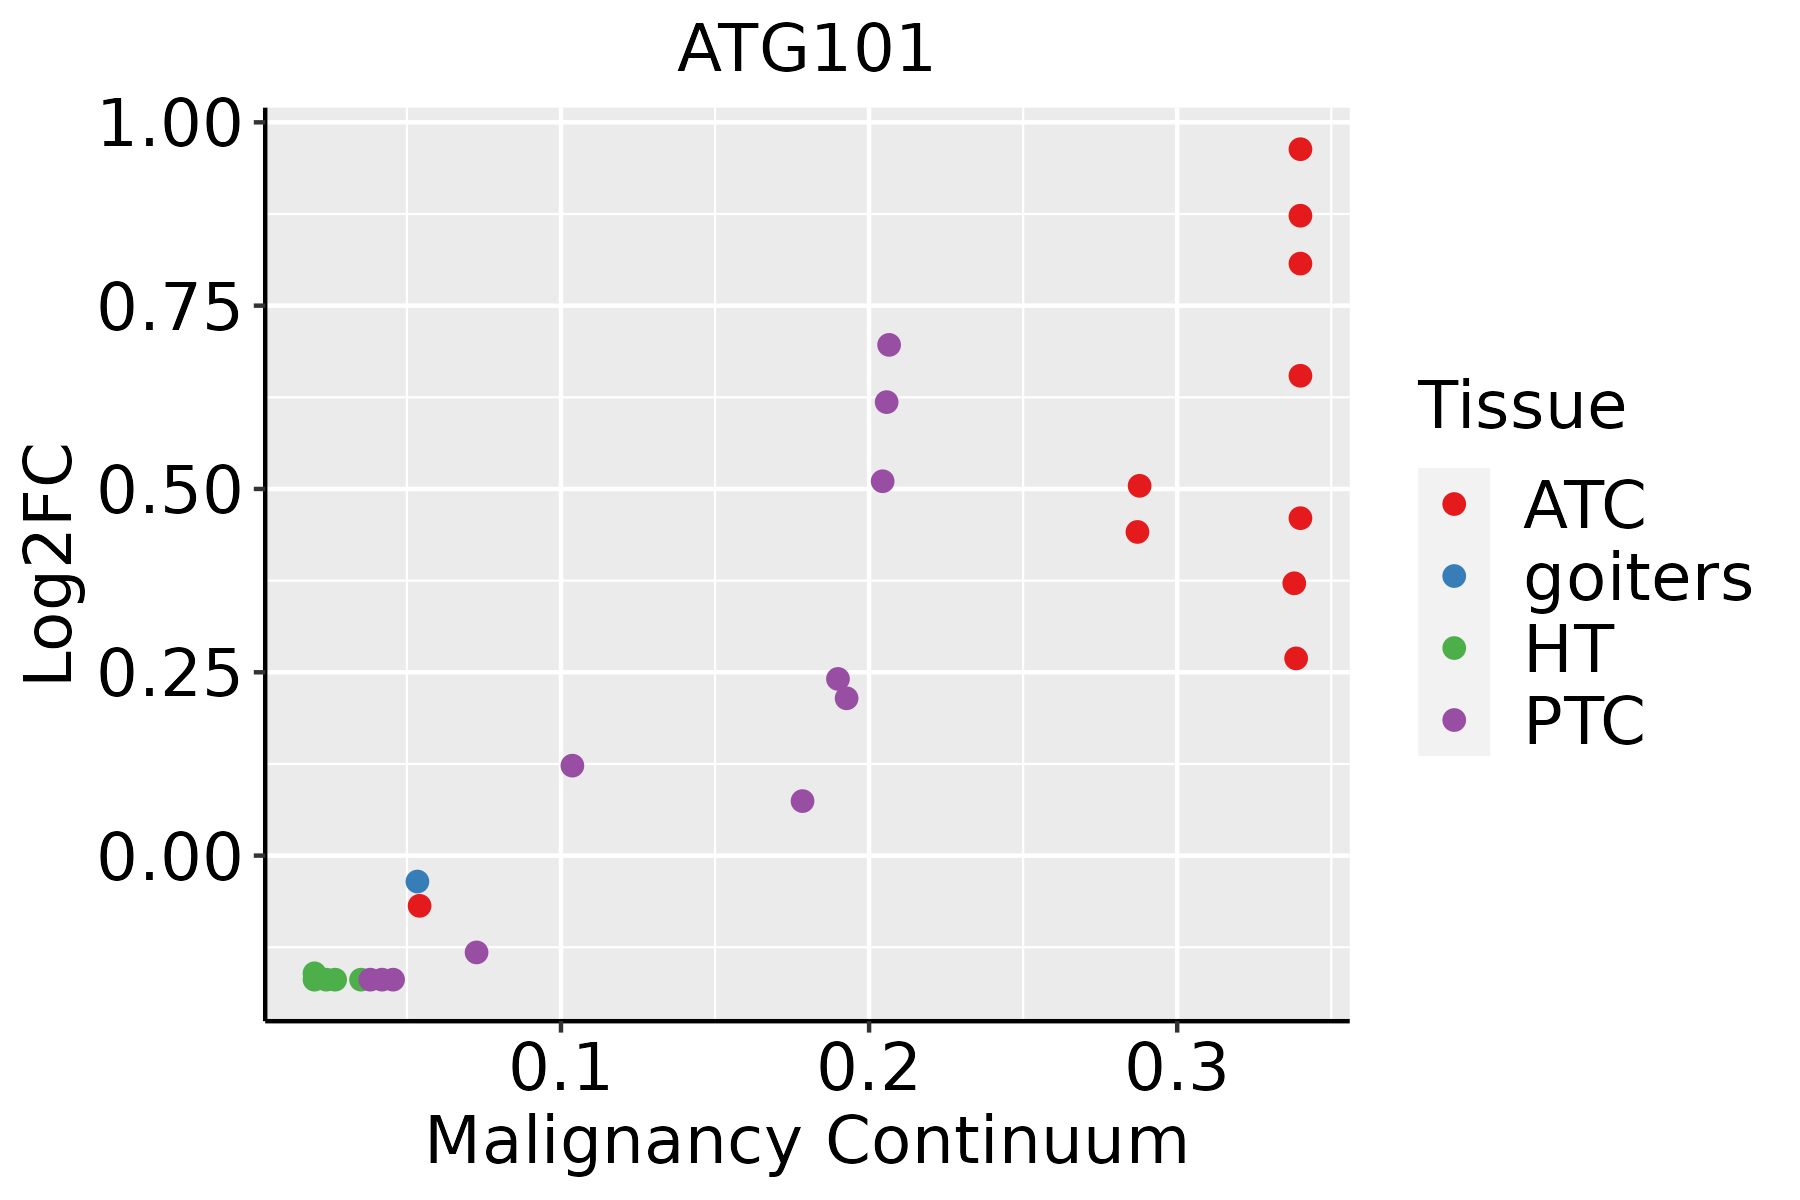 | ATC: Anaplastic thyroid cancer |
| HT: Hashimoto's thyroiditis | ||
| PTC: Papillary thyroid cancer |
| ∗log2FC in expression of this searched gene in stem-like cells from each diseased tissue sample relative to stem-like cells in normal samples in each tissue plotted against the malignancy continuum. Samples are colored based on if they are from different disease stage. |
Top |
Malignant transformation related pathway analysis |
| Find out the enriched GO biological processes and KEGG pathways involved in transition from healthy to precancer to cancer |
| Tissue | Disease Stage | Enriched GO biological Processes |
| Colorectum | AD |  |
| Colorectum | SER |  |
| Colorectum | MSS |  |
| Colorectum | MSI-H |  |
| Colorectum | FAP |  |
| ∗Top 15 enriched GO BP terms are showed in the bar plot of each disease state in each tissue. Each row represents a significant GO biological process which is colored according to the -log10(p.adjust). |
| Page: 1 2 3 4 5 6 7 8 9 |
| GO ID | Tissue | Disease Stage | Description | Gene Ratio | Bg Ratio | pvalue | p.adjust | Count |
| GO:001623617 | Esophagus | ESCC | macroautophagy | 216/8552 | 291/18723 | 1.94e-23 | 4.57e-21 | 216 |
| GO:000703314 | Esophagus | ESCC | vacuole organization | 127/8552 | 180/18723 | 1.04e-11 | 3.85e-10 | 127 |
| GO:190503712 | Esophagus | ESCC | autophagosome organization | 73/8552 | 103/18723 | 1.88e-07 | 2.93e-06 | 73 |
| GO:000004513 | Esophagus | ESCC | autophagosome assembly | 69/8552 | 99/18723 | 1.10e-06 | 1.38e-05 | 69 |
| GO:001623611 | Liver | Cirrhotic | macroautophagy | 129/4634 | 291/18723 | 1.75e-13 | 1.41e-11 | 129 |
| GO:00070332 | Liver | Cirrhotic | vacuole organization | 80/4634 | 180/18723 | 5.73e-09 | 2.25e-07 | 80 |
| GO:0000045 | Liver | Cirrhotic | autophagosome assembly | 43/4634 | 99/18723 | 3.56e-05 | 4.32e-04 | 43 |
| GO:1905037 | Liver | Cirrhotic | autophagosome organization | 44/4634 | 103/18723 | 4.74e-05 | 5.50e-04 | 44 |
| GO:001623621 | Liver | HCC | macroautophagy | 204/7958 | 291/18723 | 8.66e-22 | 1.41e-19 | 204 |
| GO:000703311 | Liver | HCC | vacuole organization | 119/7958 | 180/18723 | 1.22e-10 | 4.25e-09 | 119 |
| GO:19050371 | Liver | HCC | autophagosome organization | 70/7958 | 103/18723 | 1.52e-07 | 2.82e-06 | 70 |
| GO:00000451 | Liver | HCC | autophagosome assembly | 67/7958 | 99/18723 | 3.56e-07 | 6.07e-06 | 67 |
| GO:001623610 | Oral cavity | OSCC | macroautophagy | 192/7305 | 291/18723 | 7.01e-21 | 1.14e-18 | 192 |
| GO:00070335 | Oral cavity | OSCC | vacuole organization | 115/7305 | 180/18723 | 1.11e-11 | 4.00e-10 | 115 |
| GO:19050374 | Oral cavity | OSCC | autophagosome organization | 63/7305 | 103/18723 | 4.30e-06 | 4.98e-05 | 63 |
| GO:00000454 | Oral cavity | OSCC | autophagosome assembly | 60/7305 | 99/18723 | 1.09e-05 | 1.14e-04 | 60 |
| GO:001623615 | Oral cavity | LP | macroautophagy | 135/4623 | 291/18723 | 4.71e-16 | 6.70e-14 | 135 |
| GO:000703313 | Oral cavity | LP | vacuole organization | 79/4623 | 180/18723 | 1.26e-08 | 4.74e-07 | 79 |
| GO:190503711 | Oral cavity | LP | autophagosome organization | 47/4623 | 103/18723 | 2.88e-06 | 6.28e-05 | 47 |
| GO:000004512 | Oral cavity | LP | autophagosome assembly | 44/4623 | 99/18723 | 1.36e-05 | 2.40e-04 | 44 |
| Page: 1 2 |
| Pathway ID | Tissue | Disease Stage | Description | Gene Ratio | Bg Ratio | pvalue | p.adjust | qvalue | Count |
| hsa05014210 | Esophagus | ESCC | Amyotrophic lateral sclerosis | 266/4205 | 364/8465 | 1.31e-20 | 2.20e-18 | 1.13e-18 | 266 |
| hsa05016210 | Esophagus | ESCC | Huntington disease | 226/4205 | 306/8465 | 1.38e-18 | 8.72e-17 | 4.46e-17 | 226 |
| hsa05022210 | Esophagus | ESCC | Pathways of neurodegeneration - multiple diseases | 318/4205 | 476/8465 | 6.10e-15 | 2.04e-13 | 1.05e-13 | 318 |
| hsa05010210 | Esophagus | ESCC | Alzheimer disease | 263/4205 | 384/8465 | 1.80e-14 | 5.47e-13 | 2.80e-13 | 263 |
| hsa0414010 | Esophagus | ESCC | Autophagy - animal | 101/4205 | 141/8465 | 7.60e-08 | 6.21e-07 | 3.18e-07 | 101 |
| hsa0501728 | Esophagus | ESCC | Spinocerebellar ataxia | 94/4205 | 143/8465 | 6.77e-05 | 2.90e-04 | 1.48e-04 | 94 |
| hsa0421114 | Esophagus | ESCC | Longevity regulating pathway | 58/4205 | 89/8465 | 2.19e-03 | 6.16e-03 | 3.16e-03 | 58 |
| hsa041362 | Esophagus | ESCC | Autophagy - other | 23/4205 | 32/8465 | 8.99e-03 | 2.14e-02 | 1.09e-02 | 23 |
| hsa0501438 | Esophagus | ESCC | Amyotrophic lateral sclerosis | 266/4205 | 364/8465 | 1.31e-20 | 2.20e-18 | 1.13e-18 | 266 |
| hsa0501638 | Esophagus | ESCC | Huntington disease | 226/4205 | 306/8465 | 1.38e-18 | 8.72e-17 | 4.46e-17 | 226 |
| hsa0502238 | Esophagus | ESCC | Pathways of neurodegeneration - multiple diseases | 318/4205 | 476/8465 | 6.10e-15 | 2.04e-13 | 1.05e-13 | 318 |
| hsa0501038 | Esophagus | ESCC | Alzheimer disease | 263/4205 | 384/8465 | 1.80e-14 | 5.47e-13 | 2.80e-13 | 263 |
| hsa0414015 | Esophagus | ESCC | Autophagy - animal | 101/4205 | 141/8465 | 7.60e-08 | 6.21e-07 | 3.18e-07 | 101 |
| hsa0501736 | Esophagus | ESCC | Spinocerebellar ataxia | 94/4205 | 143/8465 | 6.77e-05 | 2.90e-04 | 1.48e-04 | 94 |
| hsa0421115 | Esophagus | ESCC | Longevity regulating pathway | 58/4205 | 89/8465 | 2.19e-03 | 6.16e-03 | 3.16e-03 | 58 |
| hsa0413611 | Esophagus | ESCC | Autophagy - other | 23/4205 | 32/8465 | 8.99e-03 | 2.14e-02 | 1.09e-02 | 23 |
| hsa0501614 | Liver | Cirrhotic | Huntington disease | 172/2530 | 306/8465 | 1.65e-22 | 1.10e-20 | 6.77e-21 | 172 |
| hsa0501414 | Liver | Cirrhotic | Amyotrophic lateral sclerosis | 187/2530 | 364/8465 | 1.56e-18 | 6.50e-17 | 4.01e-17 | 187 |
| hsa0502214 | Liver | Cirrhotic | Pathways of neurodegeneration - multiple diseases | 217/2530 | 476/8465 | 7.30e-14 | 2.03e-12 | 1.25e-12 | 217 |
| hsa0501014 | Liver | Cirrhotic | Alzheimer disease | 180/2530 | 384/8465 | 5.52e-13 | 1.36e-11 | 8.36e-12 | 180 |
| Page: 1 2 3 4 5 |
Top |
Cell-cell communication analysis |
| Identification of potential cell-cell interactions between two cell types and their ligand-receptor pairs for different disease states |
| Ligand | Receptor | LRpair | Pathway | Tissue | Disease Stage |
| Page: 1 |
Top |
Single-cell gene regulatory network inference analysis |
| Find out the significant the regulons (TFs) and the target genes of each regulon across cell types for different disease states |
| TF | Cell Type | Tissue | Disease Stage | Target Gene | RSS | Regulon Activity |
| ∗The dot plots of a searched regulon are shown for all cell subpopulations in each disease state of each tissue based on the regulon specific score inferred using pySCENIC and by calculating the average expression. |
| Page: 1 |
Top |
Somatic mutation of malignant transformation related genes |
| Annotation of somatic variants for genes involved in malignant transformation |
| Hugo Symbol | Variant Class | Variant Classification | dbSNP RS | HGVSc | HGVSp | HGVSp Short | SWISSPROT | BIOTYPE | SIFT | PolyPhen | Tumor Sample Barcode | Tissue | Histology | Sex | Age | Stage | Therapy Types | Drugs | Outcome |
| ATG101 | SNV | Missense_Mutation | rs747788994 | c.50N>G | p.Val17Gly | p.V17G | Q9BSB4 | protein_coding | deleterious(0) | possibly_damaging(0.897) | TCGA-AO-A0J8-01 | Breast | breast invasive carcinoma | Female | <65 | I/II | Chemotherapy | cyclophosphamide | SD |
| ATG101 | SNV | Missense_Mutation | c.573N>T | p.Lys191Asn | p.K191N | Q9BSB4 | protein_coding | deleterious(0) | benign(0.254) | TCGA-E2-A14P-01 | Breast | breast invasive carcinoma | Female | >=65 | III/IV | Targeted Molecular therapy | trastuzumab | SD | |
| ATG101 | insertion | Frame_Shift_Ins | novel | c.300_301insACCTTGGTTTGTCAGT | p.Glu101ThrfsTer6 | p.E101Tfs*6 | Q9BSB4 | protein_coding | TCGA-A8-A08H-01 | Breast | breast invasive carcinoma | Female | >=65 | I/II | Unknown | Unknown | SD | ||
| ATG101 | insertion | In_Frame_Ins | novel | c.521_522insACCTTACTTCTCTAA | p.Val174_Asp175insProTyrPheSerLys | p.V174_D175insPYFSK | Q9BSB4 | protein_coding | TCGA-AN-A0FT-01 | Breast | breast invasive carcinoma | Female | <65 | I/II | Unknown | Unknown | SD | ||
| ATG101 | insertion | In_Frame_Ins | novel | c.522_523insCCTCATCGTGCCTTGGTGAAAGCT | p.Val174_Asp175insProHisArgAlaLeuValLysAla | p.V174_D175insPHRALVKA | Q9BSB4 | protein_coding | TCGA-AN-A0FT-01 | Breast | breast invasive carcinoma | Female | <65 | I/II | Unknown | Unknown | SD | ||
| ATG101 | SNV | Missense_Mutation | c.521N>C | p.Val174Ala | p.V174A | Q9BSB4 | protein_coding | tolerated(0.1) | benign(0.425) | TCGA-C5-A7CH-01 | Cervix | cervical & endocervical cancer | Female | <65 | I/II | Unspecific | SD | ||
| ATG101 | SNV | Missense_Mutation | rs751591793 | c.11N>A | p.Arg4His | p.R4H | Q9BSB4 | protein_coding | tolerated(0.05) | benign(0.093) | TCGA-A6-2686-01 | Colorectum | colon adenocarcinoma | Female | >=65 | I/II | Unknown | Unknown | SD |
| ATG101 | SNV | Missense_Mutation | novel | c.127N>T | p.Gly43Cys | p.G43C | Q9BSB4 | protein_coding | deleterious(0) | probably_damaging(0.989) | TCGA-AA-3930-01 | Colorectum | colon adenocarcinoma | Male | >=65 | III/IV | Chemotherapy | capecitabine | PD |
| ATG101 | SNV | Missense_Mutation | novel | c.519N>T | p.Glu173Asp | p.E173D | Q9BSB4 | protein_coding | tolerated(0.47) | benign(0.093) | TCGA-AA-3950-01 | Colorectum | colon adenocarcinoma | Female | >=65 | I/II | Unknown | Unknown | SD |
| ATG101 | SNV | Missense_Mutation | c.230G>A | p.Arg77His | p.R77H | Q9BSB4 | protein_coding | tolerated(0.07) | benign(0.001) | TCGA-AZ-4313-01 | Colorectum | colon adenocarcinoma | Female | <65 | I/II | Unknown | Unknown | SD |
| Page: 1 2 3 |
Top |
Related drugs of malignant transformation related genes |
| Identification of chemicals and drugs interact with genes involved in malignant transfromation |
| (DGIdb 4.0) |
| Entrez ID | Symbol | Category | Interaction Types | Drug Claim Name | Drug Name | PMIDs |
| Page: 1 |

Copyright 2023-Present -The University of Texas Health Science Center at Houston |