
|
|||||
|
 | |
| |
| |
| |
| |
| |
|
Gene: ARMC10 |
Gene summary for ARMC10 |
| Gene information | Species | Human | Gene symbol | ARMC10 | Gene ID | 83787 |
| Gene name | armadillo repeat containing 10 | |
| Gene Alias | PNAS-112 | |
| Cytomap | 7q22.1 | |
| Gene Type | protein-coding | GO ID | GO:0006915 | UniProtAcc | Q8N2F6 |
Top |
Malignant transformation analysis |
| Identification of the aberrant gene expression in precancerous and cancerous lesions by comparing the gene expression of stem-like cells in diseased tissues with normal stem cells |
| Entrez ID | Symbol | Replicates | Species | Organ | Tissue | Adj P-value | Log2FC | Malignancy |
| 83787 | ARMC10 | P23T-E | Human | Esophagus | ESCC | 1.12e-58 | 1.60e+00 | 0.108 |
| 83787 | ARMC10 | P24T-E | Human | Esophagus | ESCC | 1.64e-58 | 1.09e+00 | 0.1287 |
| 83787 | ARMC10 | P26T-E | Human | Esophagus | ESCC | 5.55e-84 | 1.28e+00 | 0.1276 |
| 83787 | ARMC10 | P27T-E | Human | Esophagus | ESCC | 3.68e-66 | 1.16e+00 | 0.1055 |
| 83787 | ARMC10 | P28T-E | Human | Esophagus | ESCC | 5.11e-88 | 1.62e+00 | 0.1149 |
| 83787 | ARMC10 | P30T-E | Human | Esophagus | ESCC | 2.56e-44 | 1.36e+00 | 0.137 |
| 83787 | ARMC10 | P31T-E | Human | Esophagus | ESCC | 2.67e-72 | 1.15e+00 | 0.1251 |
| 83787 | ARMC10 | P32T-E | Human | Esophagus | ESCC | 3.99e-74 | 1.44e+00 | 0.1666 |
| 83787 | ARMC10 | P36T-E | Human | Esophagus | ESCC | 7.01e-33 | 1.25e+00 | 0.1187 |
| 83787 | ARMC10 | P37T-E | Human | Esophagus | ESCC | 3.98e-45 | 1.25e+00 | 0.1371 |
| 83787 | ARMC10 | P38T-E | Human | Esophagus | ESCC | 1.23e-15 | 8.93e-01 | 0.127 |
| 83787 | ARMC10 | P39T-E | Human | Esophagus | ESCC | 3.79e-29 | 5.82e-01 | 0.0894 |
| 83787 | ARMC10 | P40T-E | Human | Esophagus | ESCC | 1.84e-18 | 7.42e-01 | 0.109 |
| 83787 | ARMC10 | P42T-E | Human | Esophagus | ESCC | 6.95e-51 | 1.44e+00 | 0.1175 |
| 83787 | ARMC10 | P44T-E | Human | Esophagus | ESCC | 1.71e-26 | 7.76e-01 | 0.1096 |
| 83787 | ARMC10 | P47T-E | Human | Esophagus | ESCC | 3.48e-47 | 9.17e-01 | 0.1067 |
| 83787 | ARMC10 | P48T-E | Human | Esophagus | ESCC | 1.97e-43 | 7.46e-01 | 0.0959 |
| 83787 | ARMC10 | P49T-E | Human | Esophagus | ESCC | 9.44e-21 | 2.18e+00 | 0.1768 |
| 83787 | ARMC10 | P52T-E | Human | Esophagus | ESCC | 3.99e-56 | 1.27e+00 | 0.1555 |
| 83787 | ARMC10 | P54T-E | Human | Esophagus | ESCC | 3.13e-43 | 1.14e+00 | 0.0975 |
| Page: 1 2 3 4 5 6 |
| Tissue | Expression Dynamics | Abbreviation |
| Esophagus |  | ESCC: Esophageal squamous cell carcinoma |
| HGIN: High-grade intraepithelial neoplasias | ||
| LGIN: Low-grade intraepithelial neoplasias | ||
| Liver | 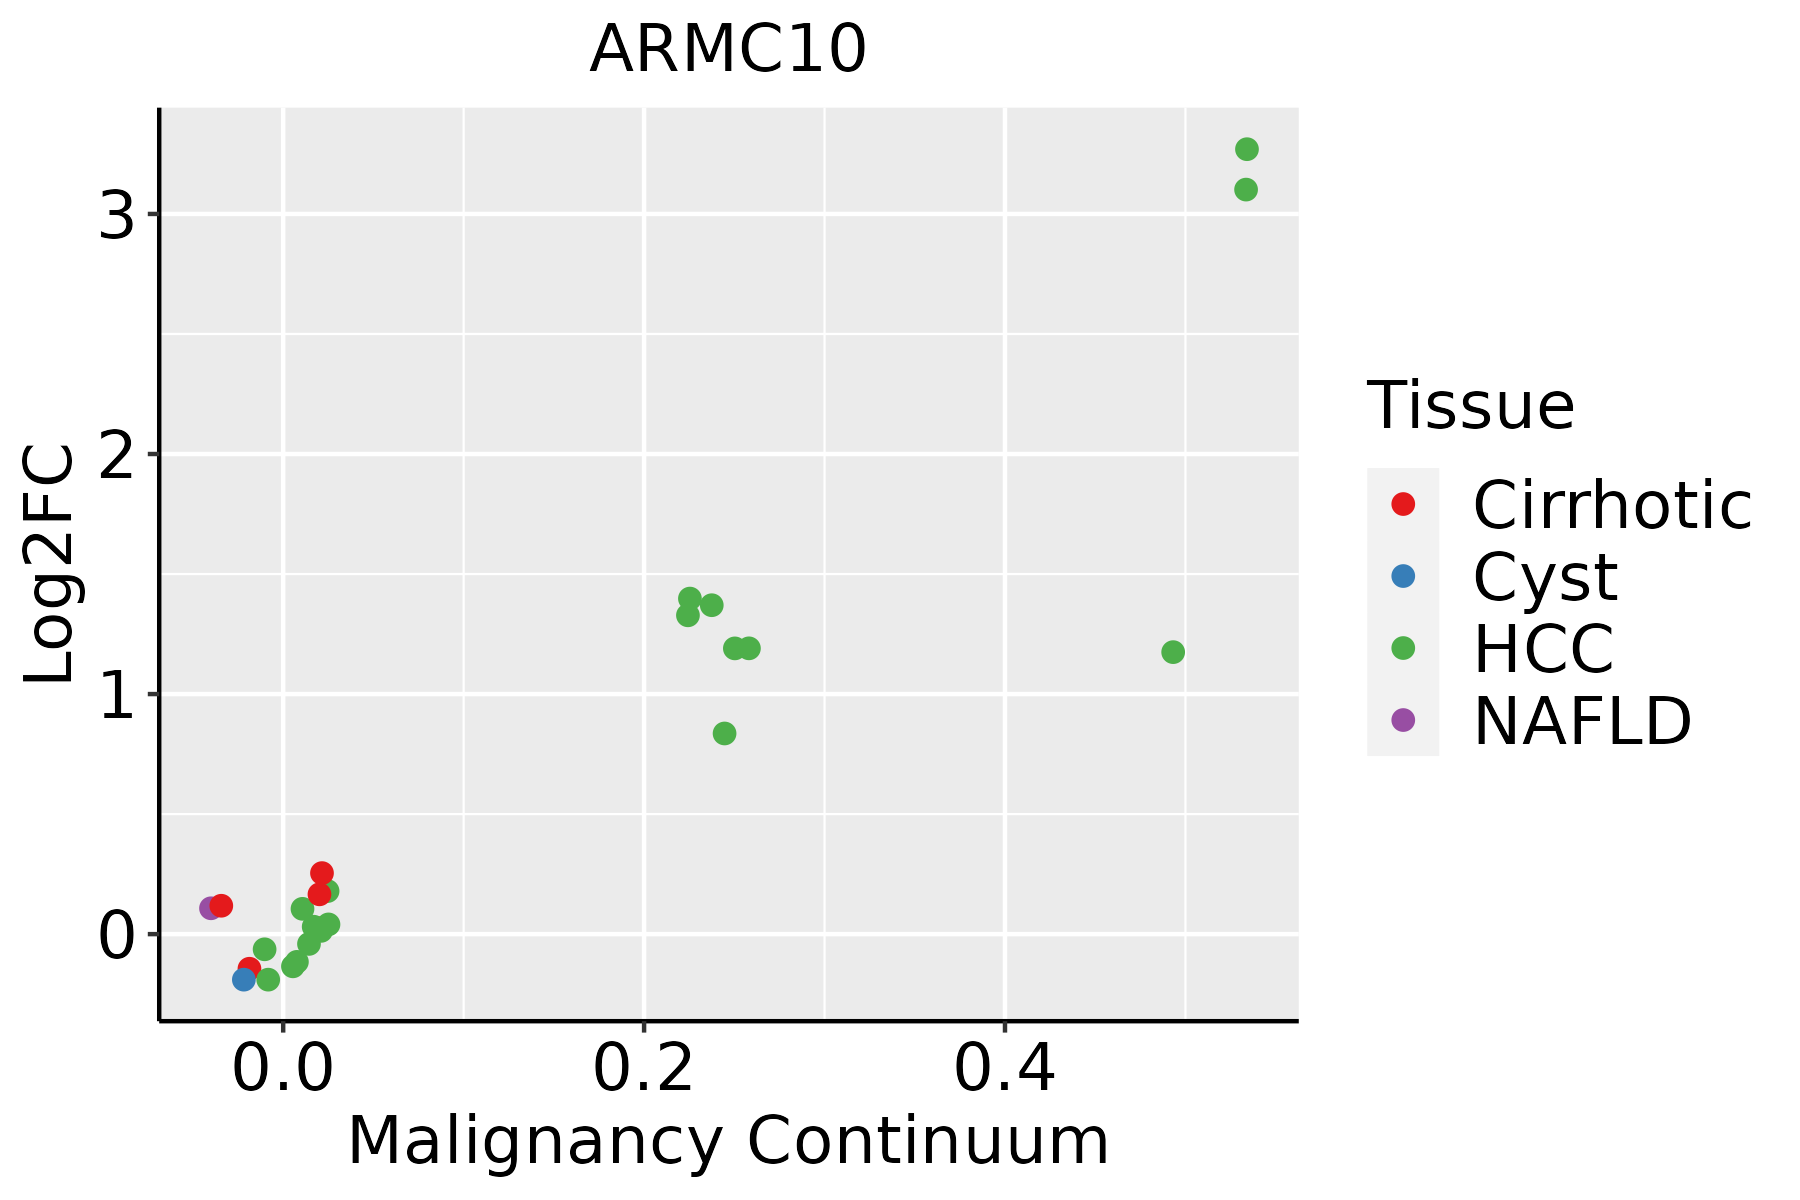 | HCC: Hepatocellular carcinoma |
| NAFLD: Non-alcoholic fatty liver disease | ||
| Oral Cavity |  | EOLP: Erosive Oral lichen planus |
| LP: leukoplakia | ||
| NEOLP: Non-erosive oral lichen planus | ||
| OSCC: Oral squamous cell carcinoma | ||
| Skin |  | AK: Actinic keratosis |
| cSCC: Cutaneous squamous cell carcinoma | ||
| SCCIS:squamous cell carcinoma in situ | ||
| Thyroid |  | ATC: Anaplastic thyroid cancer |
| HT: Hashimoto's thyroiditis | ||
| PTC: Papillary thyroid cancer |
| ∗log2FC in expression of this searched gene in stem-like cells from each diseased tissue sample relative to stem-like cells in normal samples in each tissue plotted against the malignancy continuum. Samples are colored based on if they are from different disease stage. |
Top |
Malignant transformation related pathway analysis |
| Find out the enriched GO biological processes and KEGG pathways involved in transition from healthy to precancer to cancer |
| Tissue | Disease Stage | Enriched GO biological Processes |
| Colorectum | AD |  |
| Colorectum | SER |  |
| Colorectum | MSS |  |
| Colorectum | MSI-H |  |
| Colorectum | FAP |  |
| ∗Top 15 enriched GO BP terms are showed in the bar plot of each disease state in each tissue. Each row represents a significant GO biological process which is colored according to the -log10(p.adjust). |
| Page: 1 2 3 4 5 6 7 8 9 |
| GO ID | Tissue | Disease Stage | Description | Gene Ratio | Bg Ratio | pvalue | p.adjust | Count |
| GO:0097193111 | Esophagus | ESCC | intrinsic apoptotic signaling pathway | 222/8552 | 288/18723 | 5.87e-28 | 2.02e-25 | 222 |
| GO:2001233111 | Esophagus | ESCC | regulation of apoptotic signaling pathway | 256/8552 | 356/18723 | 4.11e-24 | 1.04e-21 | 256 |
| GO:2001242111 | Esophagus | ESCC | regulation of intrinsic apoptotic signaling pathway | 128/8552 | 164/18723 | 1.75e-17 | 1.50e-15 | 128 |
| GO:2001234111 | Esophagus | ESCC | negative regulation of apoptotic signaling pathway | 161/8552 | 224/18723 | 1.24e-15 | 8.09e-14 | 161 |
| GO:0072331111 | Esophagus | ESCC | signal transduction by p53 class mediator | 121/8552 | 163/18723 | 9.61e-14 | 4.69e-12 | 121 |
| GO:2001243111 | Esophagus | ESCC | negative regulation of intrinsic apoptotic signaling pathway | 78/8552 | 98/18723 | 5.50e-12 | 2.10e-10 | 78 |
| GO:1901796111 | Esophagus | ESCC | regulation of signal transduction by p53 class mediator | 70/8552 | 93/18723 | 5.69e-09 | 1.18e-07 | 70 |
| GO:0072332111 | Esophagus | ESCC | intrinsic apoptotic signaling pathway by p53 class mediator | 59/8552 | 76/18723 | 1.22e-08 | 2.42e-07 | 59 |
| GO:1902253110 | Esophagus | ESCC | regulation of intrinsic apoptotic signaling pathway by p53 class mediator | 23/8552 | 29/18723 | 2.25e-04 | 1.40e-03 | 23 |
| GO:19017975 | Esophagus | ESCC | negative regulation of signal transduction by p53 class mediator | 22/8552 | 31/18723 | 3.90e-03 | 1.58e-02 | 22 |
| GO:19022544 | Esophagus | ESCC | negative regulation of intrinsic apoptotic signaling pathway by p53 class mediator | 16/8552 | 21/18723 | 4.47e-03 | 1.76e-02 | 16 |
| GO:200123312 | Liver | Cirrhotic | regulation of apoptotic signaling pathway | 163/4634 | 356/18723 | 2.62e-18 | 4.43e-16 | 163 |
| GO:009719312 | Liver | Cirrhotic | intrinsic apoptotic signaling pathway | 130/4634 | 288/18723 | 2.69e-14 | 2.45e-12 | 130 |
| GO:20012427 | Liver | Cirrhotic | regulation of intrinsic apoptotic signaling pathway | 82/4634 | 164/18723 | 2.35e-12 | 1.71e-10 | 82 |
| GO:20012347 | Liver | Cirrhotic | negative regulation of apoptotic signaling pathway | 102/4634 | 224/18723 | 8.40e-12 | 5.60e-10 | 102 |
| GO:20012437 | Liver | Cirrhotic | negative regulation of intrinsic apoptotic signaling pathway | 47/4634 | 98/18723 | 5.26e-07 | 1.17e-05 | 47 |
| GO:007233112 | Liver | Cirrhotic | signal transduction by p53 class mediator | 69/4634 | 163/18723 | 5.97e-07 | 1.30e-05 | 69 |
| GO:00723326 | Liver | Cirrhotic | intrinsic apoptotic signaling pathway by p53 class mediator | 38/4634 | 76/18723 | 1.75e-06 | 3.32e-05 | 38 |
| GO:190179612 | Liver | Cirrhotic | regulation of signal transduction by p53 class mediator | 37/4634 | 93/18723 | 9.58e-04 | 6.78e-03 | 37 |
| GO:19022535 | Liver | Cirrhotic | regulation of intrinsic apoptotic signaling pathway by p53 class mediator | 14/4634 | 29/18723 | 5.09e-03 | 2.62e-02 | 14 |
| Page: 1 2 3 4 5 |
| Pathway ID | Tissue | Disease Stage | Description | Gene Ratio | Bg Ratio | pvalue | p.adjust | qvalue | Count |
| Page: 1 |
Top |
Cell-cell communication analysis |
| Identification of potential cell-cell interactions between two cell types and their ligand-receptor pairs for different disease states |
| Ligand | Receptor | LRpair | Pathway | Tissue | Disease Stage |
| Page: 1 |
Top |
Single-cell gene regulatory network inference analysis |
| Find out the significant the regulons (TFs) and the target genes of each regulon across cell types for different disease states |
| TF | Cell Type | Tissue | Disease Stage | Target Gene | RSS | Regulon Activity |
| ∗The dot plots of a searched regulon are shown for all cell subpopulations in each disease state of each tissue based on the regulon specific score inferred using pySCENIC and by calculating the average expression. |
| Page: 1 |
Top |
Somatic mutation of malignant transformation related genes |
| Annotation of somatic variants for genes involved in malignant transformation |
| Hugo Symbol | Variant Class | Variant Classification | dbSNP RS | HGVSc | HGVSp | HGVSp Short | SWISSPROT | BIOTYPE | SIFT | PolyPhen | Tumor Sample Barcode | Tissue | Histology | Sex | Age | Stage | Therapy Types | Drugs | Outcome |
| ARMC10 | SNV | Missense_Mutation | novel | c.446A>T | p.His149Leu | p.H149L | Q8N2F6 | protein_coding | deleterious(0.01) | benign(0.079) | TCGA-DS-A1OB-01 | Cervix | cervical & endocervical cancer | Female | <65 | I/II | Chemotherapy | carboplatin | PD |
| ARMC10 | insertion | Frame_Shift_Ins | novel | c.444_445insGG | p.His149GlyfsTer12 | p.H149Gfs*12 | Q8N2F6 | protein_coding | TCGA-DS-A1OB-01 | Cervix | cervical & endocervical cancer | Female | <65 | I/II | Chemotherapy | carboplatin | PD | ||
| ARMC10 | SNV | Missense_Mutation | c.962N>C | p.Ile321Thr | p.I321T | Q8N2F6 | protein_coding | deleterious(0) | benign(0.288) | TCGA-AA-A01P-01 | Colorectum | colon adenocarcinoma | Female | >=65 | III/IV | Unknown | Unknown | PD | |
| ARMC10 | SNV | Missense_Mutation | novel | c.1025A>G | p.Lys342Arg | p.K342R | Q8N2F6 | protein_coding | deleterious(0.03) | benign(0.009) | TCGA-CA-6717-01 | Colorectum | colon adenocarcinoma | Male | <65 | I/II | Chemotherapy | oxaliplatin | CR |
| ARMC10 | SNV | Missense_Mutation | c.845N>T | p.Thr282Met | p.T282M | Q8N2F6 | protein_coding | deleterious(0.03) | probably_damaging(0.991) | TCGA-AG-3726-01 | Colorectum | rectum adenocarcinoma | Female | <65 | I/II | Unknown | Unknown | SD | |
| ARMC10 | SNV | Missense_Mutation | novel | c.640N>T | p.His214Tyr | p.H214Y | Q8N2F6 | protein_coding | tolerated(0.07) | benign(0.164) | TCGA-A5-A2K3-01 | Endometrium | uterine corpus endometrioid carcinoma | Female | >=65 | I/II | Chemotherapy | carboplatin | SD |
| ARMC10 | SNV | Missense_Mutation | c.864N>T | p.Lys288Asn | p.K288N | Q8N2F6 | protein_coding | tolerated(1) | benign(0.003) | TCGA-AJ-A5DW-01 | Endometrium | uterine corpus endometrioid carcinoma | Female | <65 | I/II | Unknown | Unknown | SD | |
| ARMC10 | SNV | Missense_Mutation | c.468G>T | p.Glu156Asp | p.E156D | Q8N2F6 | protein_coding | deleterious(0.01) | probably_damaging(0.999) | TCGA-AP-A051-01 | Endometrium | uterine corpus endometrioid carcinoma | Female | >=65 | I/II | Unknown | Unknown | SD | |
| ARMC10 | SNV | Missense_Mutation | novel | c.821N>G | p.Lys274Arg | p.K274R | Q8N2F6 | protein_coding | tolerated(0.25) | benign(0.017) | TCGA-AP-A1DK-01 | Endometrium | uterine corpus endometrioid carcinoma | Female | <65 | I/II | Unknown | Unknown | SD |
| ARMC10 | SNV | Missense_Mutation | novel | c.464N>G | p.Lys155Arg | p.K155R | Q8N2F6 | protein_coding | tolerated(0.36) | probably_damaging(0.984) | TCGA-B5-A1MR-01 | Endometrium | uterine corpus endometrioid carcinoma | Female | >=65 | III/IV | Unknown | Unknown | SD |
| Page: 1 2 3 4 |
Top |
Related drugs of malignant transformation related genes |
| Identification of chemicals and drugs interact with genes involved in malignant transfromation |
| (DGIdb 4.0) |
| Entrez ID | Symbol | Category | Interaction Types | Drug Claim Name | Drug Name | PMIDs |
| Page: 1 |

Copyright 2023-Present -The University of Texas Health Science Center at Houston |