
|
|||||
|
 | |
| |
| |
| |
| |
| |
|
Gene: ARIH2 |
Gene summary for ARIH2 |
| Gene information | Species | Human | Gene symbol | ARIH2 | Gene ID | 10425 |
| Gene name | ariadne RBR E3 ubiquitin protein ligase 2 | |
| Gene Alias | ARI2 | |
| Cytomap | 3p21.31 | |
| Gene Type | protein-coding | GO ID | GO:0000209 | UniProtAcc | O95376 |
Top |
Malignant transformation analysis |
| Identification of the aberrant gene expression in precancerous and cancerous lesions by comparing the gene expression of stem-like cells in diseased tissues with normal stem cells |
| Entrez ID | Symbol | Replicates | Species | Organ | Tissue | Adj P-value | Log2FC | Malignancy |
| 10425 | ARIH2 | P19T-E | Human | Esophagus | ESCC | 9.07e-04 | 3.62e-01 | 0.1662 |
| 10425 | ARIH2 | P20T-E | Human | Esophagus | ESCC | 1.79e-19 | 3.40e-01 | 0.1124 |
| 10425 | ARIH2 | P21T-E | Human | Esophagus | ESCC | 7.68e-31 | 4.74e-01 | 0.1617 |
| 10425 | ARIH2 | P22T-E | Human | Esophagus | ESCC | 1.14e-21 | 3.91e-01 | 0.1236 |
| 10425 | ARIH2 | P23T-E | Human | Esophagus | ESCC | 1.05e-27 | 7.01e-01 | 0.108 |
| 10425 | ARIH2 | P24T-E | Human | Esophagus | ESCC | 8.09e-21 | 4.12e-01 | 0.1287 |
| 10425 | ARIH2 | P26T-E | Human | Esophagus | ESCC | 7.81e-28 | 5.80e-01 | 0.1276 |
| 10425 | ARIH2 | P27T-E | Human | Esophagus | ESCC | 2.08e-25 | 5.56e-01 | 0.1055 |
| 10425 | ARIH2 | P28T-E | Human | Esophagus | ESCC | 5.08e-24 | 4.94e-01 | 0.1149 |
| 10425 | ARIH2 | P30T-E | Human | Esophagus | ESCC | 4.25e-22 | 9.43e-01 | 0.137 |
| 10425 | ARIH2 | P31T-E | Human | Esophagus | ESCC | 7.19e-15 | 4.03e-01 | 0.1251 |
| 10425 | ARIH2 | P32T-E | Human | Esophagus | ESCC | 3.97e-27 | 6.64e-01 | 0.1666 |
| 10425 | ARIH2 | P36T-E | Human | Esophagus | ESCC | 3.65e-20 | 6.07e-01 | 0.1187 |
| 10425 | ARIH2 | P37T-E | Human | Esophagus | ESCC | 1.91e-23 | 3.03e-01 | 0.1371 |
| 10425 | ARIH2 | P38T-E | Human | Esophagus | ESCC | 1.62e-04 | 3.62e-01 | 0.127 |
| 10425 | ARIH2 | P39T-E | Human | Esophagus | ESCC | 4.21e-14 | 2.23e-01 | 0.0894 |
| 10425 | ARIH2 | P40T-E | Human | Esophagus | ESCC | 6.39e-06 | 2.41e-01 | 0.109 |
| 10425 | ARIH2 | P42T-E | Human | Esophagus | ESCC | 3.92e-21 | 4.18e-01 | 0.1175 |
| 10425 | ARIH2 | P44T-E | Human | Esophagus | ESCC | 1.15e-05 | 1.90e-01 | 0.1096 |
| 10425 | ARIH2 | P47T-E | Human | Esophagus | ESCC | 1.28e-13 | 2.88e-01 | 0.1067 |
| Page: 1 2 3 4 5 6 |
| Tissue | Expression Dynamics | Abbreviation |
| Esophagus | 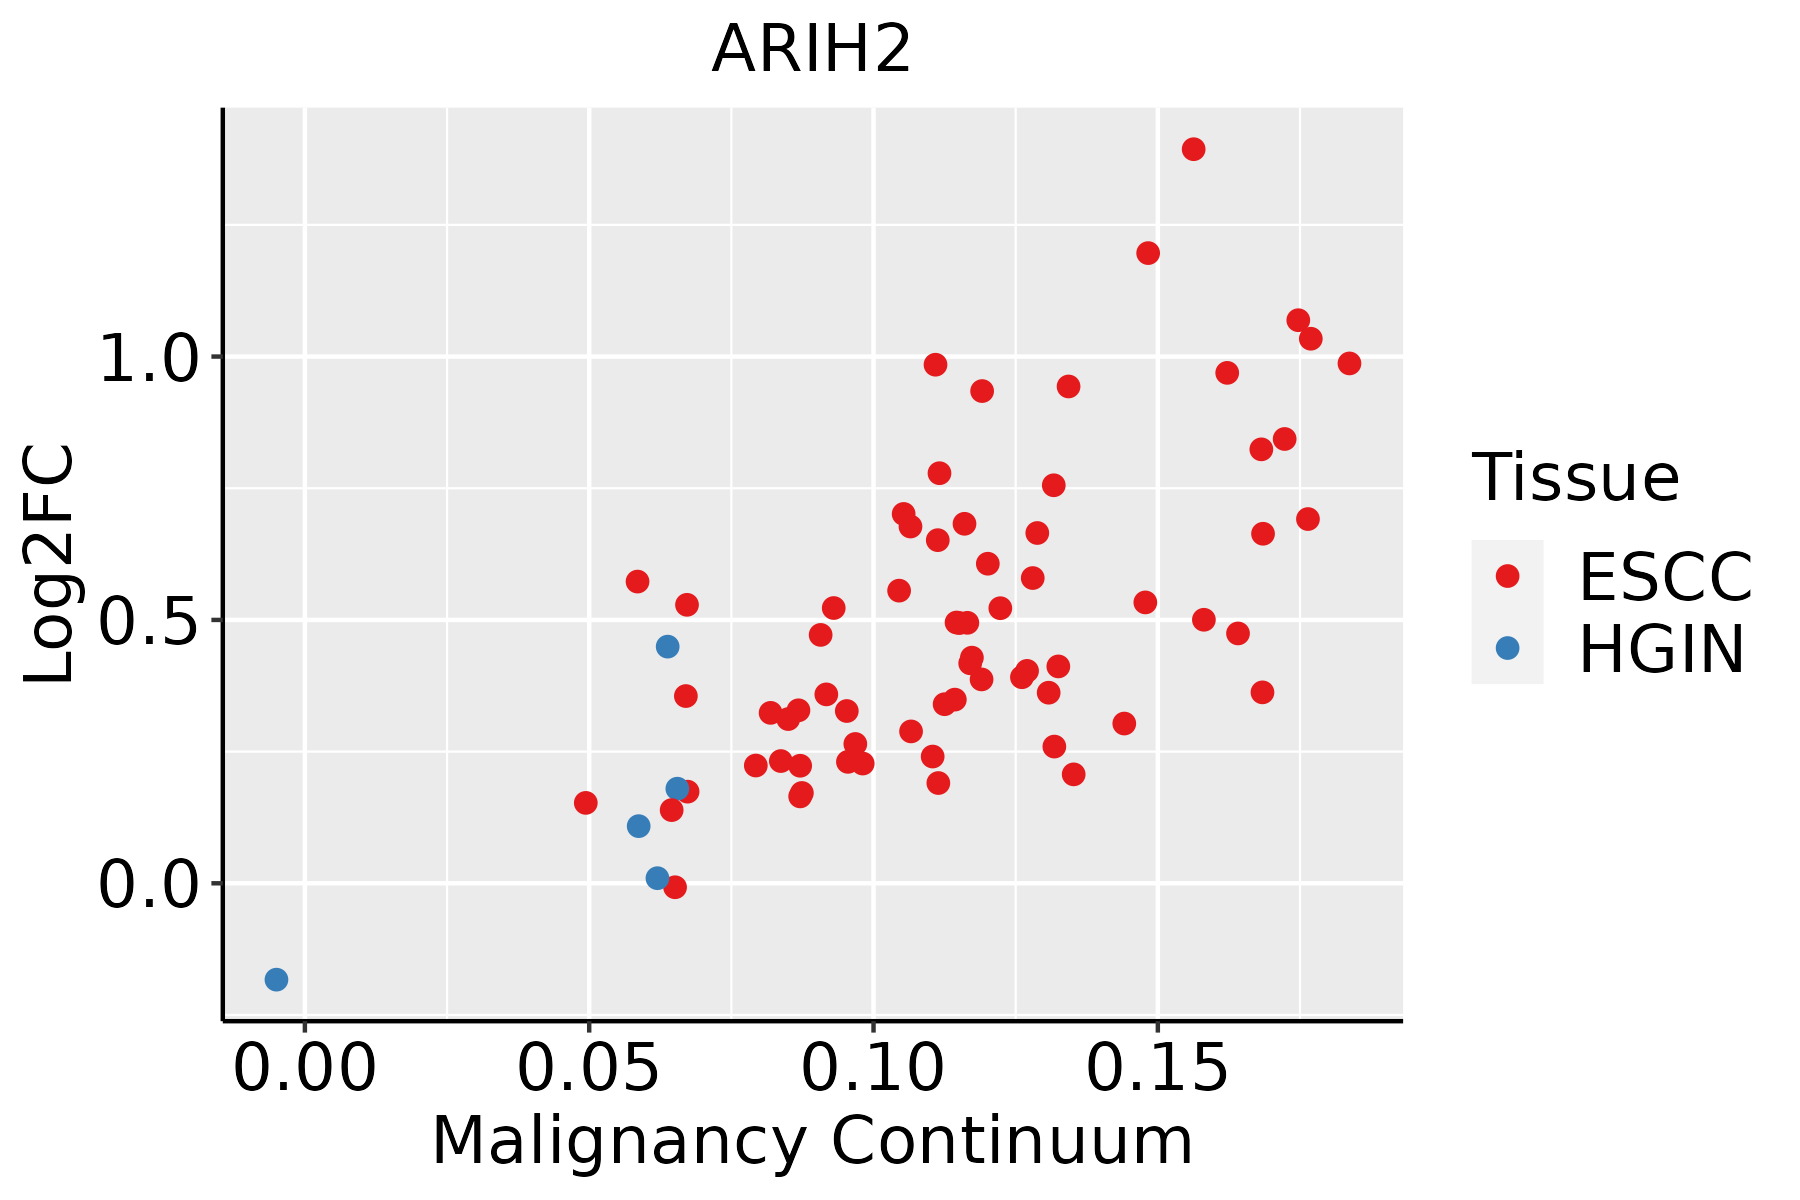 | ESCC: Esophageal squamous cell carcinoma |
| HGIN: High-grade intraepithelial neoplasias | ||
| LGIN: Low-grade intraepithelial neoplasias | ||
| Liver | 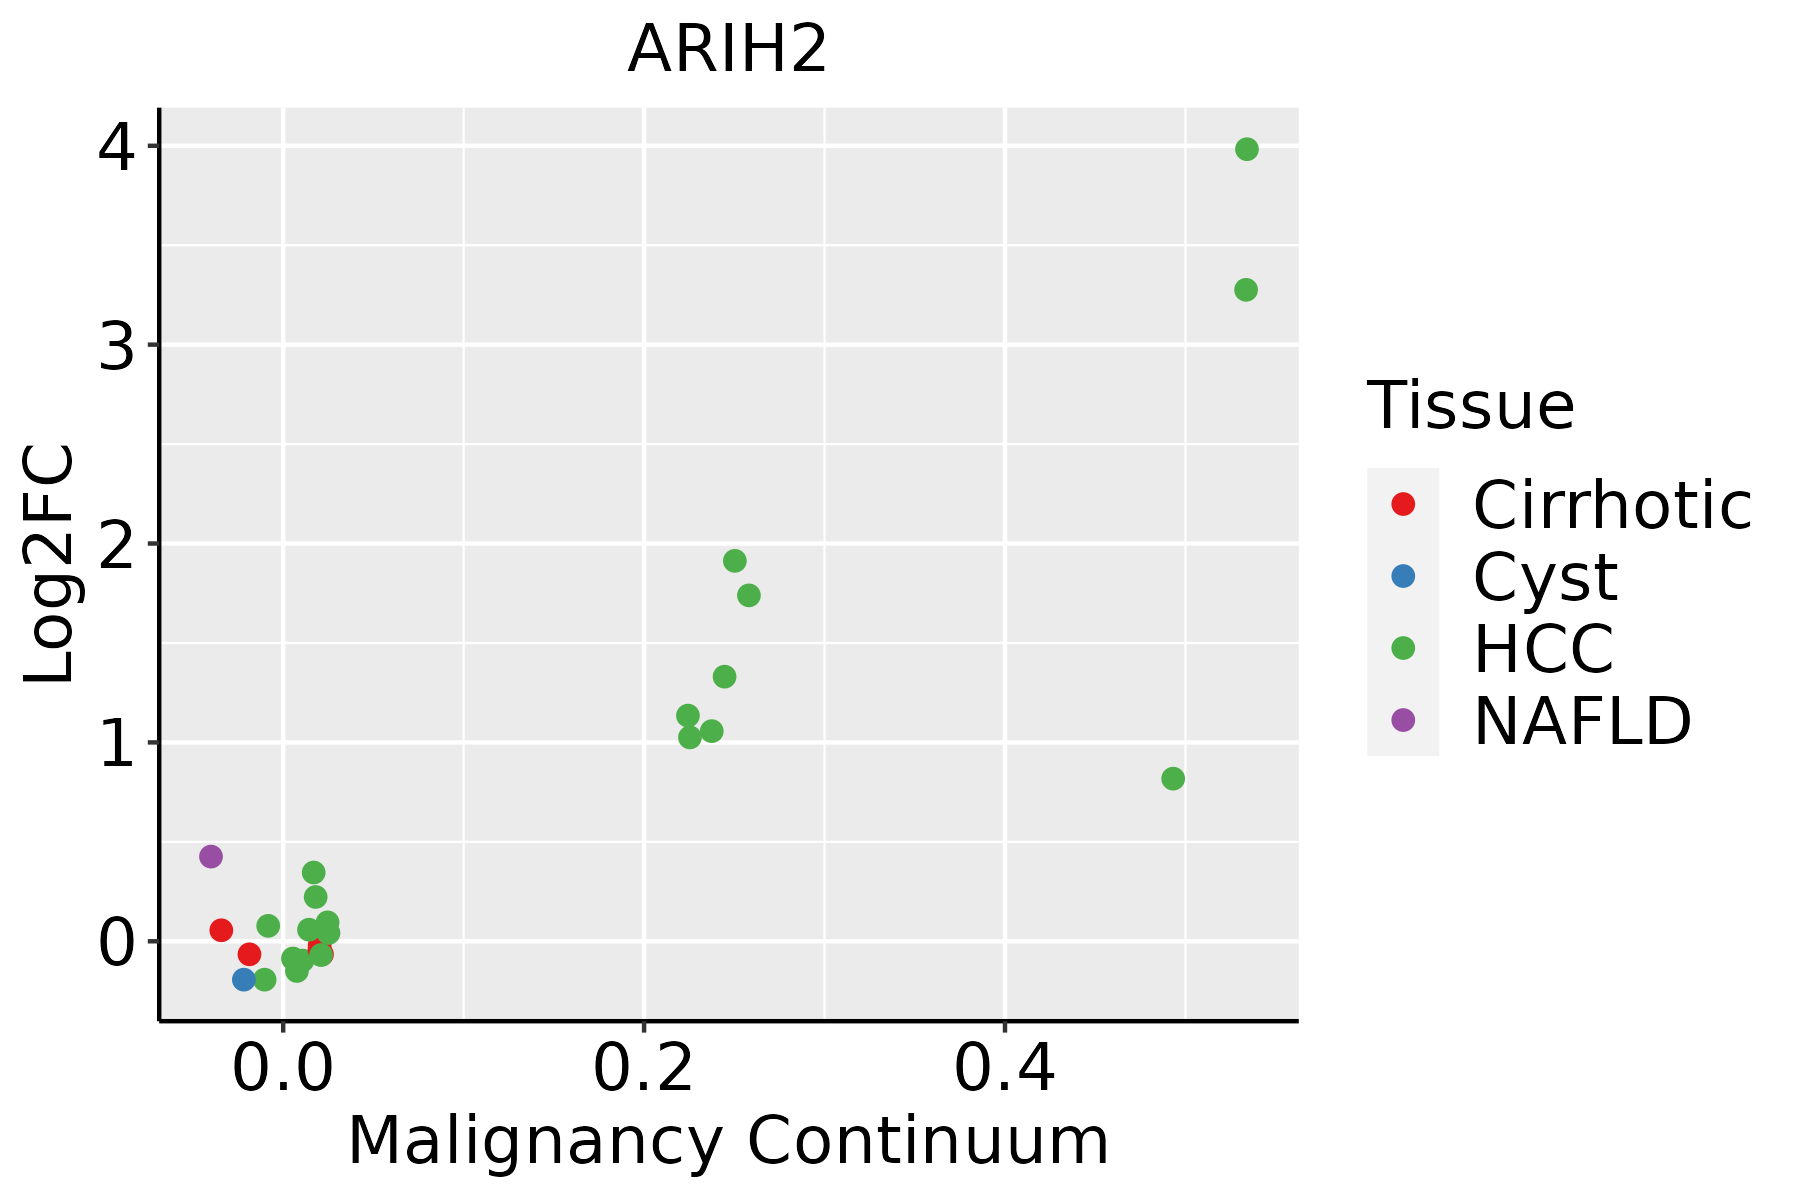 | HCC: Hepatocellular carcinoma |
| NAFLD: Non-alcoholic fatty liver disease | ||
| Oral Cavity | 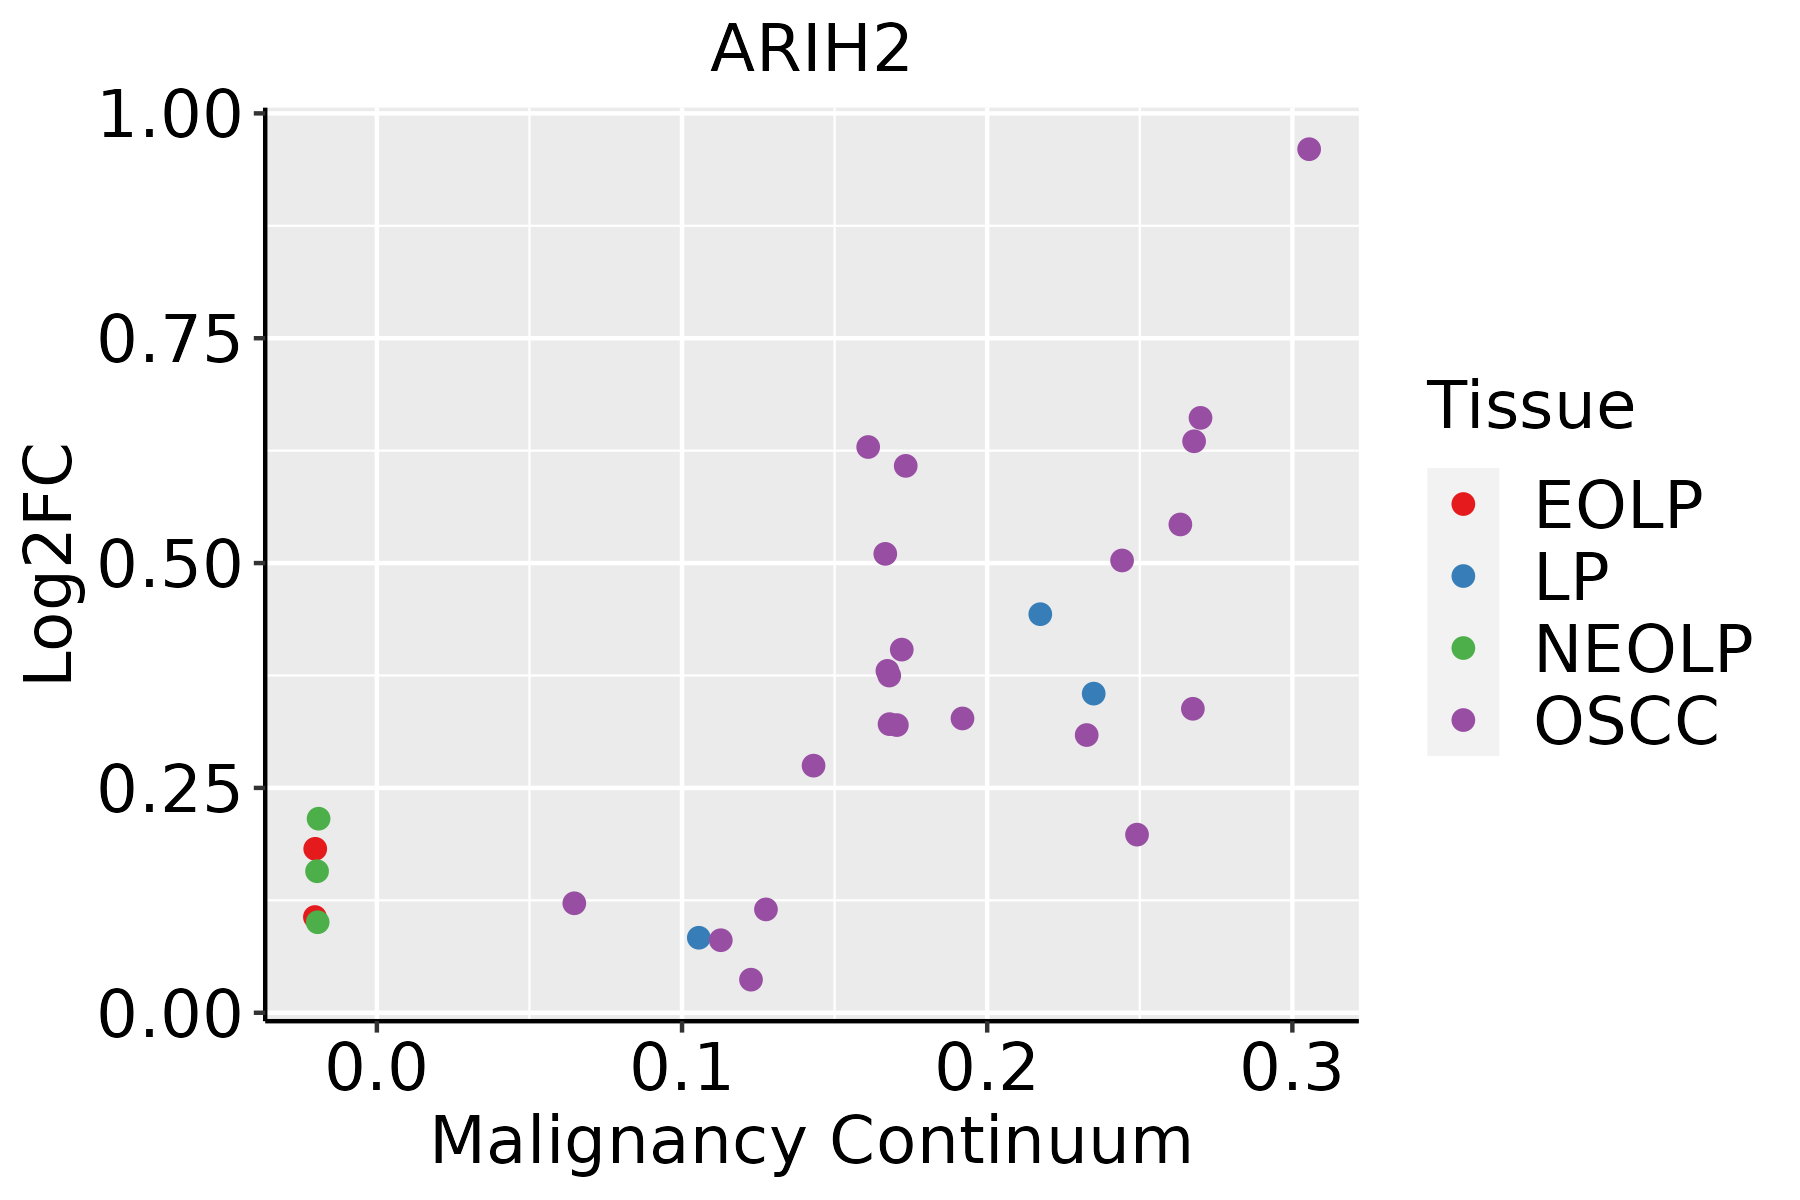 | EOLP: Erosive Oral lichen planus |
| LP: leukoplakia | ||
| NEOLP: Non-erosive oral lichen planus | ||
| OSCC: Oral squamous cell carcinoma | ||
| Skin | 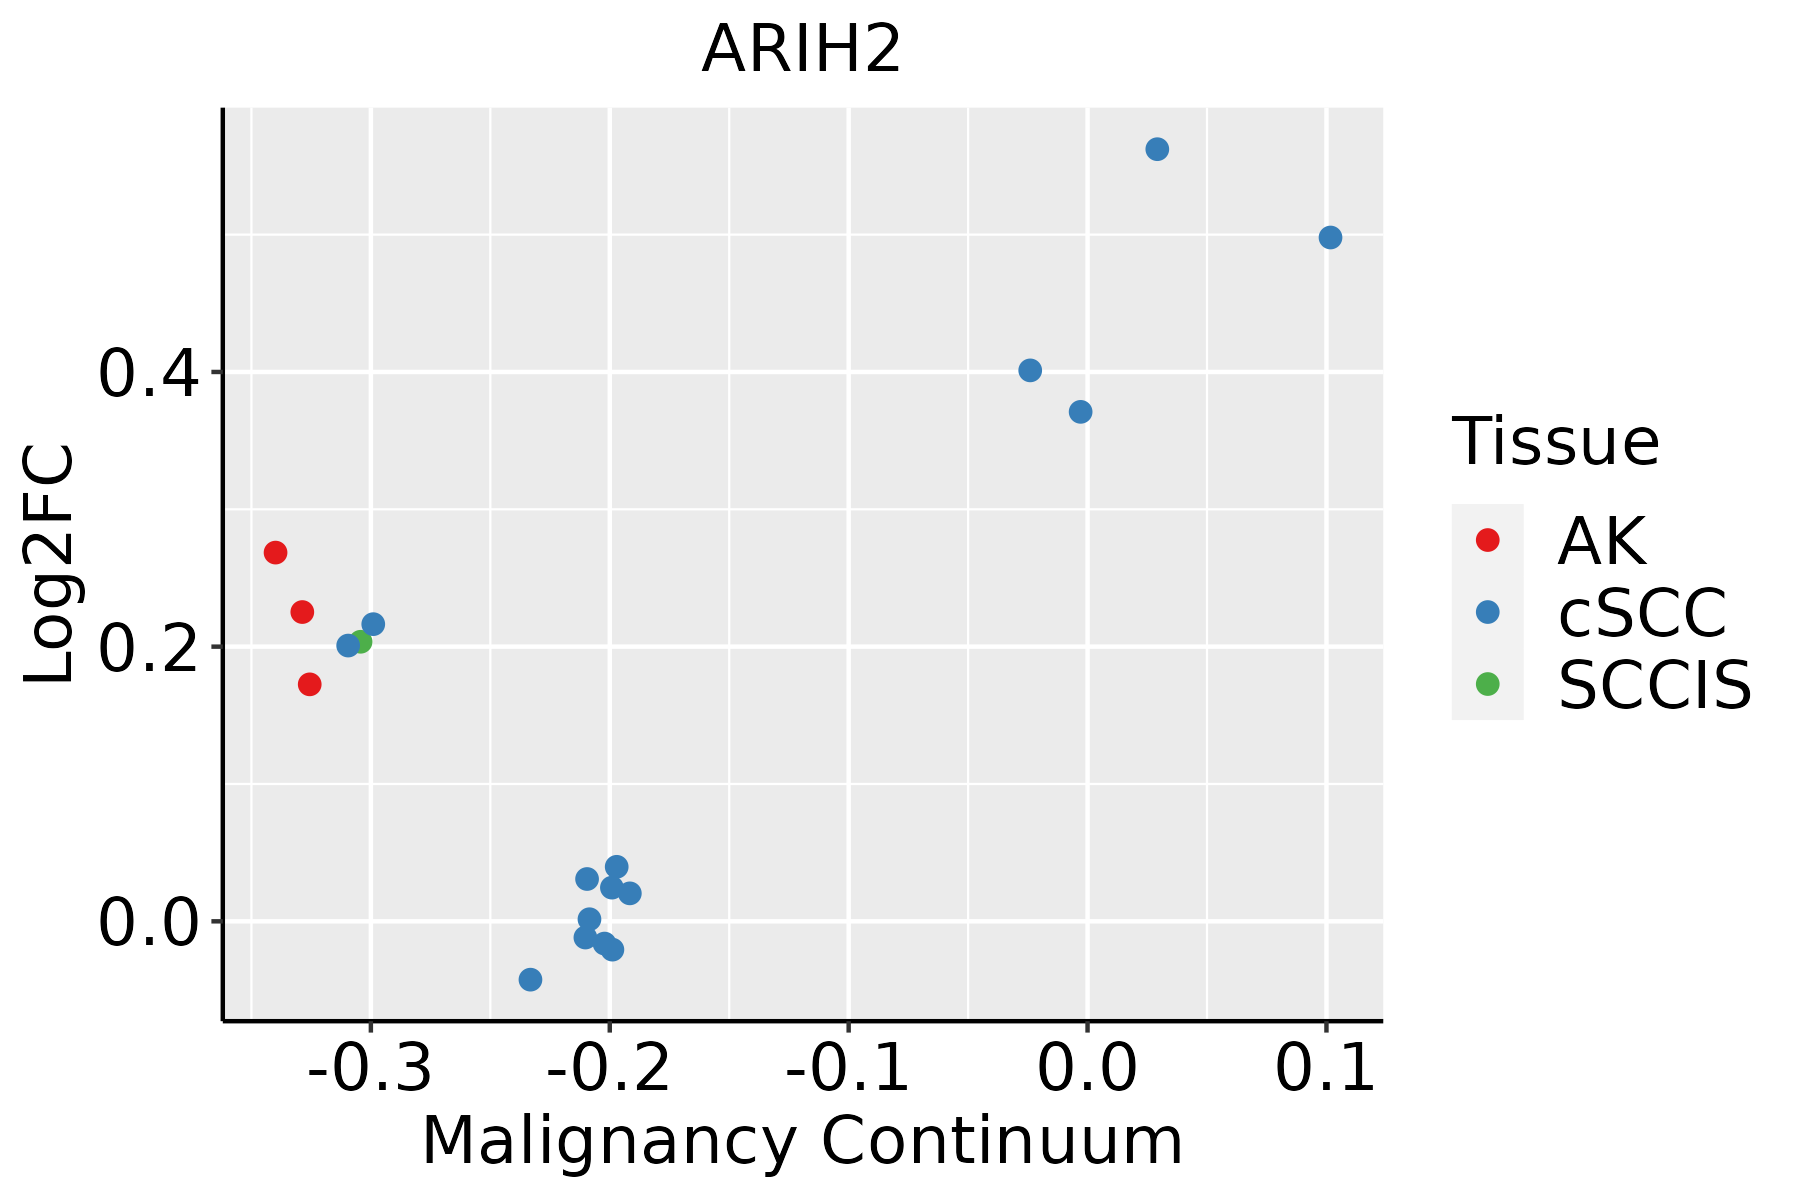 | AK: Actinic keratosis |
| cSCC: Cutaneous squamous cell carcinoma | ||
| SCCIS:squamous cell carcinoma in situ | ||
| Thyroid | 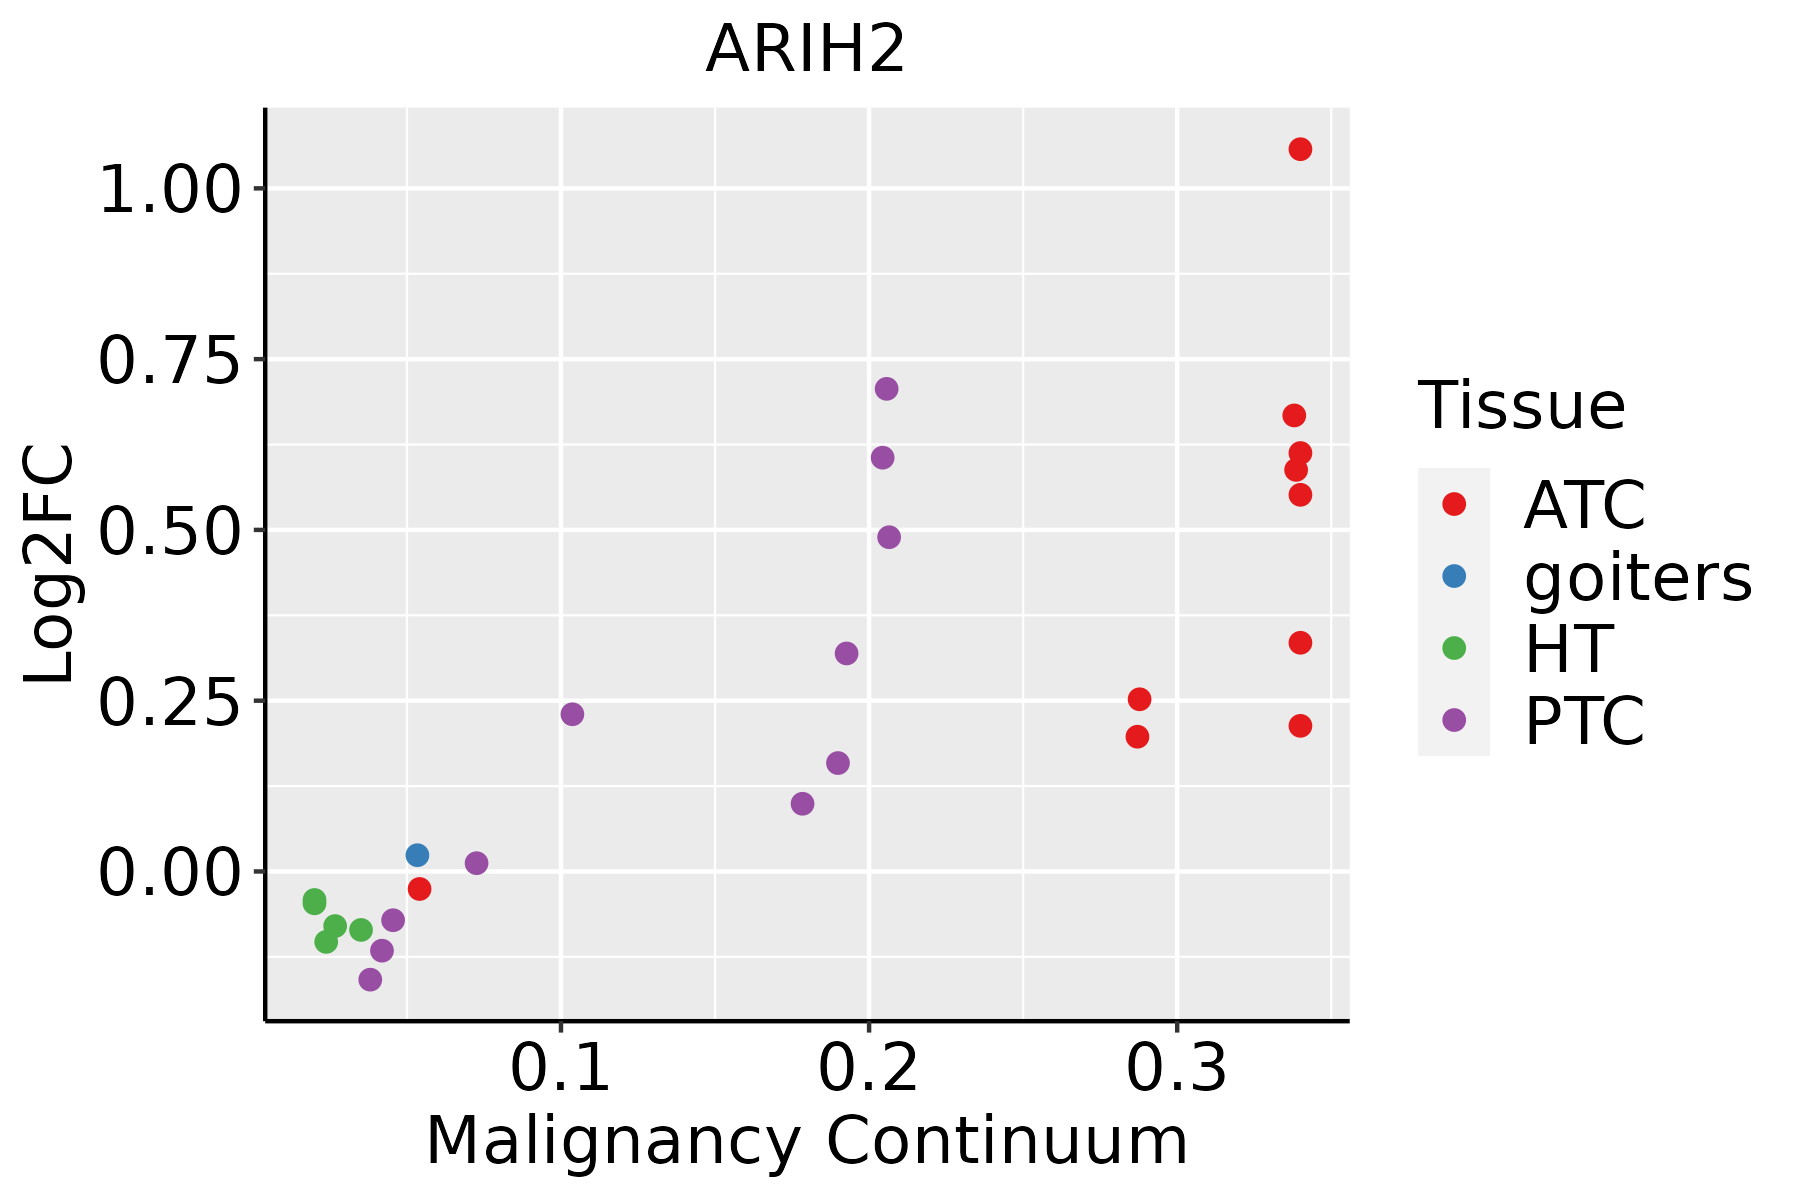 | ATC: Anaplastic thyroid cancer |
| HT: Hashimoto's thyroiditis | ||
| PTC: Papillary thyroid cancer |
| ∗log2FC in expression of this searched gene in stem-like cells from each diseased tissue sample relative to stem-like cells in normal samples in each tissue plotted against the malignancy continuum. Samples are colored based on if they are from different disease stage. |
Top |
Malignant transformation related pathway analysis |
| Find out the enriched GO biological processes and KEGG pathways involved in transition from healthy to precancer to cancer |
| Tissue | Disease Stage | Enriched GO biological Processes |
| Colorectum | AD |  |
| Colorectum | SER |  |
| Colorectum | MSS |  |
| Colorectum | MSI-H |  |
| Colorectum | FAP |  |
| ∗Top 15 enriched GO BP terms are showed in the bar plot of each disease state in each tissue. Each row represents a significant GO biological process which is colored according to the -log10(p.adjust). |
| Page: 1 2 3 4 5 6 7 8 9 |
| GO ID | Tissue | Disease Stage | Description | Gene Ratio | Bg Ratio | pvalue | p.adjust | Count |
| GO:004217627 | Esophagus | HGIN | regulation of protein catabolic process | 119/2587 | 391/18723 | 8.09e-18 | 2.43e-15 | 119 |
| GO:001049826 | Esophagus | HGIN | proteasomal protein catabolic process | 139/2587 | 490/18723 | 1.20e-17 | 3.41e-15 | 139 |
| GO:007259420 | Esophagus | HGIN | establishment of protein localization to organelle | 120/2587 | 422/18723 | 1.73e-15 | 4.00e-13 | 120 |
| GO:004586227 | Esophagus | HGIN | positive regulation of proteolysis | 107/2587 | 372/18723 | 2.61e-14 | 4.60e-12 | 107 |
| GO:004316126 | Esophagus | HGIN | proteasome-mediated ubiquitin-dependent protein catabolic process | 114/2587 | 412/18723 | 7.00e-14 | 1.20e-11 | 114 |
| GO:190336227 | Esophagus | HGIN | regulation of cellular protein catabolic process | 81/2587 | 255/18723 | 1.16e-13 | 1.93e-11 | 81 |
| GO:000989626 | Esophagus | HGIN | positive regulation of catabolic process | 126/2587 | 492/18723 | 1.46e-12 | 2.09e-10 | 126 |
| GO:003133126 | Esophagus | HGIN | positive regulation of cellular catabolic process | 112/2587 | 427/18723 | 5.15e-12 | 6.72e-10 | 112 |
| GO:190305027 | Esophagus | HGIN | regulation of proteolysis involved in cellular protein catabolic process | 70/2587 | 221/18723 | 6.21e-12 | 7.76e-10 | 70 |
| GO:006113627 | Esophagus | HGIN | regulation of proteasomal protein catabolic process | 60/2587 | 187/18723 | 1.10e-10 | 1.12e-08 | 60 |
| GO:000683920 | Esophagus | HGIN | mitochondrial transport | 74/2587 | 254/18723 | 1.32e-10 | 1.32e-08 | 74 |
| GO:004573227 | Esophagus | HGIN | positive regulation of protein catabolic process | 69/2587 | 231/18723 | 1.66e-10 | 1.64e-08 | 69 |
| GO:200005827 | Esophagus | HGIN | regulation of ubiquitin-dependent protein catabolic process | 53/2587 | 164/18723 | 9.89e-10 | 8.13e-08 | 53 |
| GO:190336427 | Esophagus | HGIN | positive regulation of cellular protein catabolic process | 51/2587 | 155/18723 | 1.01e-09 | 8.15e-08 | 51 |
| GO:190180020 | Esophagus | HGIN | positive regulation of proteasomal protein catabolic process | 41/2587 | 114/18723 | 2.25e-09 | 1.67e-07 | 41 |
| GO:190382926 | Esophagus | HGIN | positive regulation of cellular protein localization | 75/2587 | 276/18723 | 3.19e-09 | 2.30e-07 | 75 |
| GO:190305219 | Esophagus | HGIN | positive regulation of proteolysis involved in cellular protein catabolic process | 45/2587 | 133/18723 | 3.55e-09 | 2.53e-07 | 45 |
| GO:007058520 | Esophagus | HGIN | protein localization to mitochondrion | 43/2587 | 125/18723 | 4.43e-09 | 3.03e-07 | 43 |
| GO:003243427 | Esophagus | HGIN | regulation of proteasomal ubiquitin-dependent protein catabolic process | 45/2587 | 134/18723 | 4.64e-09 | 3.12e-07 | 45 |
| GO:007265520 | Esophagus | HGIN | establishment of protein localization to mitochondrion | 41/2587 | 120/18723 | 1.26e-08 | 7.96e-07 | 41 |
| Page: 1 2 3 4 5 6 7 8 9 10 11 12 13 14 15 16 17 18 19 |
| Pathway ID | Tissue | Disease Stage | Description | Gene Ratio | Bg Ratio | pvalue | p.adjust | qvalue | Count |
| Page: 1 |
Top |
Cell-cell communication analysis |
| Identification of potential cell-cell interactions between two cell types and their ligand-receptor pairs for different disease states |
| Ligand | Receptor | LRpair | Pathway | Tissue | Disease Stage |
| Page: 1 |
Top |
Single-cell gene regulatory network inference analysis |
| Find out the significant the regulons (TFs) and the target genes of each regulon across cell types for different disease states |
| TF | Cell Type | Tissue | Disease Stage | Target Gene | RSS | Regulon Activity |
| ∗The dot plots of a searched regulon are shown for all cell subpopulations in each disease state of each tissue based on the regulon specific score inferred using pySCENIC and by calculating the average expression. |
| Page: 1 |
Top |
Somatic mutation of malignant transformation related genes |
| Annotation of somatic variants for genes involved in malignant transformation |
| Hugo Symbol | Variant Class | Variant Classification | dbSNP RS | HGVSc | HGVSp | HGVSp Short | SWISSPROT | BIOTYPE | SIFT | PolyPhen | Tumor Sample Barcode | Tissue | Histology | Sex | Age | Stage | Therapy Types | Drugs | Outcome |
| ARIH2 | SNV | Missense_Mutation | c.782N>A | p.Arg261His | p.R261H | O95376 | protein_coding | tolerated(0.07) | benign(0.007) | TCGA-GM-A2DD-01 | Breast | breast invasive carcinoma | Female | <65 | I/II | Chemotherapy | fluorouracil | CR | |
| ARIH2 | SNV | Missense_Mutation | novel | c.1295A>T | p.Tyr432Phe | p.Y432F | O95376 | protein_coding | deleterious(0.03) | possibly_damaging(0.788) | TCGA-UC-A7PD-01 | Cervix | cervical & endocervical cancer | Female | <65 | I/II | Unknown | Unknown | PD |
| ARIH2 | SNV | Missense_Mutation | c.980T>C | p.Leu327Pro | p.L327P | O95376 | protein_coding | deleterious(0) | probably_damaging(0.995) | TCGA-A6-5661-01 | Colorectum | colon adenocarcinoma | Female | >=65 | I/II | Unknown | Unknown | SD | |
| ARIH2 | SNV | Missense_Mutation | c.923G>T | p.Gly308Val | p.G308V | O95376 | protein_coding | deleterious(0) | probably_damaging(0.998) | TCGA-AZ-6600-01 | Colorectum | colon adenocarcinoma | Male | <65 | III/IV | Chemotherapy | cpt-11 | PD | |
| ARIH2 | SNV | Missense_Mutation | c.760N>A | p.Glu254Lys | p.E254K | O95376 | protein_coding | deleterious(0.03) | possibly_damaging(0.585) | TCGA-AG-A002-01 | Colorectum | rectum adenocarcinoma | Male | <65 | I/II | Unknown | Unknown | SD | |
| ARIH2 | SNV | Missense_Mutation | novel | c.828N>C | p.Trp276Cys | p.W276C | O95376 | protein_coding | deleterious(0) | probably_damaging(0.993) | TCGA-F5-6814-01 | Colorectum | rectum adenocarcinoma | Male | <65 | I/II | Unknown | Unknown | SD |
| ARIH2 | SNV | Missense_Mutation | novel | c.323N>A | p.Arg108Lys | p.R108K | O95376 | protein_coding | tolerated(0.85) | benign(0.014) | TCGA-A5-A0G2-01 | Endometrium | uterine corpus endometrioid carcinoma | Female | <65 | III/IV | Unknown | Unknown | SD |
| ARIH2 | SNV | Missense_Mutation | novel | c.323N>T | p.Arg108Ile | p.R108I | O95376 | protein_coding | tolerated(0.14) | possibly_damaging(0.473) | TCGA-A5-A1OF-01 | Endometrium | uterine corpus endometrioid carcinoma | Female | <65 | I/II | Unknown | Unknown | SD |
| ARIH2 | SNV | Missense_Mutation | novel | c.1244N>G | p.Lys415Arg | p.K415R | O95376 | protein_coding | tolerated(0.41) | benign(0.001) | TCGA-A5-A1OF-01 | Endometrium | uterine corpus endometrioid carcinoma | Female | <65 | I/II | Unknown | Unknown | SD |
| ARIH2 | SNV | Missense_Mutation | novel | c.118G>A | p.Val40Met | p.V40M | O95376 | protein_coding | tolerated(0.13) | benign(0.038) | TCGA-AJ-A3EK-01 | Endometrium | uterine corpus endometrioid carcinoma | Female | <65 | I/II | Chemotherapy | carboplatin | CR |
| Page: 1 2 3 4 |
Top |
Related drugs of malignant transformation related genes |
| Identification of chemicals and drugs interact with genes involved in malignant transfromation |
| (DGIdb 4.0) |
| Entrez ID | Symbol | Category | Interaction Types | Drug Claim Name | Drug Name | PMIDs |
| Page: 1 |

Copyright 2023-Present -The University of Texas Health Science Center at Houston |