
|
|||||
|
 | |
| |
| |
| |
| |
| |
|
Gene: APOPT1 |
Gene summary for APOPT1 |
| Gene information | Species | Human | Gene symbol | APOPT1 | Gene ID | 84334 |
| Gene name | cytochrome c oxidase assembly factor 8 | |
| Gene Alias | APOP | |
| Cytomap | 14q32.33 | |
| Gene Type | protein-coding | GO ID | GO:0000302 | UniProtAcc | Q96IL0 |
Top |
Malignant transformation analysis |
| Identification of the aberrant gene expression in precancerous and cancerous lesions by comparing the gene expression of stem-like cells in diseased tissues with normal stem cells |
| Entrez ID | Symbol | Replicates | Species | Organ | Tissue | Adj P-value | Log2FC | Malignancy |
| 84334 | APOPT1 | P30T-E | Human | Esophagus | ESCC | 3.64e-09 | 2.12e-01 | 0.137 |
| 84334 | APOPT1 | P31T-E | Human | Esophagus | ESCC | 2.79e-12 | 1.54e-01 | 0.1251 |
| 84334 | APOPT1 | P32T-E | Human | Esophagus | ESCC | 4.55e-18 | 4.25e-01 | 0.1666 |
| 84334 | APOPT1 | P36T-E | Human | Esophagus | ESCC | 2.65e-03 | 1.02e-01 | 0.1187 |
| 84334 | APOPT1 | P37T-E | Human | Esophagus | ESCC | 3.02e-21 | 3.26e-01 | 0.1371 |
| 84334 | APOPT1 | P39T-E | Human | Esophagus | ESCC | 1.32e-06 | -3.79e-02 | 0.0894 |
| 84334 | APOPT1 | P40T-E | Human | Esophagus | ESCC | 1.19e-05 | 8.84e-02 | 0.109 |
| 84334 | APOPT1 | P42T-E | Human | Esophagus | ESCC | 3.09e-06 | 1.99e-01 | 0.1175 |
| 84334 | APOPT1 | P47T-E | Human | Esophagus | ESCC | 1.01e-09 | 7.69e-02 | 0.1067 |
| 84334 | APOPT1 | P48T-E | Human | Esophagus | ESCC | 2.42e-09 | 5.82e-02 | 0.0959 |
| 84334 | APOPT1 | P49T-E | Human | Esophagus | ESCC | 8.61e-12 | 8.17e-01 | 0.1768 |
| 84334 | APOPT1 | P52T-E | Human | Esophagus | ESCC | 1.27e-12 | 1.44e-01 | 0.1555 |
| 84334 | APOPT1 | P54T-E | Human | Esophagus | ESCC | 5.89e-13 | 2.33e-01 | 0.0975 |
| 84334 | APOPT1 | P56T-E | Human | Esophagus | ESCC | 4.00e-02 | 4.23e-01 | 0.1613 |
| 84334 | APOPT1 | P57T-E | Human | Esophagus | ESCC | 1.33e-07 | 2.48e-01 | 0.0926 |
| 84334 | APOPT1 | P61T-E | Human | Esophagus | ESCC | 1.83e-13 | 4.20e-01 | 0.099 |
| 84334 | APOPT1 | P62T-E | Human | Esophagus | ESCC | 3.98e-21 | 3.24e-01 | 0.1302 |
| 84334 | APOPT1 | P65T-E | Human | Esophagus | ESCC | 2.98e-15 | 2.34e-01 | 0.0978 |
| 84334 | APOPT1 | P74T-E | Human | Esophagus | ESCC | 2.42e-19 | 4.18e-01 | 0.1479 |
| 84334 | APOPT1 | P75T-E | Human | Esophagus | ESCC | 1.63e-20 | 3.27e-01 | 0.1125 |
| Page: 1 2 3 4 5 6 |
| Tissue | Expression Dynamics | Abbreviation |
| Esophagus |  | ESCC: Esophageal squamous cell carcinoma |
| HGIN: High-grade intraepithelial neoplasias | ||
| LGIN: Low-grade intraepithelial neoplasias | ||
| Liver | 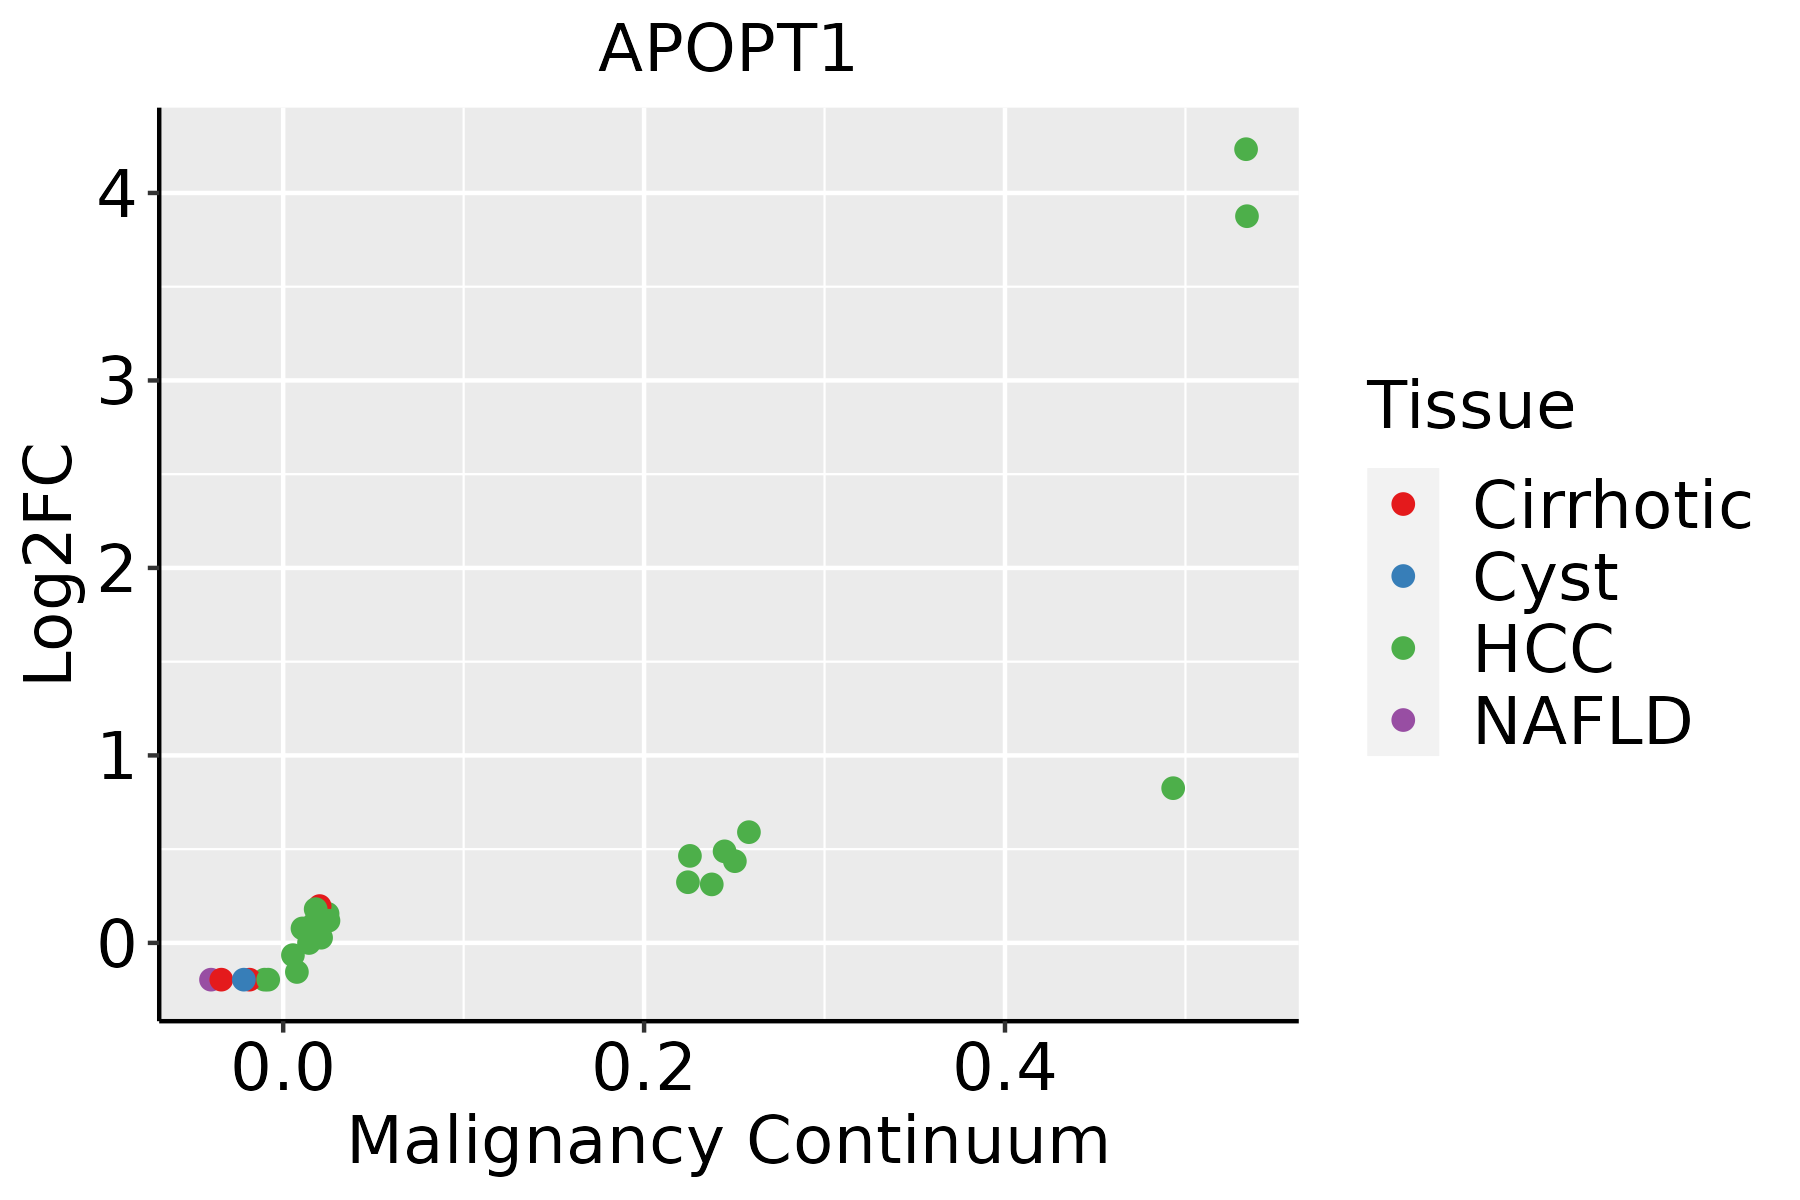 | HCC: Hepatocellular carcinoma |
| NAFLD: Non-alcoholic fatty liver disease | ||
| Oral Cavity | 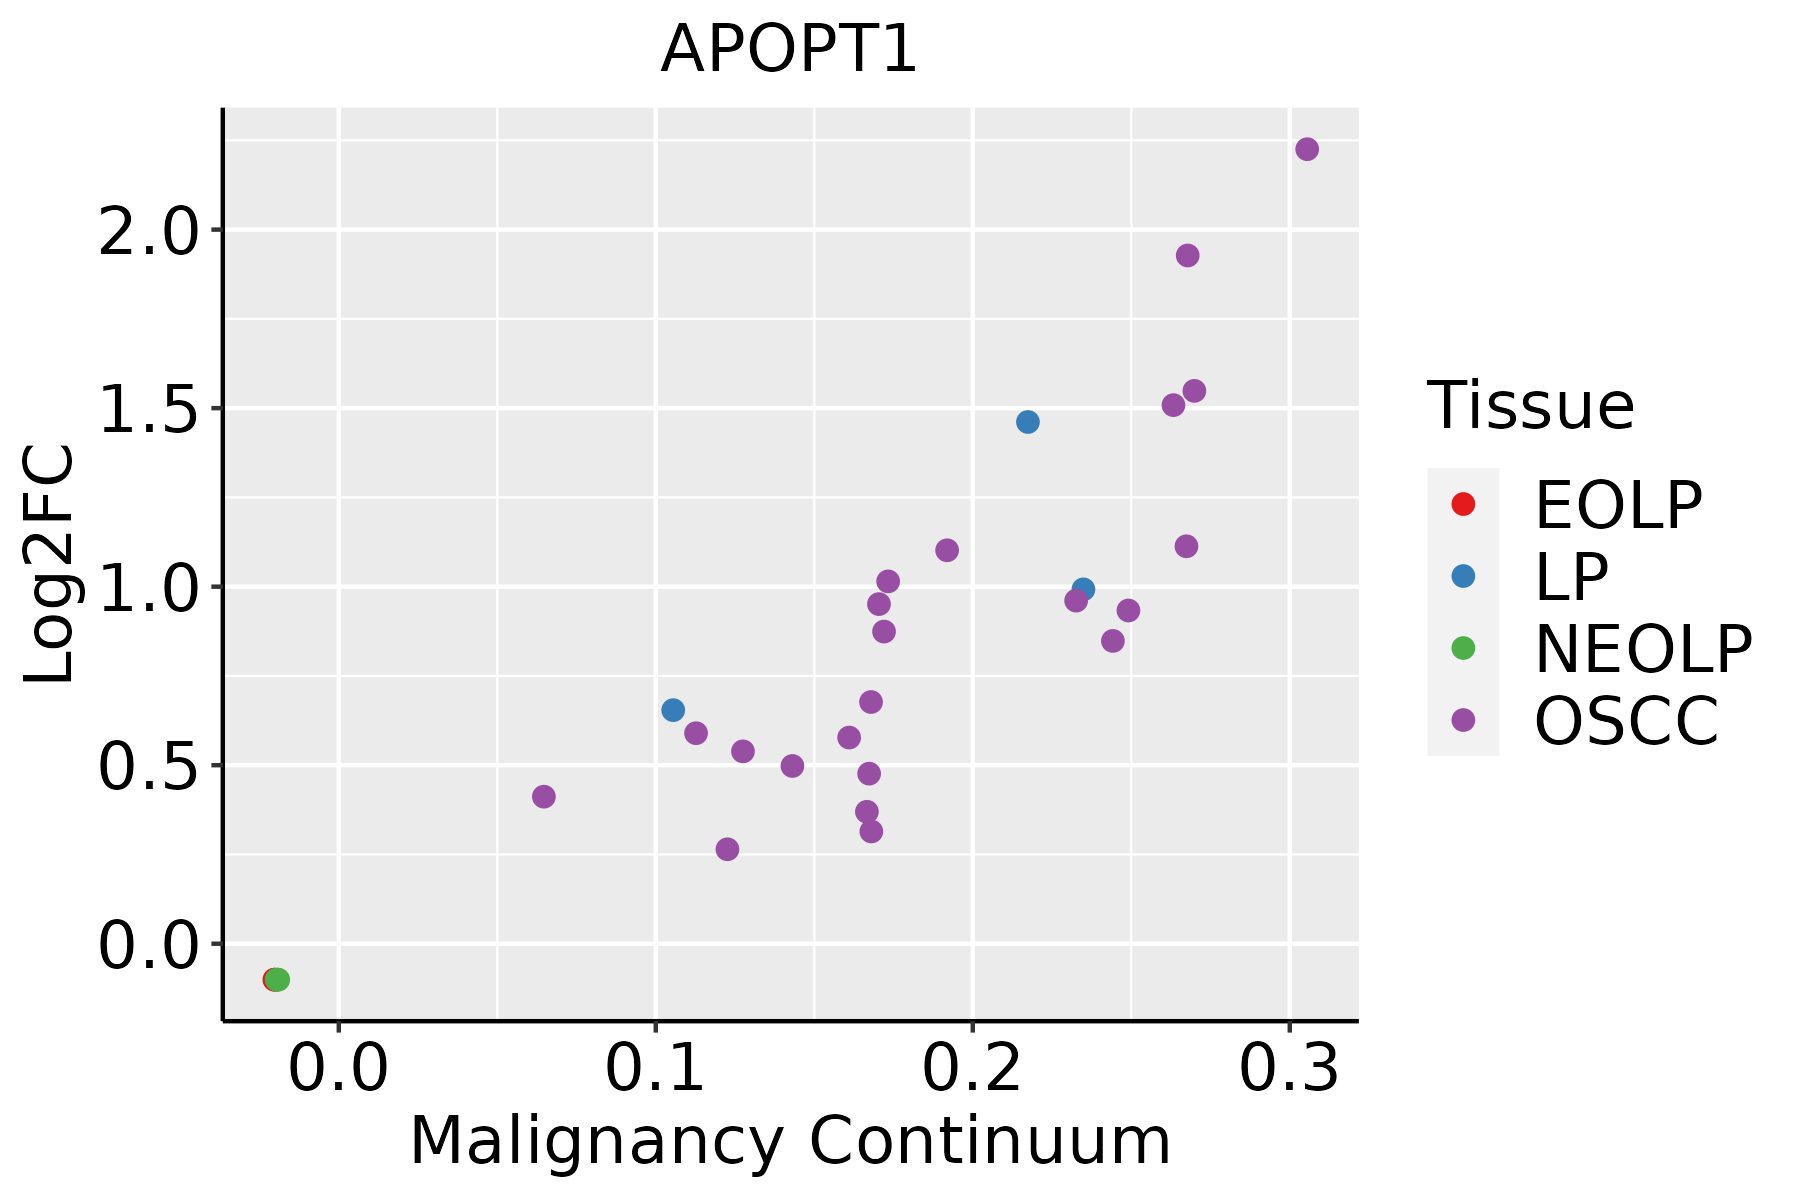 | EOLP: Erosive Oral lichen planus |
| LP: leukoplakia | ||
| NEOLP: Non-erosive oral lichen planus | ||
| OSCC: Oral squamous cell carcinoma | ||
| Prostate |  | BPH: Benign Prostatic Hyperplasia |
| Skin | 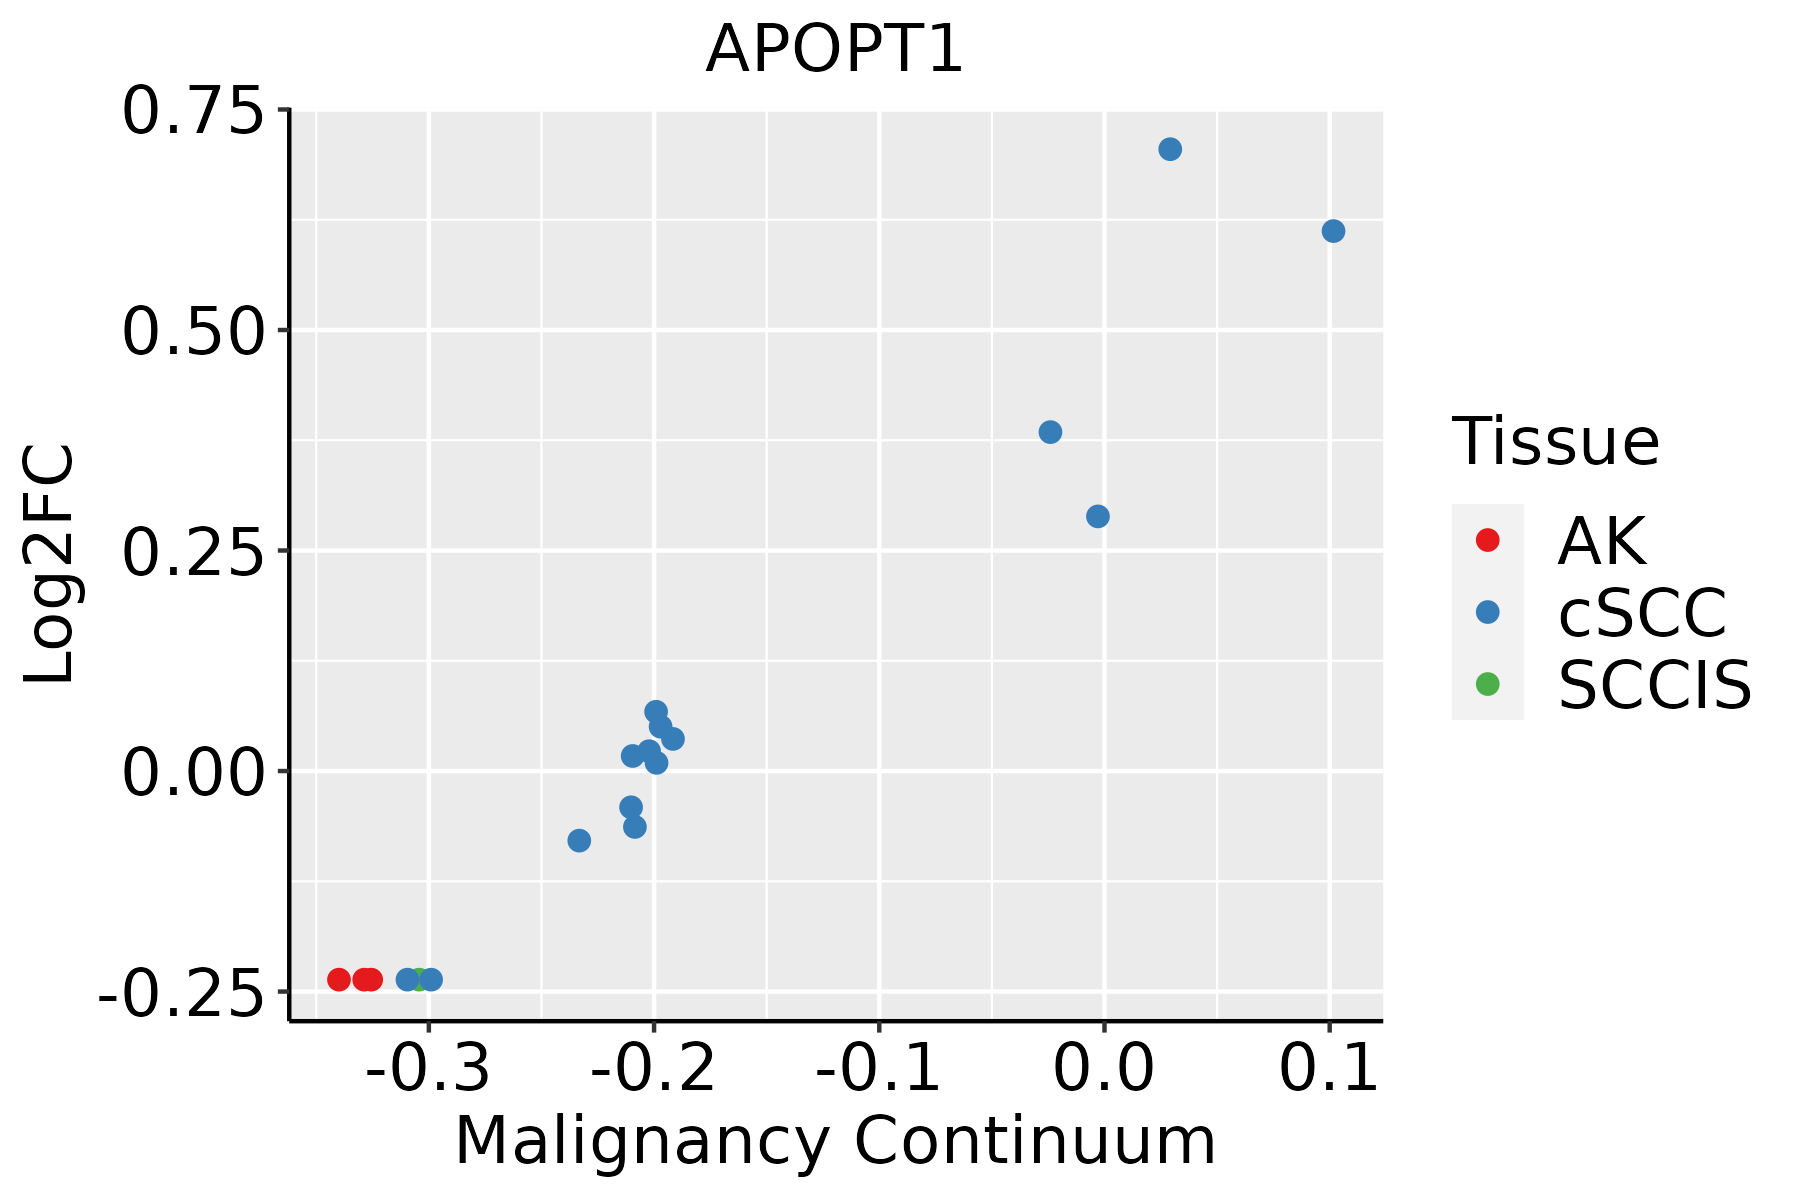 | AK: Actinic keratosis |
| cSCC: Cutaneous squamous cell carcinoma | ||
| SCCIS:squamous cell carcinoma in situ | ||
| Thyroid | 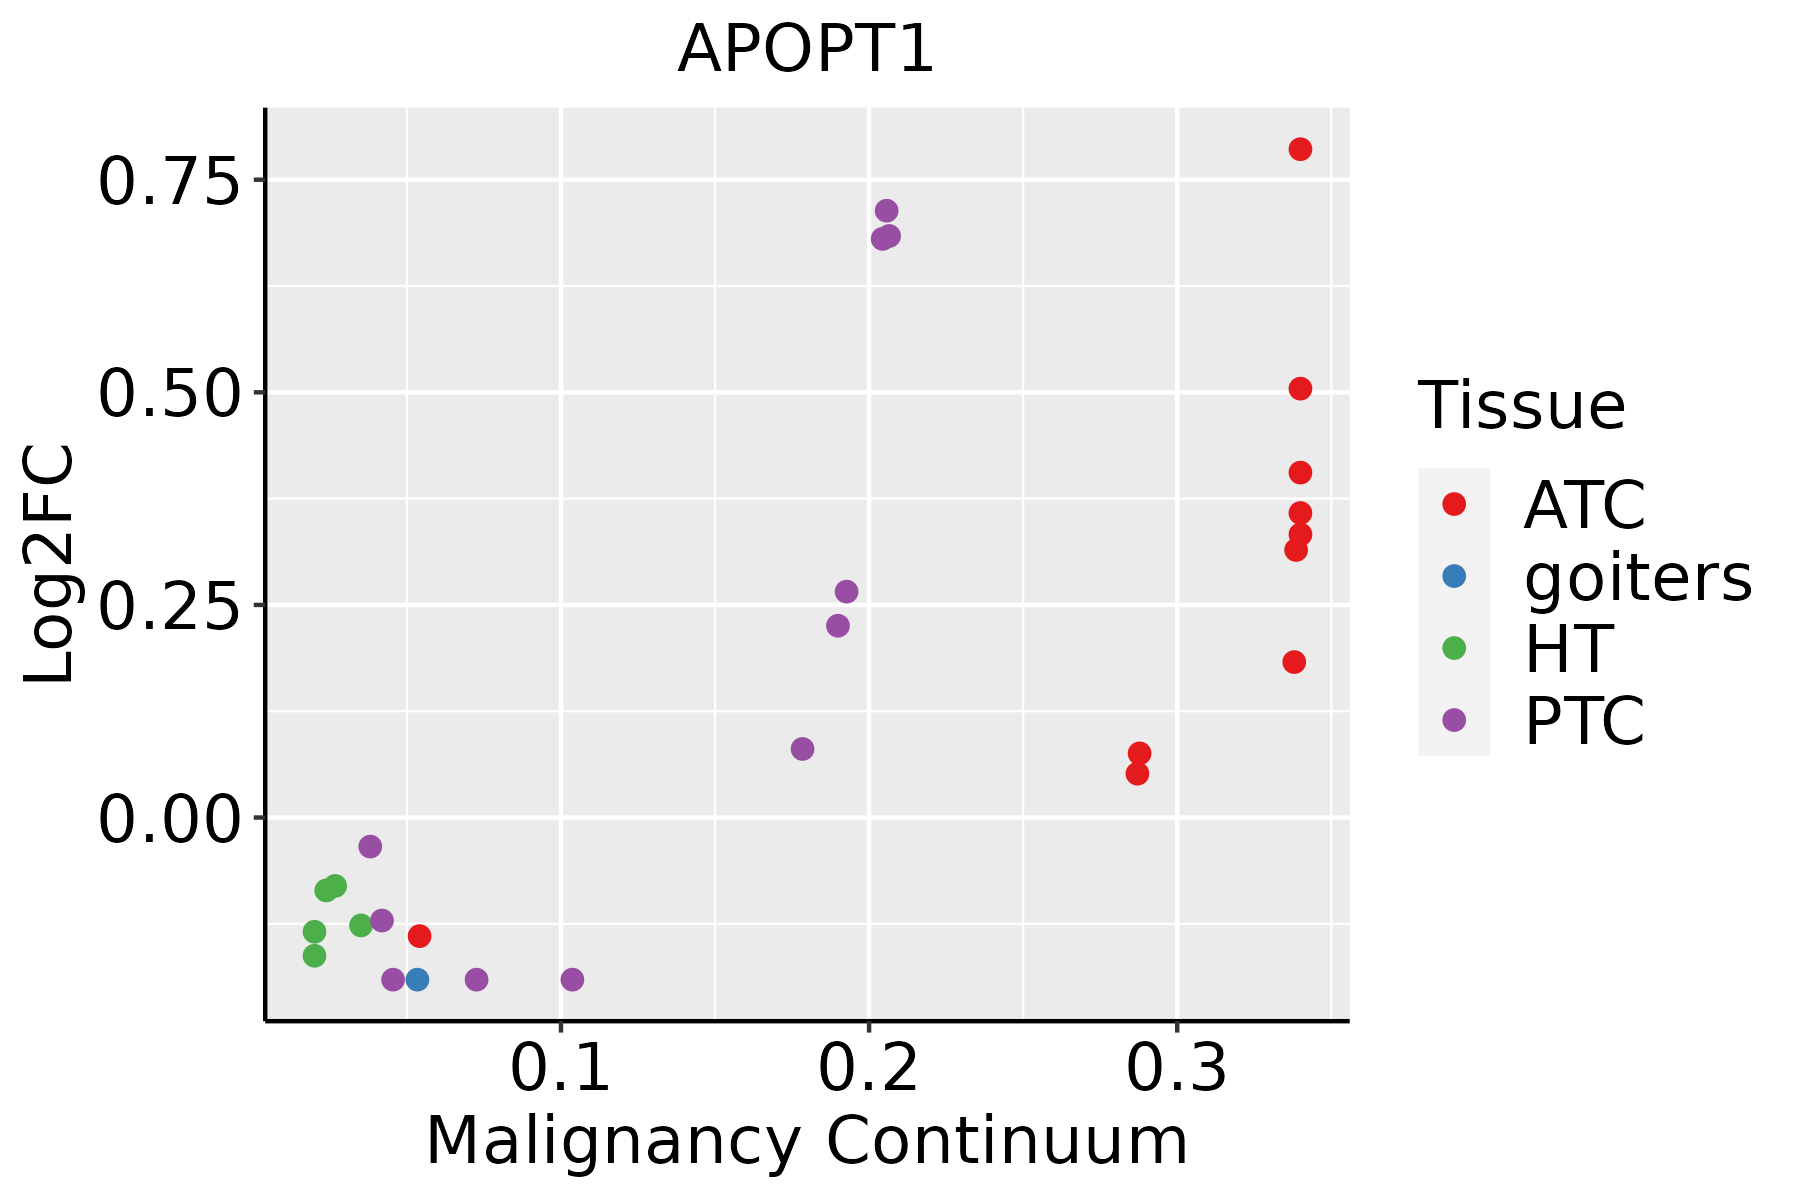 | ATC: Anaplastic thyroid cancer |
| HT: Hashimoto's thyroiditis | ||
| PTC: Papillary thyroid cancer |
| ∗log2FC in expression of this searched gene in stem-like cells from each diseased tissue sample relative to stem-like cells in normal samples in each tissue plotted against the malignancy continuum. Samples are colored based on if they are from different disease stage. |
Top |
Malignant transformation related pathway analysis |
| Find out the enriched GO biological processes and KEGG pathways involved in transition from healthy to precancer to cancer |
| Tissue | Disease Stage | Enriched GO biological Processes |
| Colorectum | AD |  |
| Colorectum | SER |  |
| Colorectum | MSS |  |
| Colorectum | MSI-H |  |
| Colorectum | FAP |  |
| ∗Top 15 enriched GO BP terms are showed in the bar plot of each disease state in each tissue. Each row represents a significant GO biological process which is colored according to the -log10(p.adjust). |
| Page: 1 2 3 4 5 6 7 8 9 |
| GO ID | Tissue | Disease Stage | Description | Gene Ratio | Bg Ratio | pvalue | p.adjust | Count |
| Page: 1 |
| Pathway ID | Tissue | Disease Stage | Description | Gene Ratio | Bg Ratio | pvalue | p.adjust | qvalue | Count |
| Page: 1 |
Top |
Cell-cell communication analysis |
| Identification of potential cell-cell interactions between two cell types and their ligand-receptor pairs for different disease states |
| Ligand | Receptor | LRpair | Pathway | Tissue | Disease Stage |
| Page: 1 |
Top |
Single-cell gene regulatory network inference analysis |
| Find out the significant the regulons (TFs) and the target genes of each regulon across cell types for different disease states |
| TF | Cell Type | Tissue | Disease Stage | Target Gene | RSS | Regulon Activity |
| ∗The dot plots of a searched regulon are shown for all cell subpopulations in each disease state of each tissue based on the regulon specific score inferred using pySCENIC and by calculating the average expression. |
| Page: 1 |
Top |
Somatic mutation of malignant transformation related genes |
| Annotation of somatic variants for genes involved in malignant transformation |
| Hugo Symbol | Variant Class | Variant Classification | dbSNP RS | HGVSc | HGVSp | HGVSp Short | SWISSPROT | BIOTYPE | SIFT | PolyPhen | Tumor Sample Barcode | Tissue | Histology | Sex | Age | Stage | Therapy Types | Drugs | Outcome |
| APOPT1 | SNV | Missense_Mutation | rs756550363 | c.530N>A | p.Arg177His | p.R177H | Q96IL0 | protein_coding | deleterious(0.03) | possibly_damaging(0.765) | TCGA-AA-A00N-01 | Colorectum | colon adenocarcinoma | Male | >=65 | I/II | Unknown | Unknown | PD |
| APOPT1 | SNV | Missense_Mutation | c.527N>C | p.Lys176Thr | p.K176T | Q96IL0 | protein_coding | deleterious(0) | probably_damaging(0.934) | TCGA-G4-6586-01 | Colorectum | colon adenocarcinoma | Female | >=65 | I/II | Unknown | Unknown | SD | |
| APOPT1 | SNV | Missense_Mutation | c.539N>T | p.Ala180Val | p.A180V | Q96IL0 | protein_coding | tolerated(0.06) | benign(0.025) | TCGA-NH-A5IV-01 | Colorectum | colon adenocarcinoma | Female | >=65 | I/II | Unknown | Unknown | SD | |
| APOPT1 | SNV | Missense_Mutation | novel | c.217G>T | p.Asp73Tyr | p.D73Y | Q96IL0 | protein_coding | deleterious(0) | probably_damaging(0.983) | TCGA-A5-A0G2-01 | Endometrium | uterine corpus endometrioid carcinoma | Female | <65 | III/IV | Unknown | Unknown | SD |
| APOPT1 | SNV | Missense_Mutation | novel | c.292A>C | p.Lys98Gln | p.K98Q | Q96IL0 | protein_coding | tolerated(0.14) | benign(0.022) | TCGA-A5-A2K5-01 | Endometrium | uterine corpus endometrioid carcinoma | Female | >=65 | I/II | Unknown | Unknown | SD |
| APOPT1 | SNV | Missense_Mutation | rs756869402 | c.255N>G | p.Ile85Met | p.I85M | Q96IL0 | protein_coding | deleterious(0.01) | possibly_damaging(0.77) | TCGA-DI-A1BU-01 | Endometrium | uterine corpus endometrioid carcinoma | Female | <65 | I/II | Chemotherapy | paclitaxel | SD |
| APOPT1 | SNV | Missense_Mutation | rs562472810 | c.472N>A | p.Glu158Lys | p.E158K | Q96IL0 | protein_coding | tolerated(0.11) | benign(0.339) | TCGA-FI-A2D0-01 | Endometrium | uterine corpus endometrioid carcinoma | Female | <65 | I/II | Unknown | Unknown | SD |
| APOPT1 | SNV | Missense_Mutation | c.415N>G | p.Thr139Ala | p.T139A | Q96IL0 | protein_coding | tolerated(0.62) | benign(0.001) | TCGA-BC-4073-01 | Liver | liver hepatocellular carcinoma | Male | >=65 | III/IV | Targeted Molecular therapy | sorafenib | SD | |
| APOPT1 | SNV | Missense_Mutation | novel | c.40N>T | p.Met14Leu | p.M14L | Q96IL0 | protein_coding | tolerated(0.15) | benign(0) | TCGA-DD-AACL-01 | Liver | liver hepatocellular carcinoma | Female | >=65 | I/II | Unknown | Unknown | SD |
| APOPT1 | SNV | Missense_Mutation | rs747124583 | c.370N>A | p.Glu124Lys | p.E124K | Q96IL0 | protein_coding | tolerated(0.11) | benign(0.031) | TCGA-91-8499-01 | Lung | lung adenocarcinoma | Female | >=65 | I/II | Unknown | Unknown | SD |
| Page: 1 2 |
Top |
Related drugs of malignant transformation related genes |
| Identification of chemicals and drugs interact with genes involved in malignant transfromation |
| (DGIdb 4.0) |
| Entrez ID | Symbol | Category | Interaction Types | Drug Claim Name | Drug Name | PMIDs |
| Page: 1 |

Copyright 2023-Present -The University of Texas Health Science Center at Houston |