
|
|||||
|
 | |
| |
| |
| |
| |
| |
|
Gene: ANXA5 |
Gene summary for ANXA5 |
| Gene information | Species | Human | Gene symbol | ANXA5 | Gene ID | 308 |
| Gene name | annexin A5 | |
| Gene Alias | ANX5 | |
| Cytomap | 4q27 | |
| Gene Type | protein-coding | GO ID | GO:0006915 | UniProtAcc | P08758 |
Top |
Malignant transformation analysis |
| Identification of the aberrant gene expression in precancerous and cancerous lesions by comparing the gene expression of stem-like cells in diseased tissues with normal stem cells |
| Entrez ID | Symbol | Replicates | Species | Organ | Tissue | Adj P-value | Log2FC | Malignancy |
| 308 | ANXA5 | GSM4909319 | Human | Breast | IDC | 9.13e-45 | -6.95e-01 | 0.1563 |
| 308 | ANXA5 | GSM4909320 | Human | Breast | IDC | 1.16e-13 | -7.44e-01 | 0.1575 |
| 308 | ANXA5 | GSM4909321 | Human | Breast | IDC | 2.48e-32 | -6.64e-01 | 0.1559 |
| 308 | ANXA5 | ctrl6 | Human | Breast | Precancer | 1.14e-04 | 4.39e-01 | -0.0061 |
| 308 | ANXA5 | brca1 | Human | Breast | Precancer | 1.40e-18 | 5.33e-01 | -0.0338 |
| 308 | ANXA5 | brca2 | Human | Breast | Precancer | 2.93e-11 | 4.22e-01 | -0.024 |
| 308 | ANXA5 | brca3 | Human | Breast | Precancer | 6.11e-19 | 5.11e-01 | -0.0263 |
| 308 | ANXA5 | brca10 | Human | Breast | Precancer | 4.26e-20 | 5.80e-01 | -0.0029 |
| 308 | ANXA5 | M1 | Human | Breast | IDC | 4.80e-05 | -4.30e-01 | 0.1577 |
| 308 | ANXA5 | NCCBC14 | Human | Breast | DCIS | 8.52e-26 | 3.62e-01 | 0.2021 |
| 308 | ANXA5 | NCCBC5 | Human | Breast | DCIS | 1.01e-13 | 1.10e-02 | 0.2046 |
| 308 | ANXA5 | P1 | Human | Breast | IDC | 2.10e-22 | -4.64e-01 | 0.1527 |
| 308 | ANXA5 | P2 | Human | Breast | IDC | 1.84e-03 | 2.35e-01 | 0.21 |
| 308 | ANXA5 | DCIS2 | Human | Breast | DCIS | 5.44e-46 | 2.42e-01 | 0.0085 |
| 308 | ANXA5 | CA_HPV_1 | Human | Cervix | CC | 1.91e-15 | 1.84e-01 | 0.0264 |
| 308 | ANXA5 | N_HPV_1 | Human | Cervix | N_HPV | 1.15e-03 | 1.97e-01 | 0.0079 |
| 308 | ANXA5 | N_HPV_2 | Human | Cervix | N_HPV | 4.10e-03 | 2.69e-01 | -0.0131 |
| 308 | ANXA5 | CCI_2 | Human | Cervix | CC | 2.35e-04 | -6.04e-01 | 0.5249 |
| 308 | ANXA5 | CCI_3 | Human | Cervix | CC | 5.06e-06 | -5.90e-01 | 0.516 |
| 308 | ANXA5 | CCII_1 | Human | Cervix | CC | 1.08e-22 | -7.99e-01 | 0.3249 |
| Page: 1 2 3 4 5 6 7 8 9 10 11 12 13 14 |
| Tissue | Expression Dynamics | Abbreviation |
| Breast | 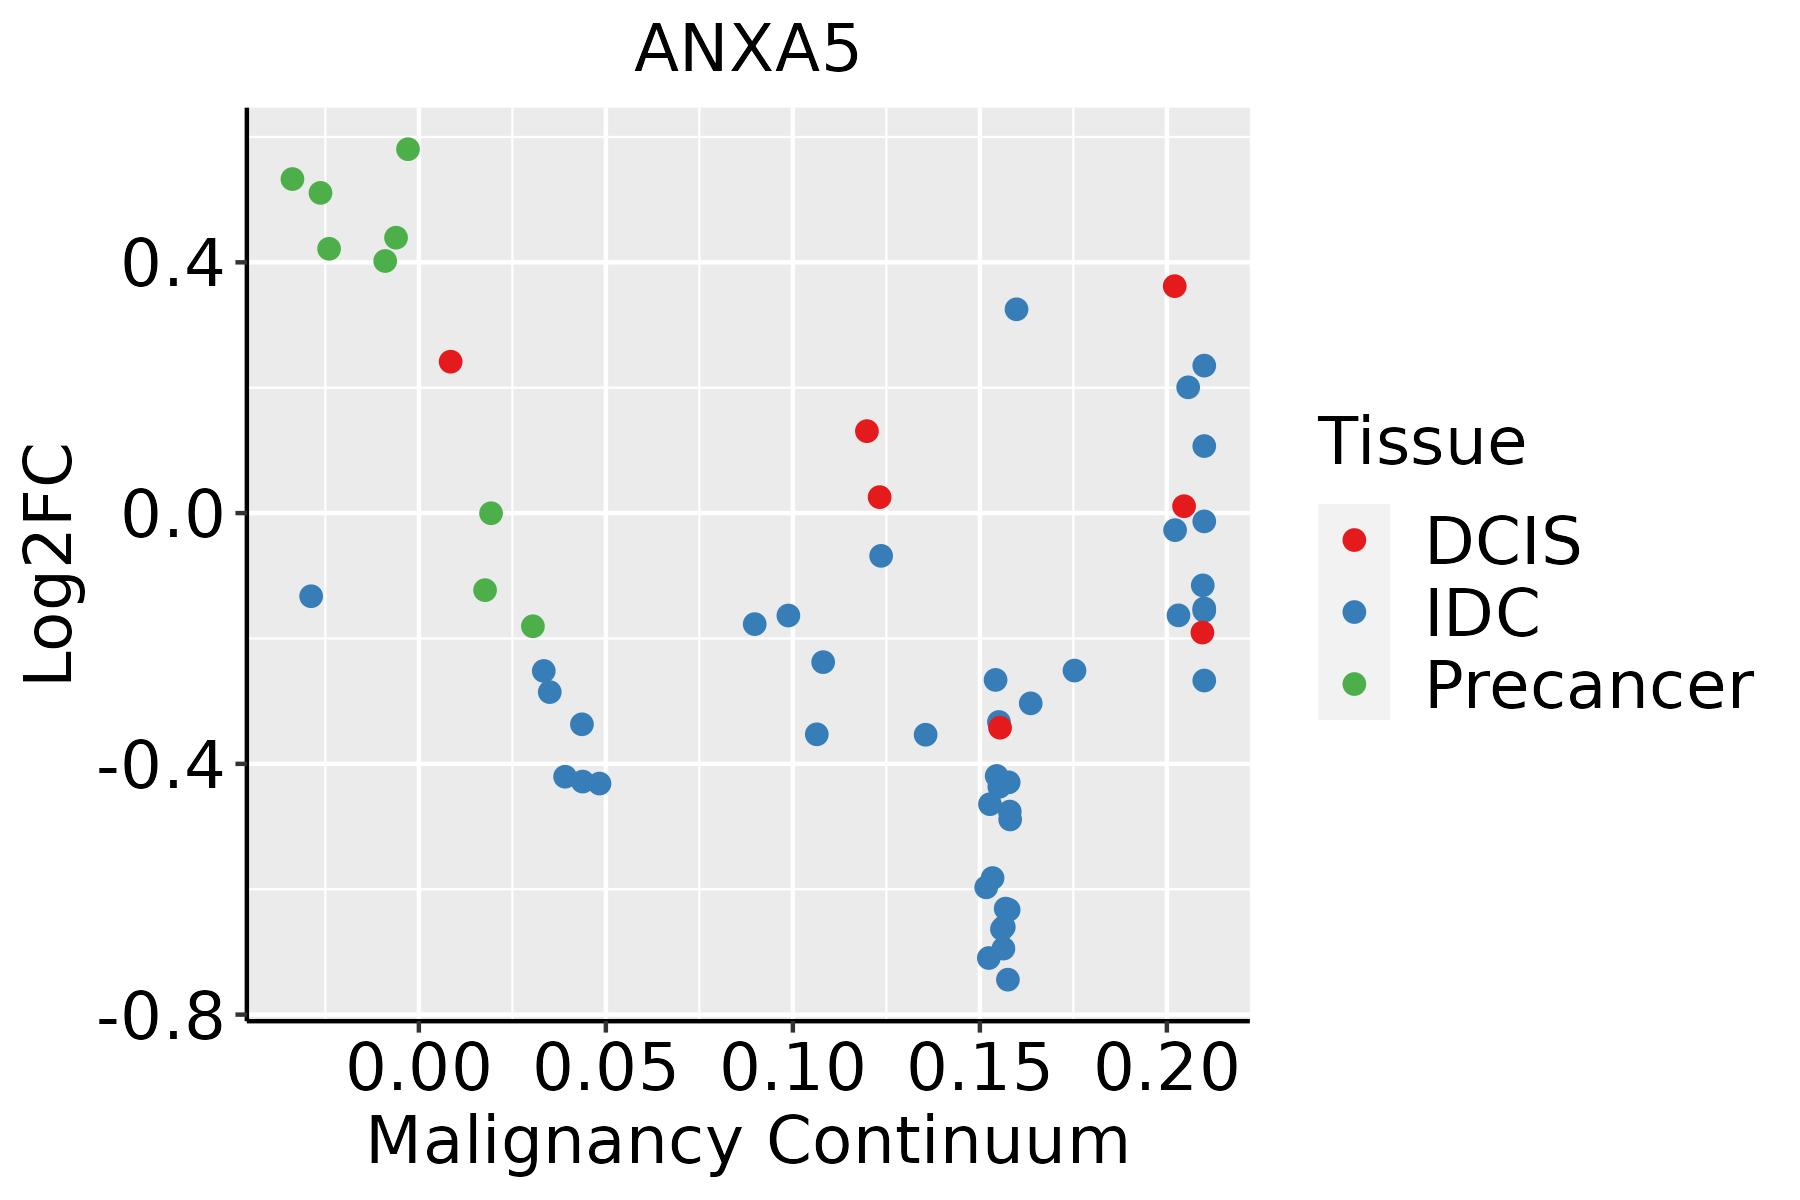 | IDC: Invasive ductal carcinoma |
| DCIS: Ductal carcinoma in situ | ||
| Precancer(BRCA1-mut): Precancerous lesion from BRCA1 mutation carriers | ||
| Cervix | 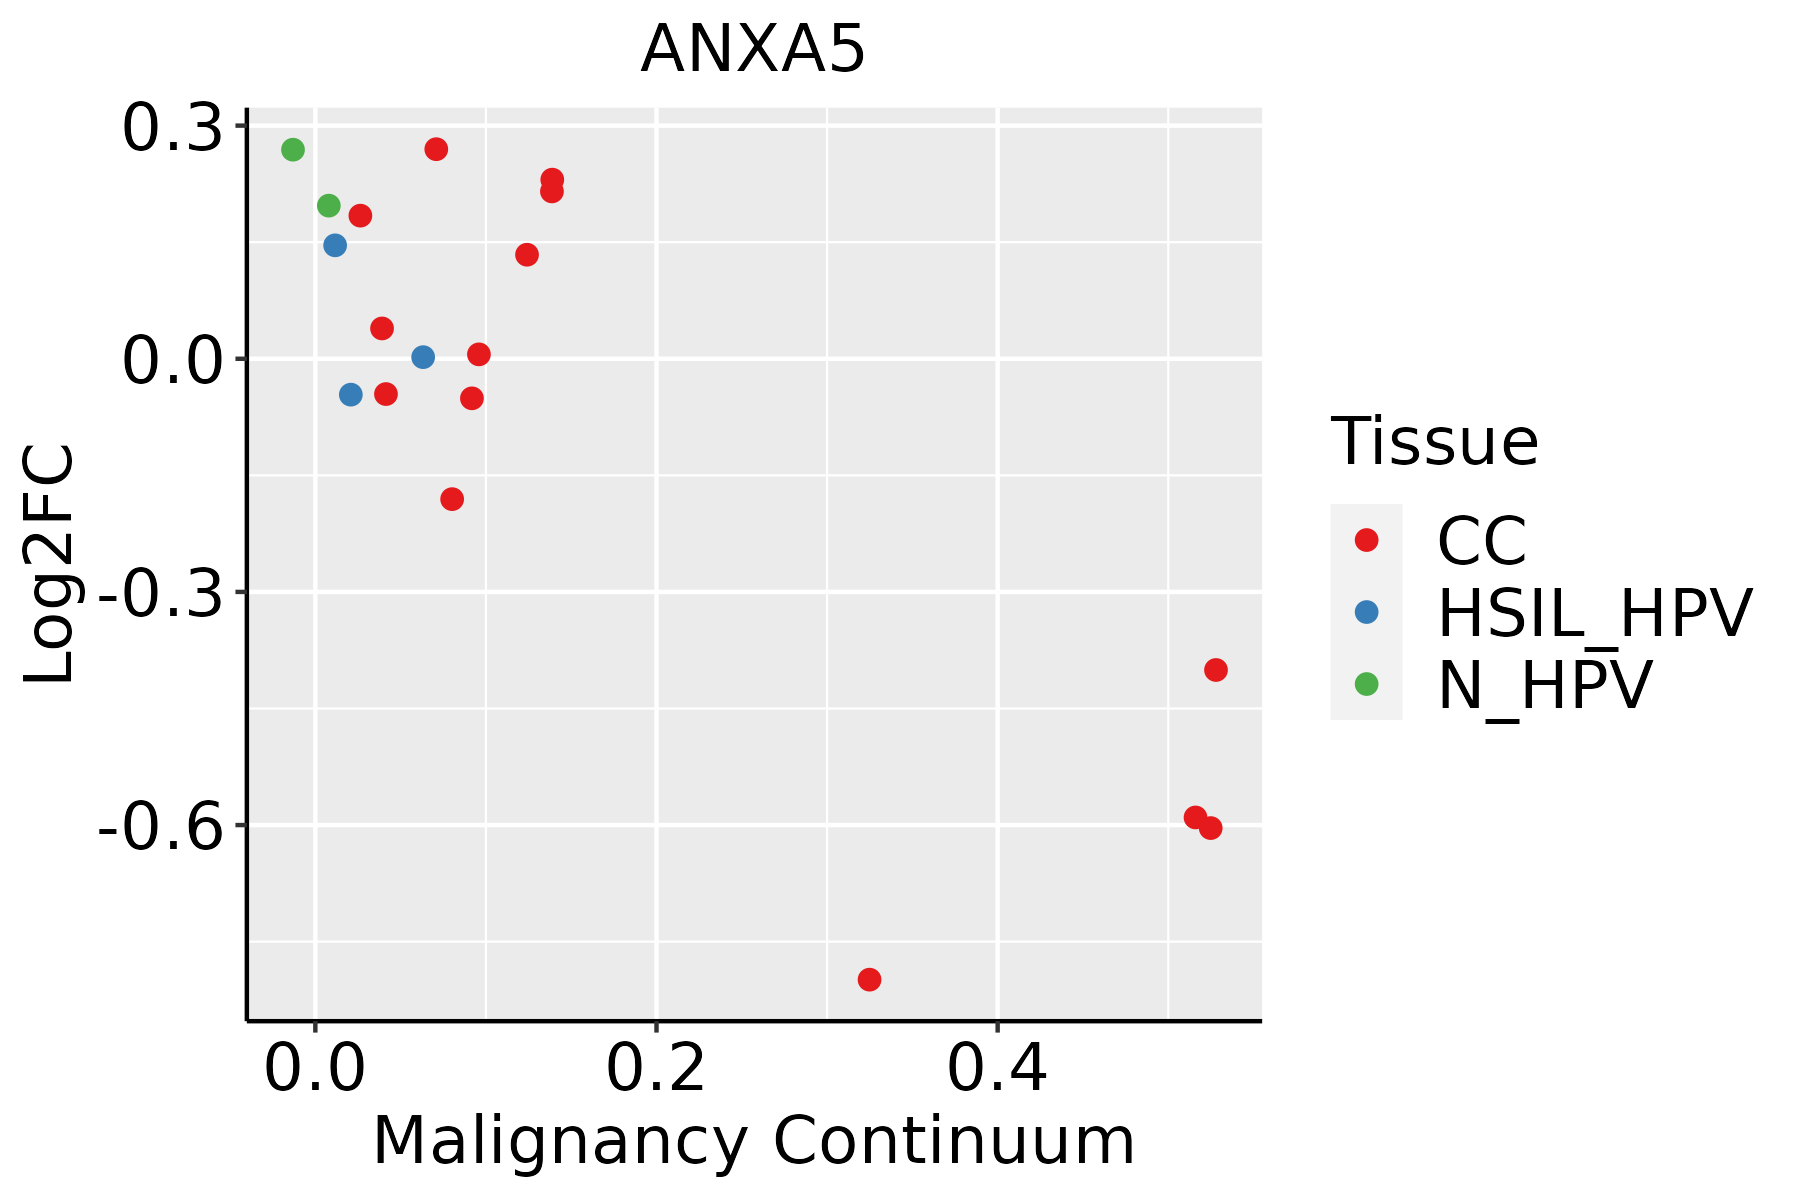 | CC: Cervix cancer |
| HSIL_HPV: HPV-infected high-grade squamous intraepithelial lesions | ||
| N_HPV: HPV-infected normal cervix | ||
| Endometrium | 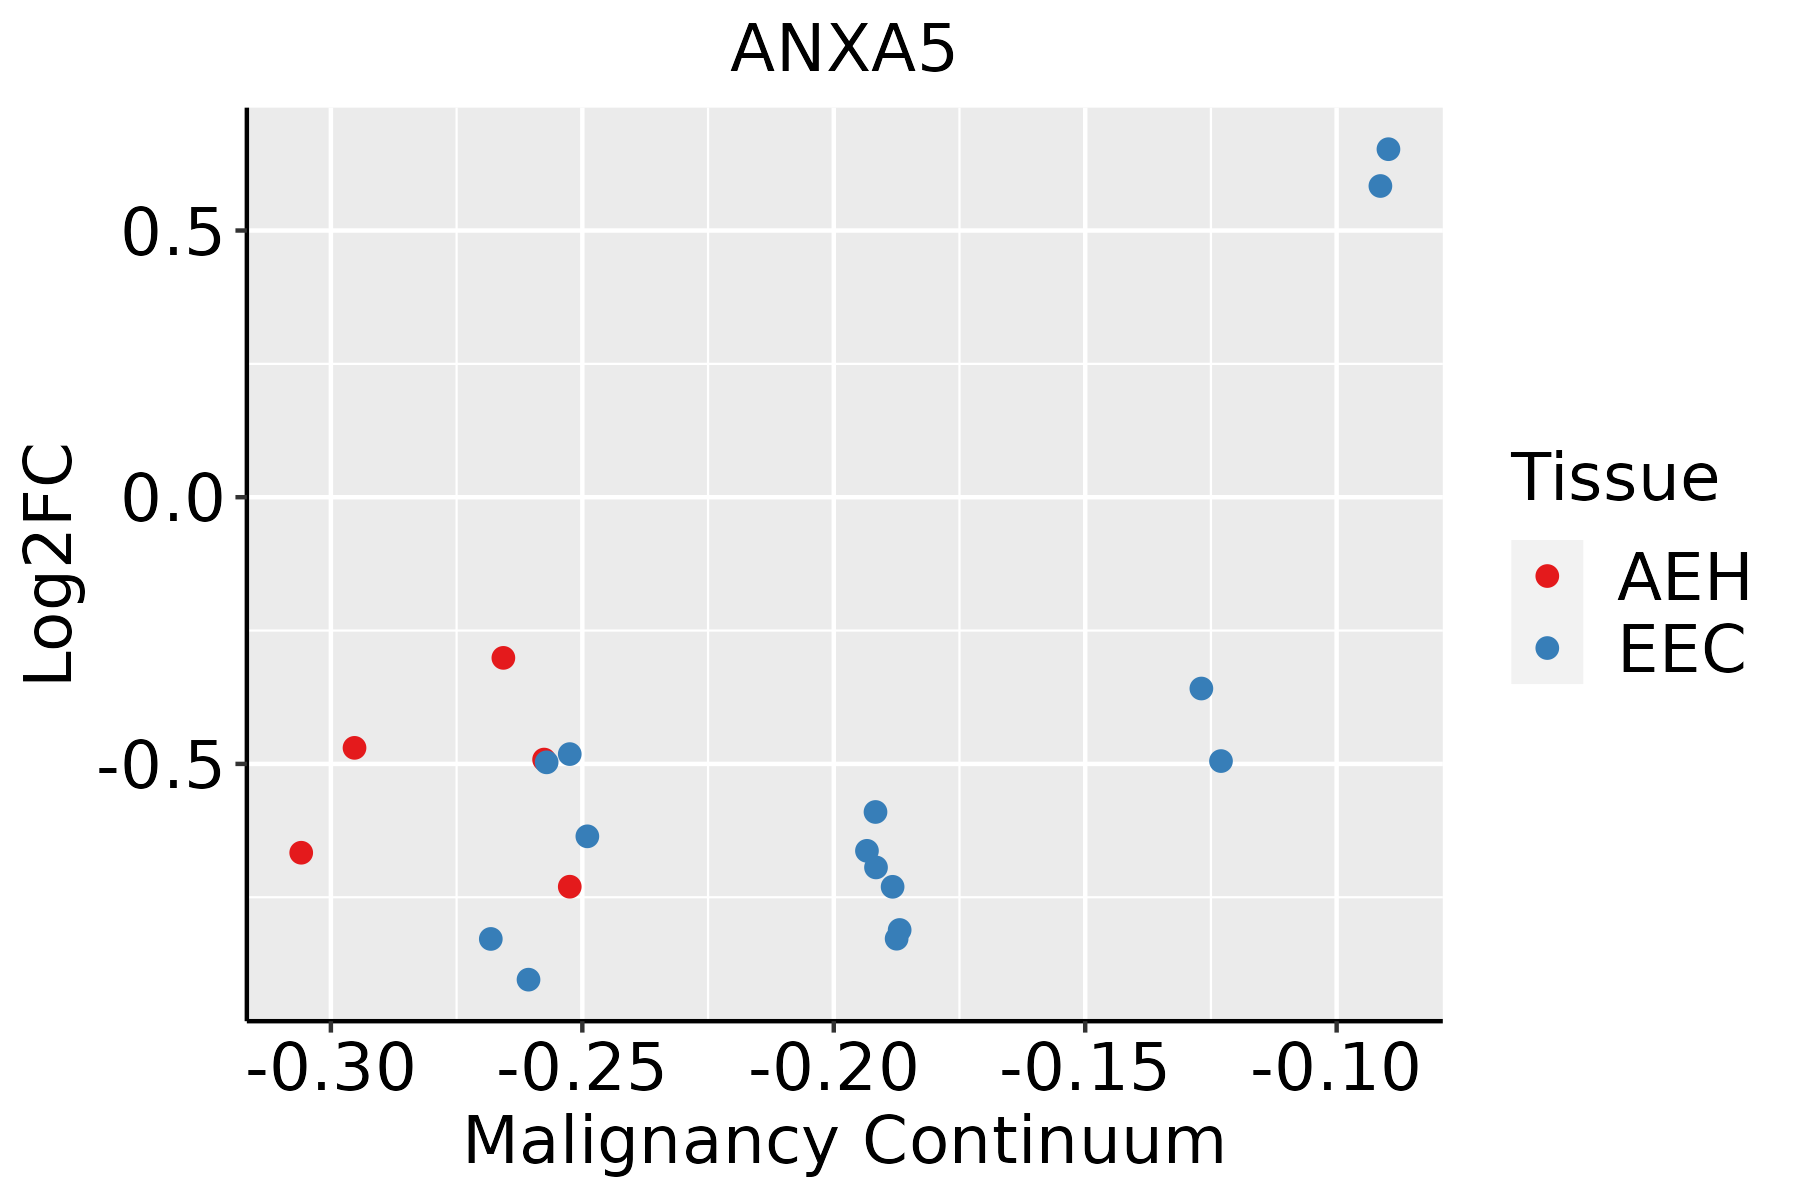 | AEH: Atypical endometrial hyperplasia |
| EEC: Endometrioid Cancer | ||
| Esophagus | 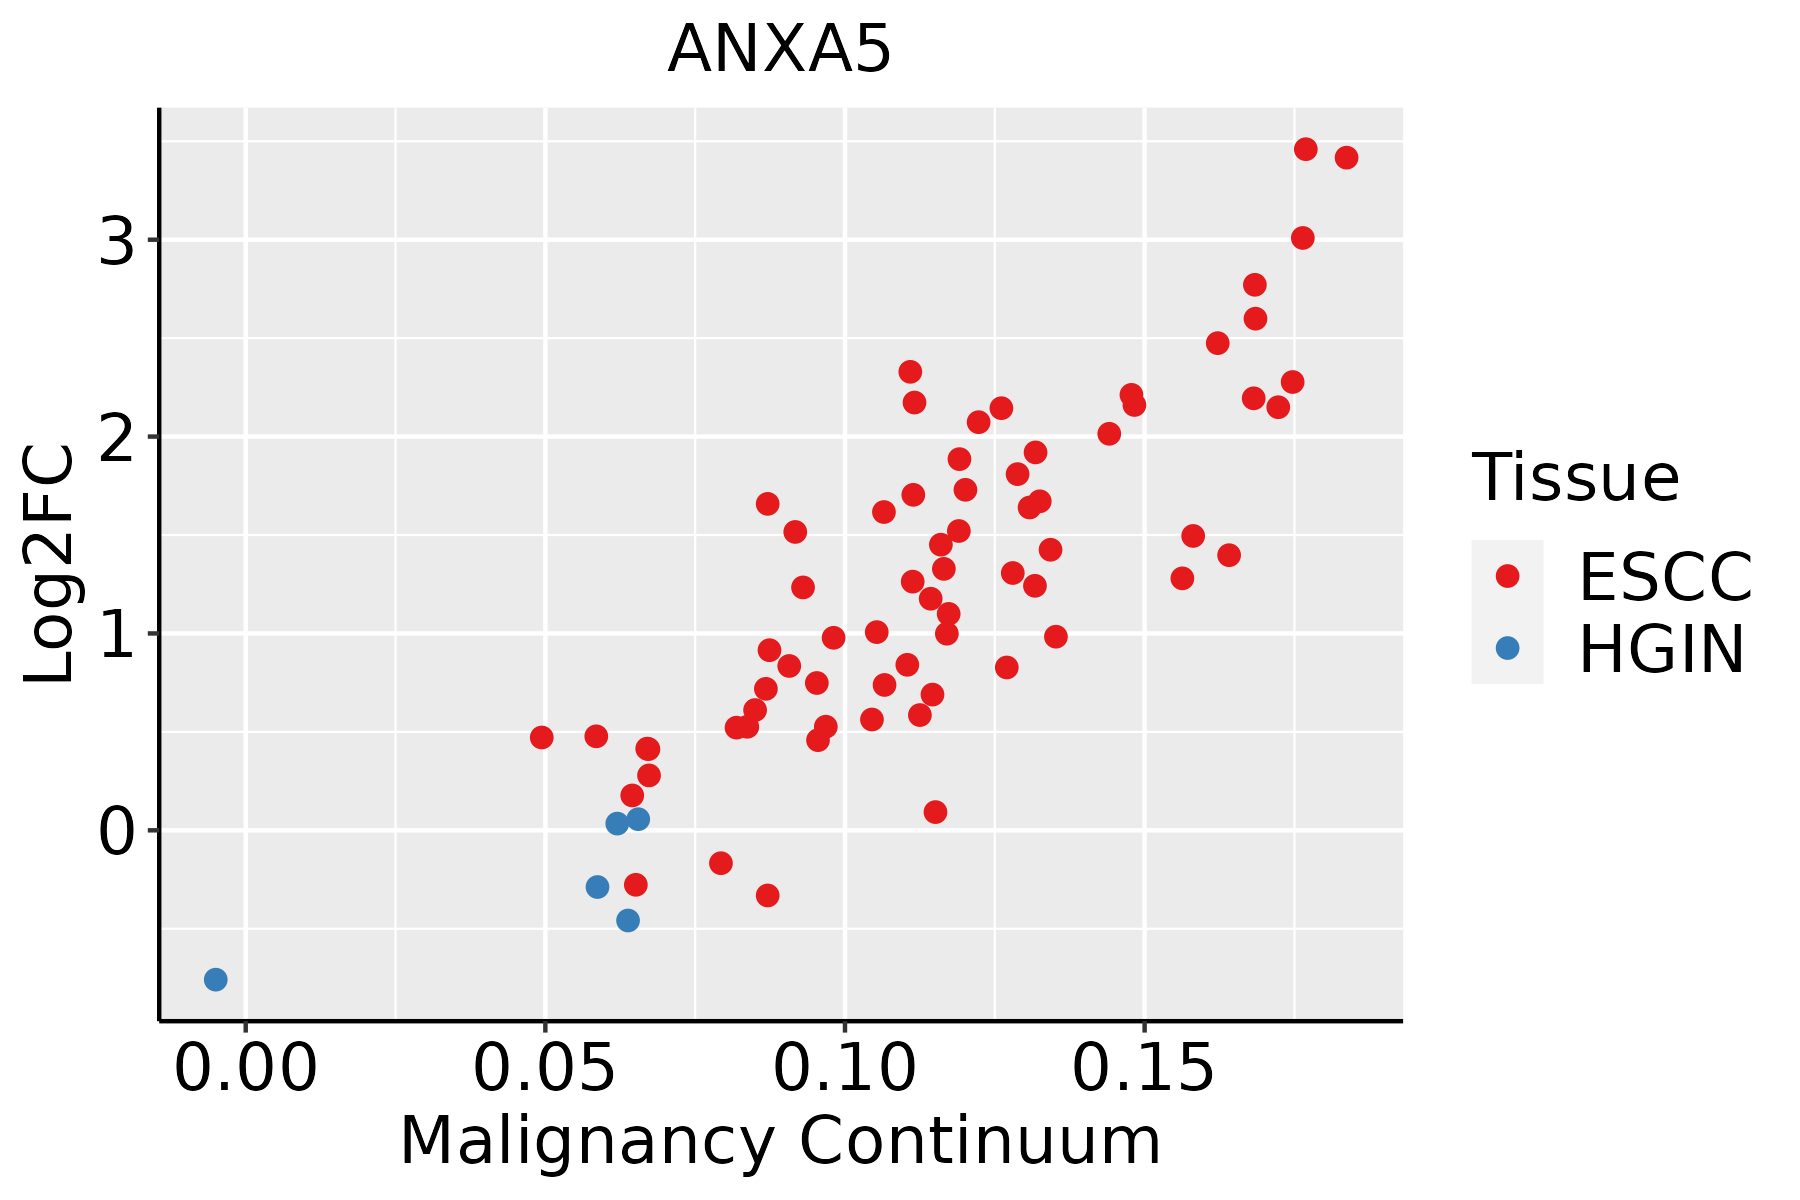 | ESCC: Esophageal squamous cell carcinoma |
| HGIN: High-grade intraepithelial neoplasias | ||
| LGIN: Low-grade intraepithelial neoplasias | ||
| GC | 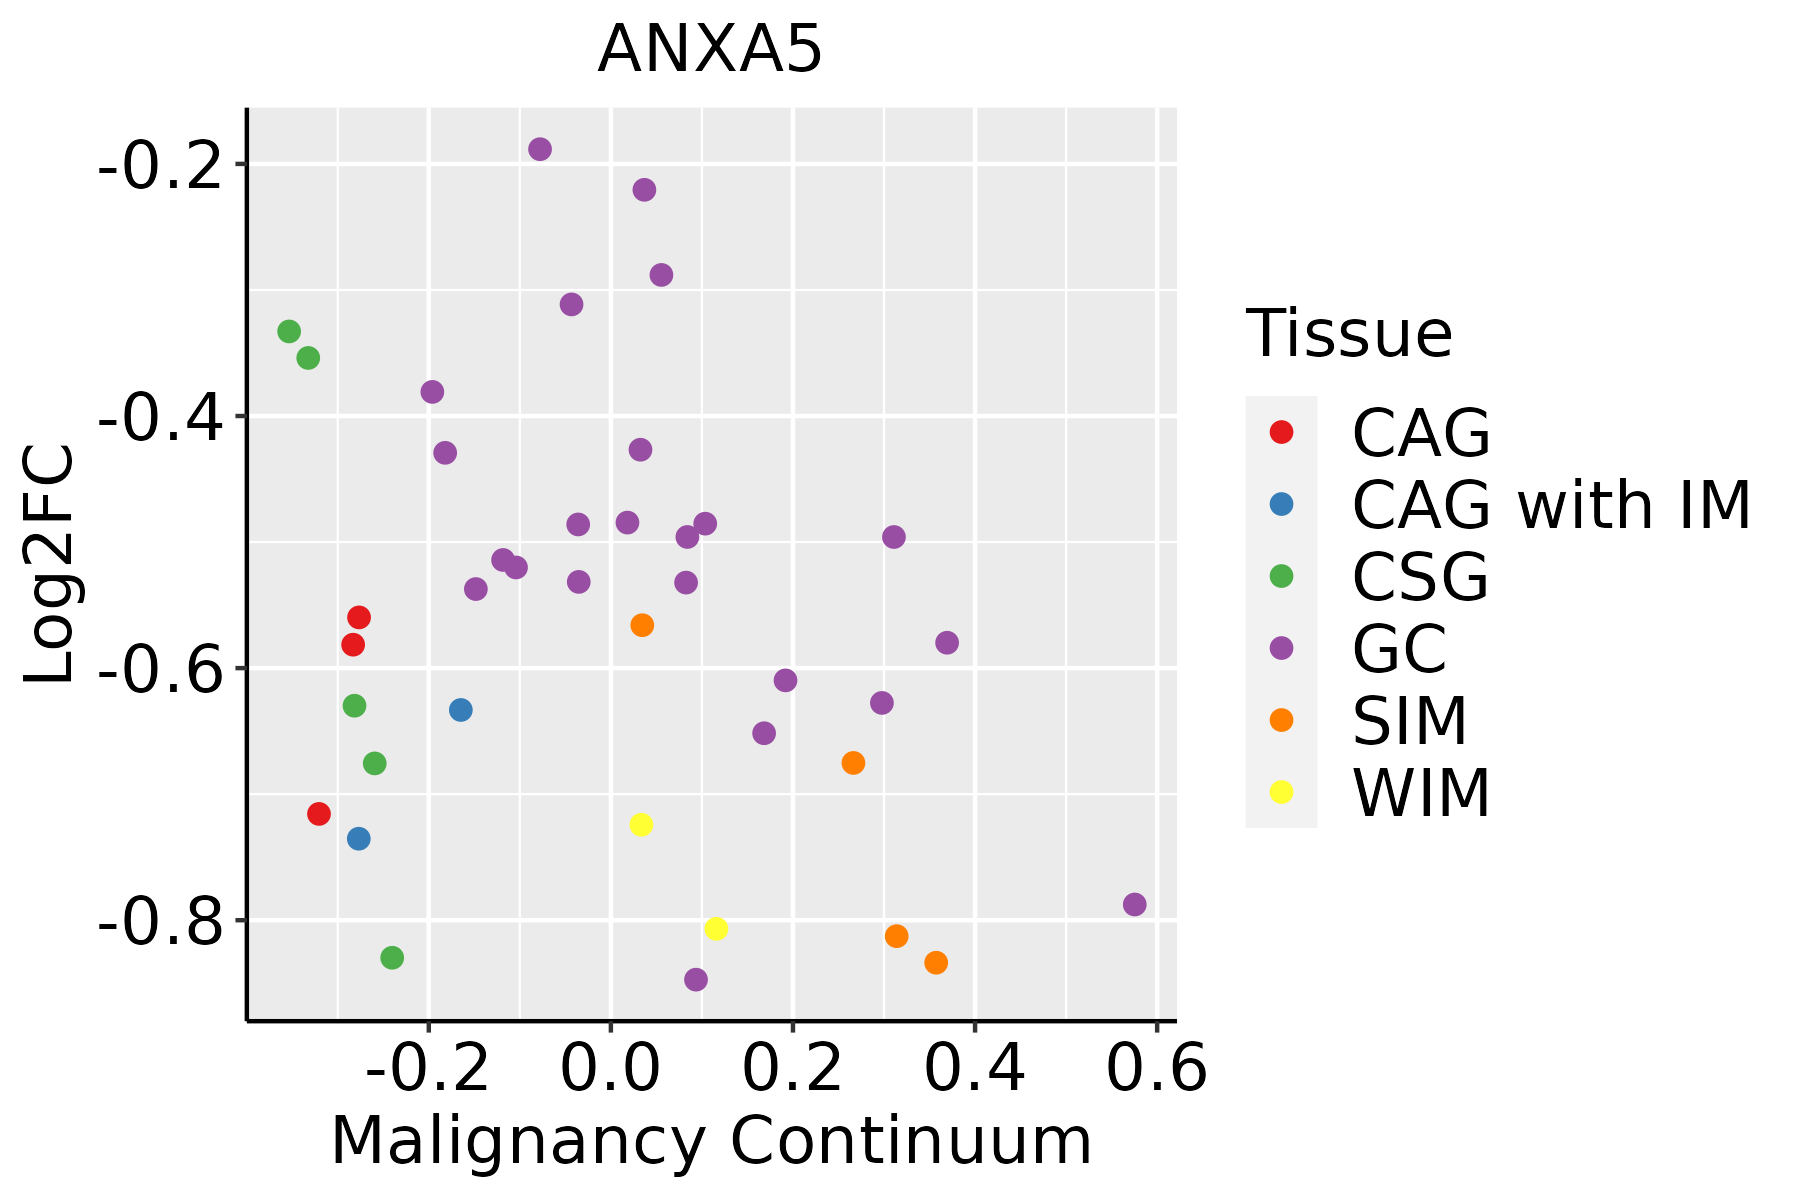 | CAG: Chronic atrophic gastritis |
| CAG with IM: Chronic atrophic gastritis with intestinal metaplasia | ||
| CSG: Chronic superficial gastritis | ||
| GC: Gastric cancer | ||
| SIM: Severe intestinal metaplasia | ||
| WIM: Wild intestinal metaplasia | ||
| Liver |  | HCC: Hepatocellular carcinoma |
| NAFLD: Non-alcoholic fatty liver disease | ||
| Lung | 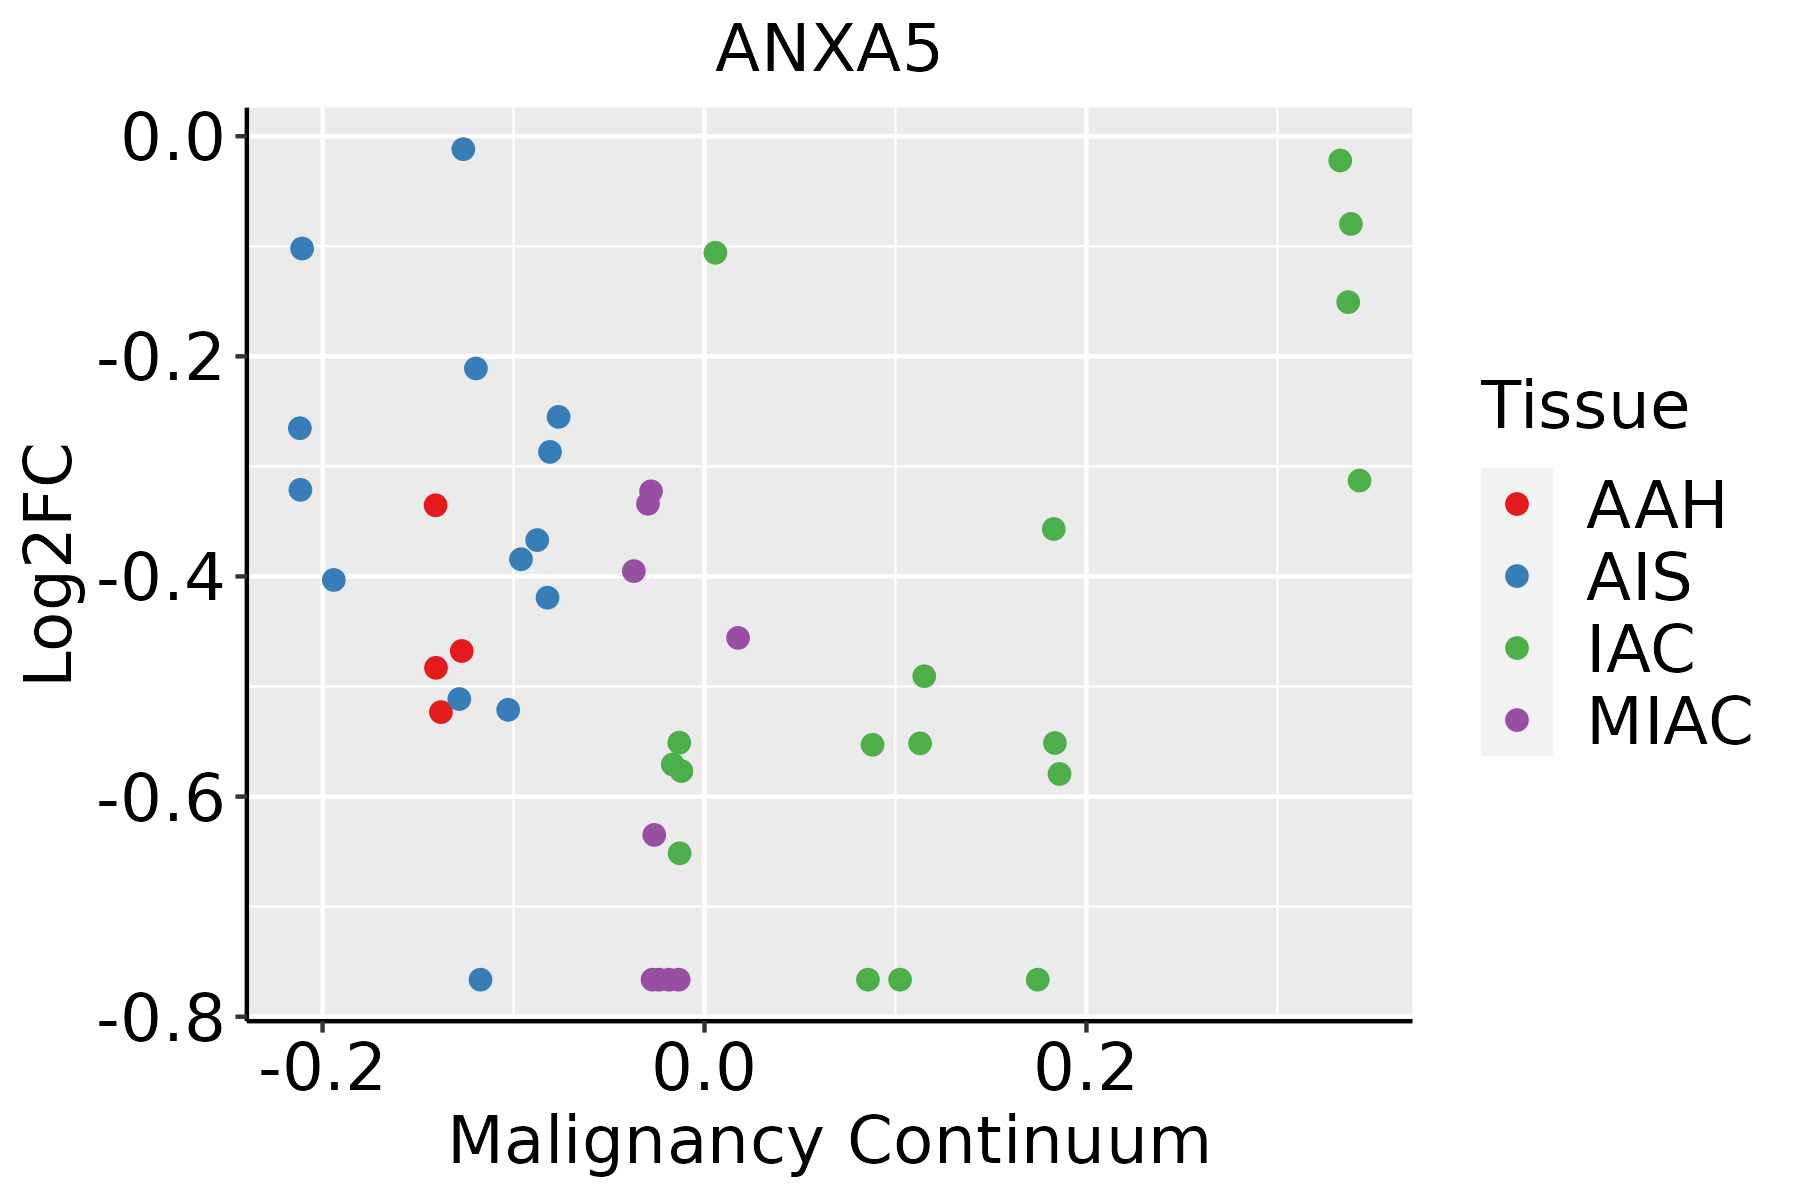 | AAH: Atypical adenomatous hyperplasia |
| AIS: Adenocarcinoma in situ | ||
| IAC: Invasive lung adenocarcinoma | ||
| MIA: Minimally invasive adenocarcinoma | ||
| Oral Cavity |  | EOLP: Erosive Oral lichen planus |
| LP: leukoplakia | ||
| NEOLP: Non-erosive oral lichen planus | ||
| OSCC: Oral squamous cell carcinoma | ||
| Prostate |  | BPH: Benign Prostatic Hyperplasia |
| Skin | 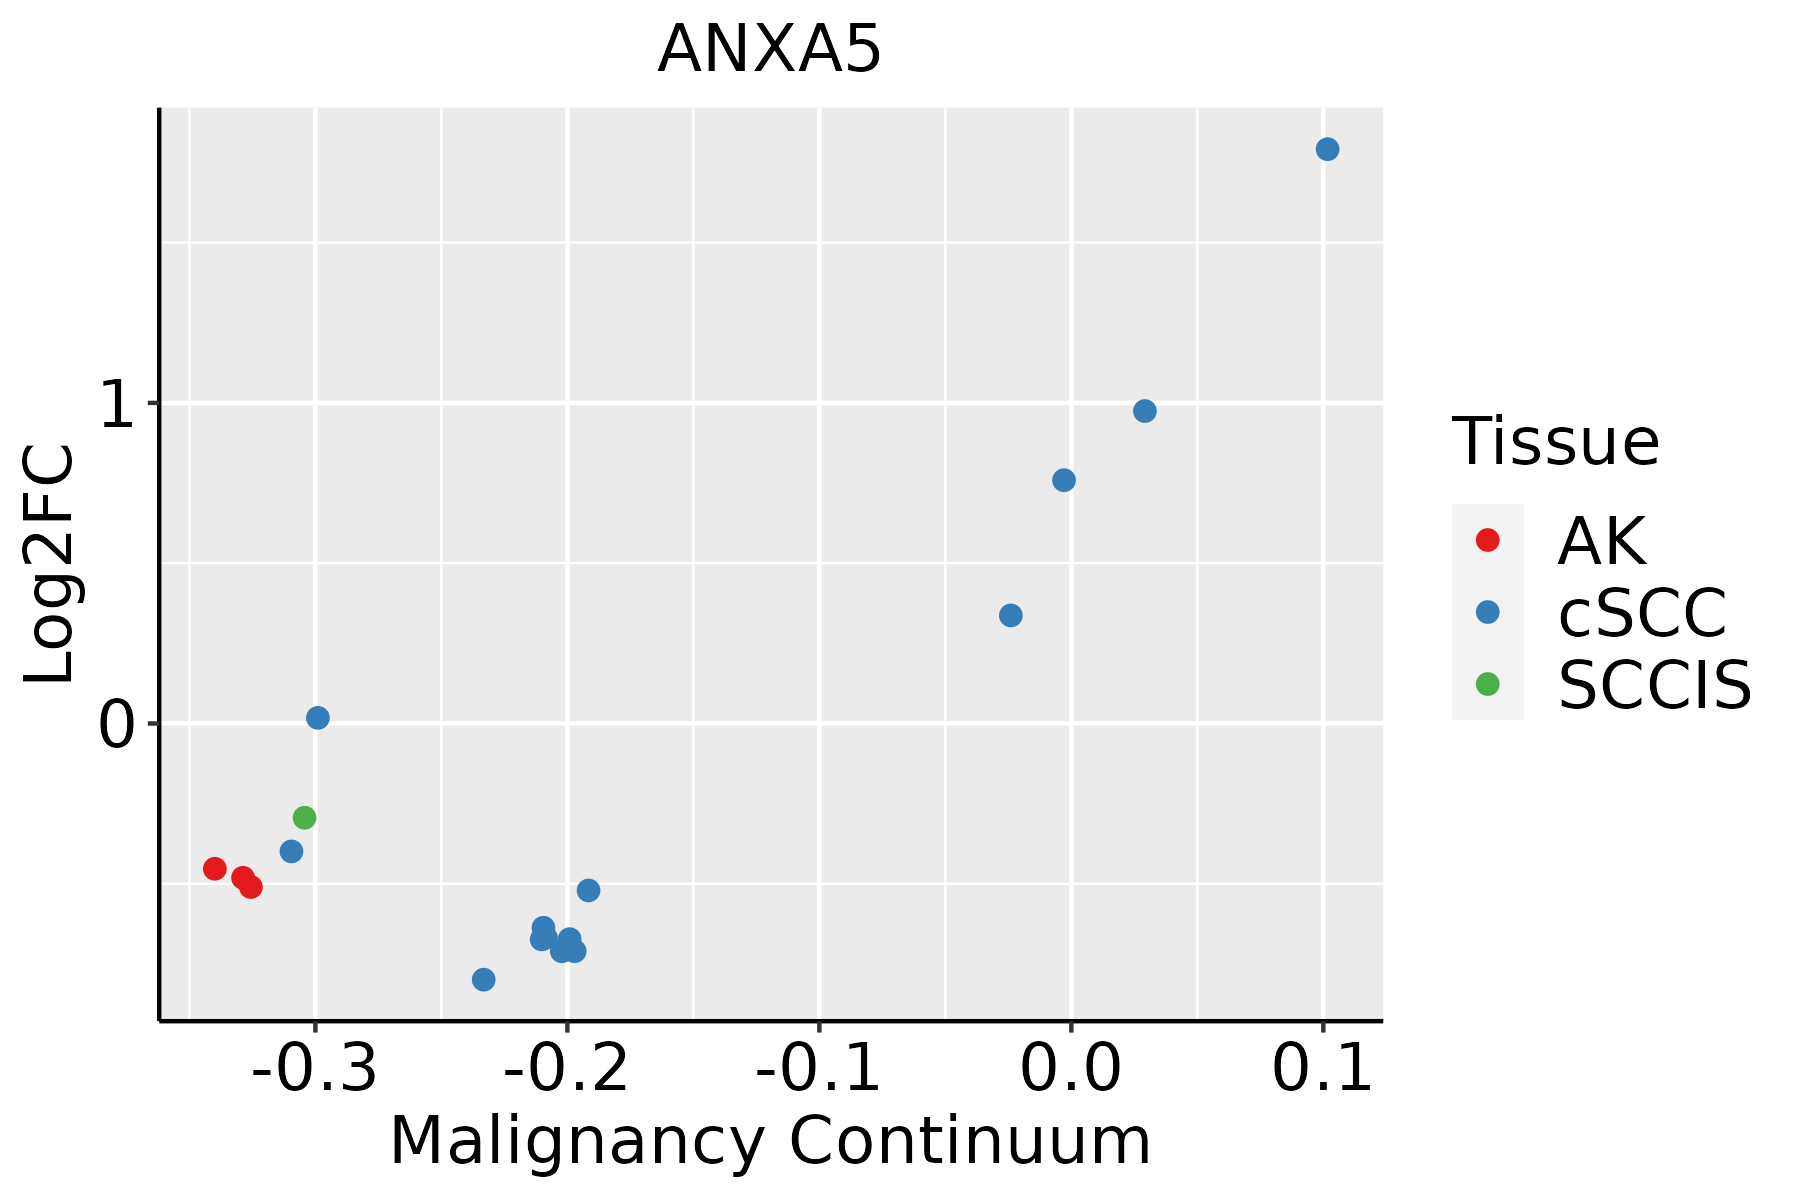 | AK: Actinic keratosis |
| cSCC: Cutaneous squamous cell carcinoma | ||
| SCCIS:squamous cell carcinoma in situ | ||
| Thyroid |  | ATC: Anaplastic thyroid cancer |
| HT: Hashimoto's thyroiditis | ||
| PTC: Papillary thyroid cancer |
| ∗log2FC in expression of this searched gene in stem-like cells from each diseased tissue sample relative to stem-like cells in normal samples in each tissue plotted against the malignancy continuum. Samples are colored based on if they are from different disease stage. |
Top |
Malignant transformation related pathway analysis |
| Find out the enriched GO biological processes and KEGG pathways involved in transition from healthy to precancer to cancer |
| Tissue | Disease Stage | Enriched GO biological Processes |
| Colorectum | AD |  |
| Colorectum | SER |  |
| Colorectum | MSS |  |
| Colorectum | MSI-H |  |
| Colorectum | FAP |  |
| ∗Top 15 enriched GO BP terms are showed in the bar plot of each disease state in each tissue. Each row represents a significant GO biological process which is colored according to the -log10(p.adjust). |
| Page: 1 2 3 4 5 6 7 8 9 |
| GO ID | Tissue | Disease Stage | Description | Gene Ratio | Bg Ratio | pvalue | p.adjust | Count |
| GO:00420609 | Breast | Precancer | wound healing | 48/1080 | 422/18723 | 5.48e-06 | 1.63e-04 | 48 |
| GO:00508789 | Breast | Precancer | regulation of body fluid levels | 40/1080 | 379/18723 | 1.68e-04 | 2.77e-03 | 40 |
| GO:00075995 | Breast | Precancer | hemostasis | 24/1080 | 222/18723 | 2.31e-03 | 2.15e-02 | 24 |
| GO:00075965 | Breast | Precancer | blood coagulation | 23/1080 | 217/18723 | 3.61e-03 | 2.98e-02 | 23 |
| GO:00508175 | Breast | Precancer | coagulation | 23/1080 | 222/18723 | 4.78e-03 | 3.64e-02 | 23 |
| GO:004206014 | Breast | IDC | wound healing | 55/1434 | 422/18723 | 7.27e-05 | 1.45e-03 | 55 |
| GO:005087813 | Breast | IDC | regulation of body fluid levels | 50/1434 | 379/18723 | 1.12e-04 | 2.10e-03 | 50 |
| GO:005087823 | Breast | DCIS | regulation of body fluid levels | 50/1390 | 379/18723 | 5.17e-05 | 1.06e-03 | 50 |
| GO:004206024 | Breast | DCIS | wound healing | 54/1390 | 422/18723 | 6.09e-05 | 1.22e-03 | 54 |
| GO:004206010 | Cervix | CC | wound healing | 109/2311 | 422/18723 | 1.84e-14 | 1.57e-11 | 109 |
| GO:005087810 | Cervix | CC | regulation of body fluid levels | 78/2311 | 379/18723 | 3.20e-06 | 8.77e-05 | 78 |
| GO:00508176 | Cervix | CC | coagulation | 45/2311 | 222/18723 | 5.08e-04 | 4.94e-03 | 45 |
| GO:00075966 | Cervix | CC | blood coagulation | 44/2311 | 217/18723 | 5.78e-04 | 5.52e-03 | 44 |
| GO:00075996 | Cervix | CC | hemostasis | 44/2311 | 222/18723 | 9.47e-04 | 7.95e-03 | 44 |
| GO:004206025 | Cervix | N_HPV | wound healing | 28/534 | 422/18723 | 3.37e-05 | 8.58e-04 | 28 |
| GO:005087824 | Cervix | N_HPV | regulation of body fluid levels | 22/534 | 379/18723 | 1.37e-03 | 1.49e-02 | 22 |
| GO:005081721 | Cervix | N_HPV | coagulation | 14/534 | 222/18723 | 4.76e-03 | 3.52e-02 | 14 |
| GO:004206016 | Endometrium | AEH | wound healing | 91/2100 | 422/18723 | 4.85e-10 | 4.61e-08 | 91 |
| GO:00075967 | Endometrium | AEH | blood coagulation | 43/2100 | 217/18723 | 1.42e-04 | 1.89e-03 | 43 |
| GO:00075997 | Endometrium | AEH | hemostasis | 43/2100 | 222/18723 | 2.39e-04 | 2.86e-03 | 43 |
| Page: 1 2 3 4 5 6 |
| Pathway ID | Tissue | Disease Stage | Description | Gene Ratio | Bg Ratio | pvalue | p.adjust | qvalue | Count |
| Page: 1 |
Top |
Cell-cell communication analysis |
| Identification of potential cell-cell interactions between two cell types and their ligand-receptor pairs for different disease states |
| Ligand | Receptor | LRpair | Pathway | Tissue | Disease Stage |
| Page: 1 |
Top |
Single-cell gene regulatory network inference analysis |
| Find out the significant the regulons (TFs) and the target genes of each regulon across cell types for different disease states |
| TF | Cell Type | Tissue | Disease Stage | Target Gene | RSS | Regulon Activity |
| ∗The dot plots of a searched regulon are shown for all cell subpopulations in each disease state of each tissue based on the regulon specific score inferred using pySCENIC and by calculating the average expression. |
| Page: 1 |
Top |
Somatic mutation of malignant transformation related genes |
| Annotation of somatic variants for genes involved in malignant transformation |
| Hugo Symbol | Variant Class | Variant Classification | dbSNP RS | HGVSc | HGVSp | HGVSp Short | SWISSPROT | BIOTYPE | SIFT | PolyPhen | Tumor Sample Barcode | Tissue | Histology | Sex | Age | Stage | Therapy Types | Drugs | Outcome |
| ANXA5 | insertion | Frame_Shift_Ins | novel | c.564_565insG | p.Thr189AspfsTer3 | p.T189Dfs*3 | P08758 | protein_coding | TCGA-D8-A1XK-01 | Breast | breast invasive carcinoma | Female | <65 | I/II | Chemotherapy | doxorubicine+cyclophosphamide | SD | ||
| ANXA5 | SNV | Missense_Mutation | rs780076315 | c.451N>T | p.Arg151Trp | p.R151W | P08758 | protein_coding | deleterious(0) | probably_damaging(0.994) | TCGA-AA-3492-01 | Colorectum | colon adenocarcinoma | Female | >=65 | I/II | Unknown | Unknown | SD |
| ANXA5 | SNV | Missense_Mutation | c.149N>A | p.Arg50His | p.R50H | P08758 | protein_coding | deleterious(0) | probably_damaging(1) | TCGA-AA-3864-01 | Colorectum | colon adenocarcinoma | Male | >=65 | I/II | Unknown | Unknown | SD | |
| ANXA5 | SNV | Missense_Mutation | novel | c.278N>T | p.Ala93Val | p.A93V | P08758 | protein_coding | tolerated(0.22) | benign(0.298) | TCGA-AA-3949-01 | Colorectum | colon adenocarcinoma | Female | >=65 | III/IV | Unknown | Unknown | SD |
| ANXA5 | SNV | Missense_Mutation | rs137877895 | c.605N>A | p.Ser202Asn | p.S202N | P08758 | protein_coding | tolerated(0.22) | probably_damaging(0.939) | TCGA-DM-A285-01 | Colorectum | colon adenocarcinoma | Female | >=65 | III/IV | Unknown | Unknown | SD |
| ANXA5 | SNV | Missense_Mutation | novel | c.812N>T | p.Arg271Ile | p.R271I | P08758 | protein_coding | deleterious(0) | probably_damaging(0.992) | TCGA-A5-A1OF-01 | Endometrium | uterine corpus endometrioid carcinoma | Female | <65 | I/II | Unknown | Unknown | SD |
| ANXA5 | SNV | Missense_Mutation | novel | c.20N>T | p.Gly7Val | p.G7V | P08758 | protein_coding | deleterious(0) | probably_damaging(1) | TCGA-A5-A2K5-01 | Endometrium | uterine corpus endometrioid carcinoma | Female | >=65 | I/II | Unknown | Unknown | SD |
| ANXA5 | SNV | Missense_Mutation | novel | c.870N>T | p.Lys290Asn | p.K290N | P08758 | protein_coding | tolerated(0.14) | probably_damaging(0.964) | TCGA-AJ-A3EK-01 | Endometrium | uterine corpus endometrioid carcinoma | Female | <65 | I/II | Chemotherapy | carboplatin | CR |
| ANXA5 | SNV | Missense_Mutation | novel | c.223N>A | p.Gly75Arg | p.G75R | P08758 | protein_coding | deleterious(0) | probably_damaging(1) | TCGA-AJ-A3EK-01 | Endometrium | uterine corpus endometrioid carcinoma | Female | <65 | I/II | Chemotherapy | carboplatin | CR |
| ANXA5 | SNV | Missense_Mutation | novel | c.85N>G | p.Lys29Glu | p.K29E | P08758 | protein_coding | deleterious(0.01) | probably_damaging(0.998) | TCGA-AJ-A3EL-01 | Endometrium | uterine corpus endometrioid carcinoma | Female | <65 | I/II | Unknown | Unknown | SD |
| Page: 1 2 3 4 |
Top |
Related drugs of malignant transformation related genes |
| Identification of chemicals and drugs interact with genes involved in malignant transfromation |
| (DGIdb 4.0) |
| Entrez ID | Symbol | Category | Interaction Types | Drug Claim Name | Drug Name | PMIDs |
| 308 | ANXA5 | KINASE, EXTERNAL SIDE OF PLASMA MEMBRANE, TRANSPORTER | Diannexin | |||
| 308 | ANXA5 | KINASE, EXTERNAL SIDE OF PLASMA MEMBRANE, TRANSPORTER | BETA-LAPACHONE | LAPACHONE | 11474117 | |
| 308 | ANXA5 | KINASE, EXTERNAL SIDE OF PLASMA MEMBRANE, TRANSPORTER | DNR | 11986942 |
| Page: 1 |

Copyright 2023-Present -The University of Texas Health Science Center at Houston |