
|
|||||
|
 | |
| |
| |
| |
| |
| |
|
Gene: ANKRD27 |
Gene summary for ANKRD27 |
| Gene information | Species | Human | Gene symbol | ANKRD27 | Gene ID | 84079 |
| Gene name | ankyrin repeat domain 27 | |
| Gene Alias | PP12899 | |
| Cytomap | 19q13.11 | |
| Gene Type | protein-coding | GO ID | GO:0000902 | UniProtAcc | Q96NW4 |
Top |
Malignant transformation analysis |
| Identification of the aberrant gene expression in precancerous and cancerous lesions by comparing the gene expression of stem-like cells in diseased tissues with normal stem cells |
| Entrez ID | Symbol | Replicates | Species | Organ | Tissue | Adj P-value | Log2FC | Malignancy |
| 84079 | ANKRD27 | P23T-E | Human | Esophagus | ESCC | 8.23e-14 | 3.39e-01 | 0.108 |
| 84079 | ANKRD27 | P24T-E | Human | Esophagus | ESCC | 9.83e-06 | 1.68e-01 | 0.1287 |
| 84079 | ANKRD27 | P26T-E | Human | Esophagus | ESCC | 4.77e-12 | 1.62e-01 | 0.1276 |
| 84079 | ANKRD27 | P27T-E | Human | Esophagus | ESCC | 2.16e-11 | 2.18e-01 | 0.1055 |
| 84079 | ANKRD27 | P28T-E | Human | Esophagus | ESCC | 2.78e-15 | 2.60e-01 | 0.1149 |
| 84079 | ANKRD27 | P30T-E | Human | Esophagus | ESCC | 9.95e-14 | 3.72e-01 | 0.137 |
| 84079 | ANKRD27 | P31T-E | Human | Esophagus | ESCC | 1.45e-16 | 1.85e-01 | 0.1251 |
| 84079 | ANKRD27 | P32T-E | Human | Esophagus | ESCC | 2.26e-18 | 2.11e-01 | 0.1666 |
| 84079 | ANKRD27 | P36T-E | Human | Esophagus | ESCC | 9.89e-07 | 2.31e-01 | 0.1187 |
| 84079 | ANKRD27 | P37T-E | Human | Esophagus | ESCC | 5.15e-05 | 1.85e-01 | 0.1371 |
| 84079 | ANKRD27 | P38T-E | Human | Esophagus | ESCC | 1.09e-06 | 3.55e-01 | 0.127 |
| 84079 | ANKRD27 | P39T-E | Human | Esophagus | ESCC | 3.59e-11 | 1.04e-01 | 0.0894 |
| 84079 | ANKRD27 | P40T-E | Human | Esophagus | ESCC | 1.95e-02 | 1.40e-01 | 0.109 |
| 84079 | ANKRD27 | P42T-E | Human | Esophagus | ESCC | 2.95e-14 | 1.99e-01 | 0.1175 |
| 84079 | ANKRD27 | P44T-E | Human | Esophagus | ESCC | 7.88e-05 | 1.56e-01 | 0.1096 |
| 84079 | ANKRD27 | P47T-E | Human | Esophagus | ESCC | 5.38e-07 | 1.18e-01 | 0.1067 |
| 84079 | ANKRD27 | P48T-E | Human | Esophagus | ESCC | 1.24e-11 | 1.59e-01 | 0.0959 |
| 84079 | ANKRD27 | P49T-E | Human | Esophagus | ESCC | 1.92e-09 | 6.78e-01 | 0.1768 |
| 84079 | ANKRD27 | P52T-E | Human | Esophagus | ESCC | 2.63e-15 | 3.25e-01 | 0.1555 |
| 84079 | ANKRD27 | P54T-E | Human | Esophagus | ESCC | 1.48e-17 | 2.80e-01 | 0.0975 |
| Page: 1 2 3 |
| Tissue | Expression Dynamics | Abbreviation |
| Esophagus | 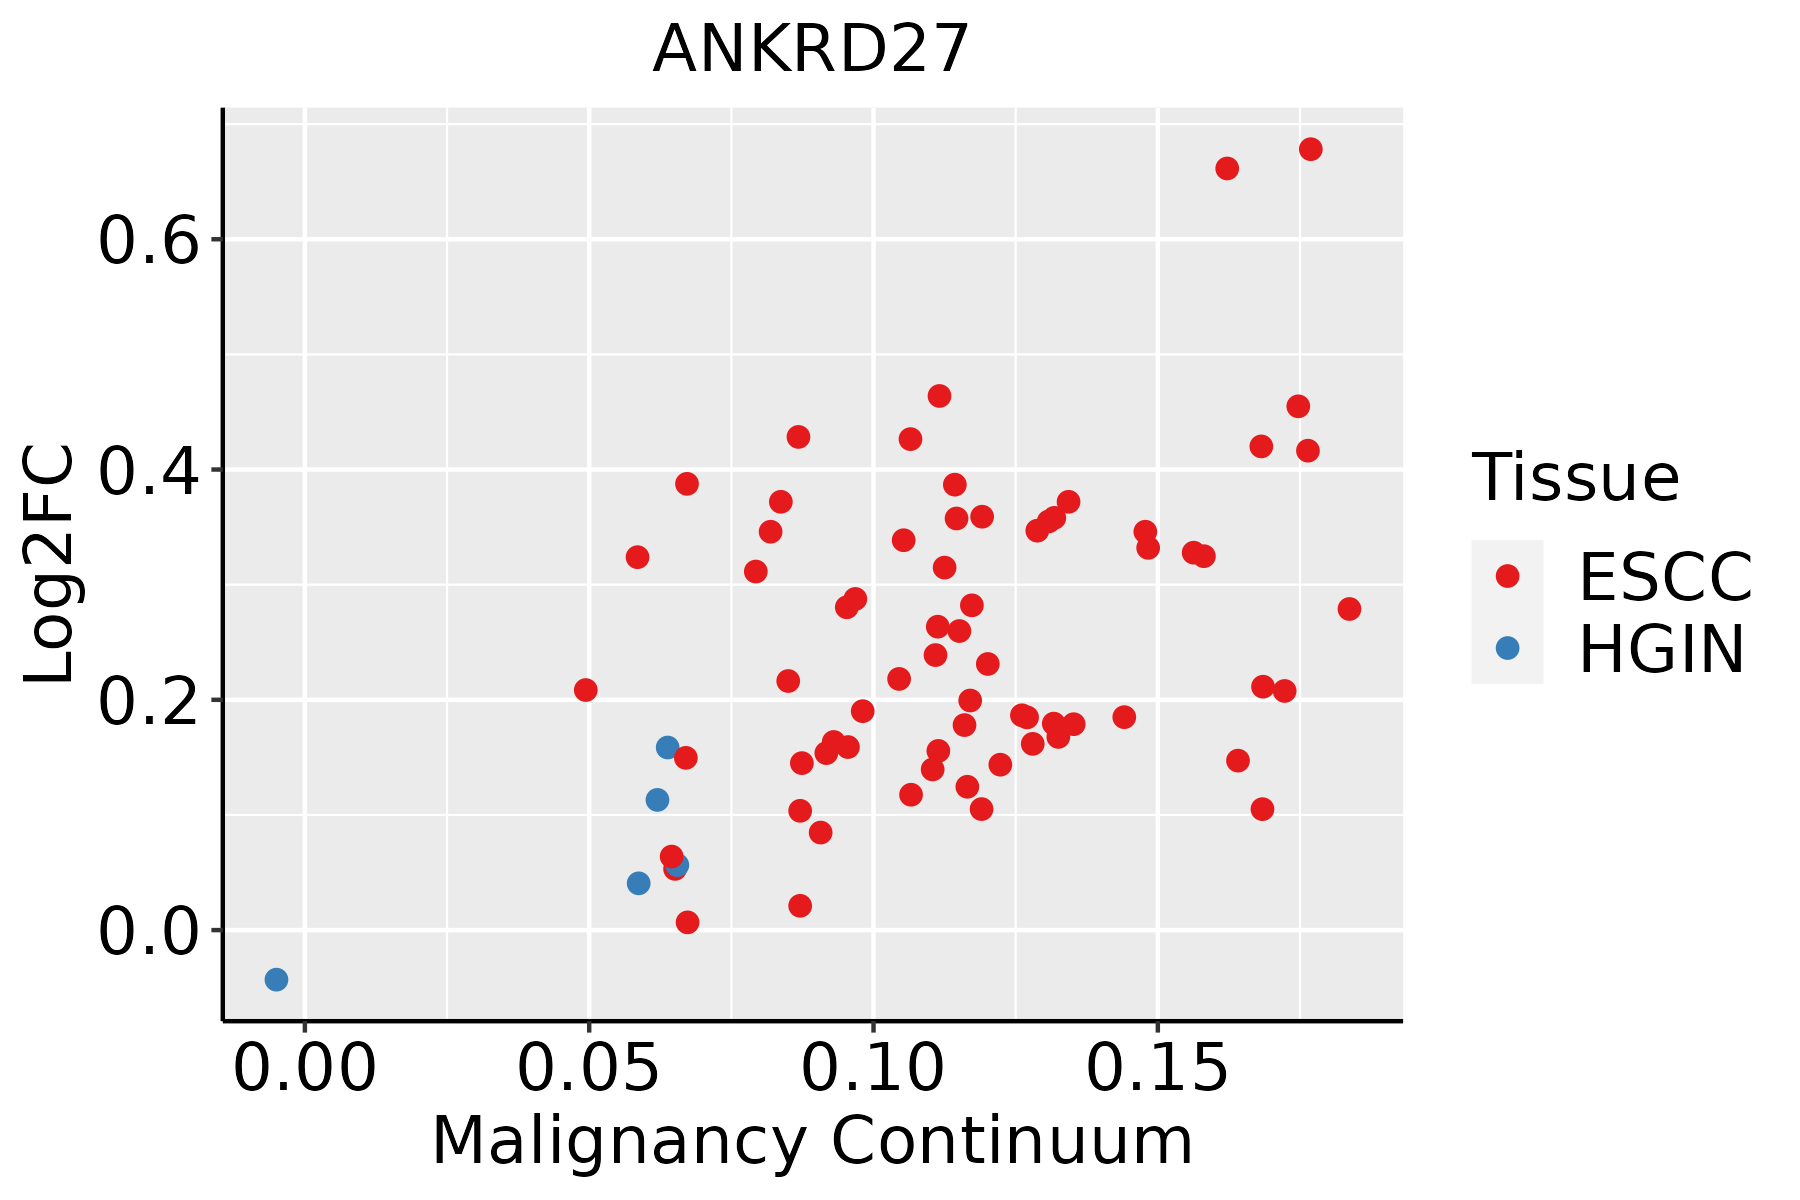 | ESCC: Esophageal squamous cell carcinoma |
| HGIN: High-grade intraepithelial neoplasias | ||
| LGIN: Low-grade intraepithelial neoplasias |
| ∗log2FC in expression of this searched gene in stem-like cells from each diseased tissue sample relative to stem-like cells in normal samples in each tissue plotted against the malignancy continuum. Samples are colored based on if they are from different disease stage. |
Top |
Malignant transformation related pathway analysis |
| Find out the enriched GO biological processes and KEGG pathways involved in transition from healthy to precancer to cancer |
| Tissue | Disease Stage | Enriched GO biological Processes |
| Colorectum | AD |  |
| Colorectum | SER |  |
| Colorectum | MSS |  |
| Colorectum | MSI-H |  |
| Colorectum | FAP |  |
| ∗Top 15 enriched GO BP terms are showed in the bar plot of each disease state in each tissue. Each row represents a significant GO biological process which is colored according to the -log10(p.adjust). |
| Page: 1 2 3 4 5 6 7 8 9 |
| GO ID | Tissue | Disease Stage | Description | Gene Ratio | Bg Ratio | pvalue | p.adjust | Count |
| GO:001605014 | Esophagus | ESCC | vesicle organization | 211/8552 | 300/18723 | 2.85e-18 | 2.87e-16 | 211 |
| GO:001619715 | Esophagus | ESCC | endosomal transport | 168/8552 | 230/18723 | 2.28e-17 | 1.93e-15 | 168 |
| GO:0043254111 | Esophagus | ESCC | regulation of protein-containing complex assembly | 278/8552 | 428/18723 | 3.81e-16 | 2.77e-14 | 278 |
| GO:001648210 | Esophagus | ESCC | cytosolic transport | 124/8552 | 168/18723 | 9.69e-14 | 4.69e-12 | 124 |
| GO:009887615 | Esophagus | ESCC | vesicle-mediated transport to the plasma membrane | 99/8552 | 136/18723 | 1.13e-10 | 3.39e-09 | 99 |
| GO:0010639110 | Esophagus | ESCC | negative regulation of organelle organization | 215/8552 | 348/18723 | 8.20e-10 | 2.01e-08 | 215 |
| GO:00989278 | Esophagus | ESCC | vesicle-mediated transport between endosomal compartments | 36/8552 | 43/18723 | 2.90e-07 | 4.20e-06 | 36 |
| GO:00482844 | Esophagus | ESCC | organelle fusion | 94/8552 | 141/18723 | 3.72e-07 | 5.16e-06 | 94 |
| GO:00450226 | Esophagus | ESCC | early endosome to late endosome transport | 33/8552 | 40/18723 | 1.80e-06 | 2.11e-05 | 33 |
| GO:002260420 | Esophagus | ESCC | regulation of cell morphogenesis | 180/8552 | 309/18723 | 5.19e-06 | 5.45e-05 | 180 |
| GO:00901743 | Esophagus | ESCC | organelle membrane fusion | 73/8552 | 110/18723 | 9.29e-06 | 8.88e-05 | 73 |
| GO:00330593 | Esophagus | ESCC | cellular pigmentation | 40/8552 | 53/18723 | 9.67e-06 | 9.21e-05 | 40 |
| GO:003134616 | Esophagus | ESCC | positive regulation of cell projection organization | 201/8552 | 353/18723 | 1.19e-05 | 1.11e-04 | 201 |
| GO:001072010 | Esophagus | ESCC | positive regulation of cell development | 172/8552 | 298/18723 | 1.74e-05 | 1.55e-04 | 172 |
| GO:00069063 | Esophagus | ESCC | vesicle fusion | 70/8552 | 106/18723 | 1.82e-05 | 1.60e-04 | 70 |
| GO:00324565 | Esophagus | ESCC | endocytic recycling | 51/8552 | 73/18723 | 2.47e-05 | 2.10e-04 | 51 |
| GO:005076710 | Esophagus | ESCC | regulation of neurogenesis | 203/8552 | 364/18723 | 6.10e-05 | 4.68e-04 | 203 |
| GO:00507697 | Esophagus | ESCC | positive regulation of neurogenesis | 131/8552 | 225/18723 | 9.71e-05 | 6.90e-04 | 131 |
| GO:00610254 | Esophagus | ESCC | membrane fusion | 98/8552 | 163/18723 | 1.39e-04 | 9.41e-04 | 98 |
| GO:0031333110 | Esophagus | ESCC | negative regulation of protein-containing complex assembly | 86/8552 | 141/18723 | 1.74e-04 | 1.14e-03 | 86 |
| Page: 1 2 |
| Pathway ID | Tissue | Disease Stage | Description | Gene Ratio | Bg Ratio | pvalue | p.adjust | qvalue | Count |
| Page: 1 |
Top |
Cell-cell communication analysis |
| Identification of potential cell-cell interactions between two cell types and their ligand-receptor pairs for different disease states |
| Ligand | Receptor | LRpair | Pathway | Tissue | Disease Stage |
| Page: 1 |
Top |
Single-cell gene regulatory network inference analysis |
| Find out the significant the regulons (TFs) and the target genes of each regulon across cell types for different disease states |
| TF | Cell Type | Tissue | Disease Stage | Target Gene | RSS | Regulon Activity |
| ∗The dot plots of a searched regulon are shown for all cell subpopulations in each disease state of each tissue based on the regulon specific score inferred using pySCENIC and by calculating the average expression. |
| Page: 1 |
Top |
Somatic mutation of malignant transformation related genes |
| Annotation of somatic variants for genes involved in malignant transformation |
| Hugo Symbol | Variant Class | Variant Classification | dbSNP RS | HGVSc | HGVSp | HGVSp Short | SWISSPROT | BIOTYPE | SIFT | PolyPhen | Tumor Sample Barcode | Tissue | Histology | Sex | Age | Stage | Therapy Types | Drugs | Outcome |
| ANKRD27 | SNV | Missense_Mutation | novel | c.1898N>T | p.Gln633Leu | p.Q633L | Q96NW4 | protein_coding | tolerated(0.52) | benign(0) | TCGA-3C-AALI-01 | Breast | breast invasive carcinoma | Female | <65 | I/II | Unspecific | Poly E | Complete Response |
| ANKRD27 | SNV | Missense_Mutation | novel | c.615N>T | p.Met205Ile | p.M205I | Q96NW4 | protein_coding | tolerated(0.05) | probably_damaging(0.987) | TCGA-AN-A046-01 | Breast | breast invasive carcinoma | Female | >=65 | I/II | Unknown | Unknown | SD |
| ANKRD27 | SNV | Missense_Mutation | rs766519033 | c.482N>A | p.Arg161Gln | p.R161Q | Q96NW4 | protein_coding | tolerated(0.22) | benign(0.033) | TCGA-AN-A046-01 | Breast | breast invasive carcinoma | Female | >=65 | I/II | Unknown | Unknown | SD |
| ANKRD27 | SNV | Missense_Mutation | novel | c.2306A>G | p.Asn769Ser | p.N769S | Q96NW4 | protein_coding | tolerated(0.61) | benign(0.003) | TCGA-B6-A0I1-01 | Breast | breast invasive carcinoma | Female | >=65 | I/II | Unknown | Unknown | PD |
| ANKRD27 | SNV | Missense_Mutation | c.2722G>A | p.Glu908Lys | p.E908K | Q96NW4 | protein_coding | deleterious(0.04) | benign(0.197) | TCGA-GM-A2D9-01 | Breast | breast invasive carcinoma | Female | >=65 | I/II | Hormone Therapy | arimidex | SD | |
| ANKRD27 | insertion | Frame_Shift_Ins | novel | c.375_376insATGGGAGGATCTCTTGAGGCTGGGAGTTCAAGACCAGCCTGGGTAA | p.Pro126MetfsTer29 | p.P126Mfs*29 | Q96NW4 | protein_coding | TCGA-A2-A0D1-01 | Breast | breast invasive carcinoma | Female | >=65 | I/II | Chemotherapy | taxotere | SD | ||
| ANKRD27 | insertion | Frame_Shift_Ins | novel | c.512_513insA | p.Arg172ProfsTer48 | p.R172Pfs*48 | Q96NW4 | protein_coding | TCGA-A2-A0EM-01 | Breast | breast invasive carcinoma | Female | >=65 | I/II | Hormone Therapy | tamoxiphen | SD | ||
| ANKRD27 | insertion | Frame_Shift_Ins | novel | c.511_512insAAGTGGTAAAGTCATGGGGAAGTATAACAATGAGTATTAT | p.Leu171GlnfsTer62 | p.L171Qfs*62 | Q96NW4 | protein_coding | TCGA-A2-A0EM-01 | Breast | breast invasive carcinoma | Female | >=65 | I/II | Hormone Therapy | tamoxiphen | SD | ||
| ANKRD27 | insertion | Nonsense_Mutation | novel | c.1129_1130insAGCAAGACCTTGTTTCTAAAAAAA | p.Phe377delinsTer | p.F377delins* | Q96NW4 | protein_coding | TCGA-AO-A0JB-01 | Breast | breast invasive carcinoma | Female | <65 | III/IV | Chemotherapy | cyclophosphamide | SD | ||
| ANKRD27 | insertion | Frame_Shift_Ins | novel | c.1127_1128insCAAC | p.Phe377AsnfsTer9 | p.F377Nfs*9 | Q96NW4 | protein_coding | TCGA-AO-A0JB-01 | Breast | breast invasive carcinoma | Female | <65 | III/IV | Chemotherapy | cyclophosphamide | SD |
| Page: 1 2 3 4 5 6 7 8 9 10 11 12 13 |
Top |
Related drugs of malignant transformation related genes |
| Identification of chemicals and drugs interact with genes involved in malignant transfromation |
| (DGIdb 4.0) |
| Entrez ID | Symbol | Category | Interaction Types | Drug Claim Name | Drug Name | PMIDs |
| Page: 1 |

Copyright 2023-Present -The University of Texas Health Science Center at Houston |