
|
|||||
|
 | |
| |
| |
| |
| |
| |
|
Gene: ANKFY1 |
Gene summary for ANKFY1 |
| Gene information | Species | Human | Gene symbol | ANKFY1 | Gene ID | 51479 |
| Gene name | ankyrin repeat and FYVE domain containing 1 | |
| Gene Alias | ANKHZN | |
| Cytomap | 17p13.2 | |
| Gene Type | protein-coding | GO ID | GO:0006810 | UniProtAcc | Q9P2R3 |
Top |
Malignant transformation analysis |
| Identification of the aberrant gene expression in precancerous and cancerous lesions by comparing the gene expression of stem-like cells in diseased tissues with normal stem cells |
| Entrez ID | Symbol | Replicates | Species | Organ | Tissue | Adj P-value | Log2FC | Malignancy |
| 51479 | ANKFY1 | P26T-E | Human | Esophagus | ESCC | 5.58e-08 | 1.24e-01 | 0.1276 |
| 51479 | ANKFY1 | P27T-E | Human | Esophagus | ESCC | 1.06e-20 | 2.75e-01 | 0.1055 |
| 51479 | ANKFY1 | P28T-E | Human | Esophagus | ESCC | 1.49e-11 | 2.38e-01 | 0.1149 |
| 51479 | ANKFY1 | P30T-E | Human | Esophagus | ESCC | 2.68e-11 | 3.83e-01 | 0.137 |
| 51479 | ANKFY1 | P31T-E | Human | Esophagus | ESCC | 1.10e-17 | 3.35e-01 | 0.1251 |
| 51479 | ANKFY1 | P32T-E | Human | Esophagus | ESCC | 9.82e-10 | 2.25e-01 | 0.1666 |
| 51479 | ANKFY1 | P36T-E | Human | Esophagus | ESCC | 4.32e-18 | 4.45e-01 | 0.1187 |
| 51479 | ANKFY1 | P37T-E | Human | Esophagus | ESCC | 4.51e-23 | 3.34e-01 | 0.1371 |
| 51479 | ANKFY1 | P38T-E | Human | Esophagus | ESCC | 7.21e-03 | 8.58e-02 | 0.127 |
| 51479 | ANKFY1 | P39T-E | Human | Esophagus | ESCC | 1.20e-17 | 1.61e-01 | 0.0894 |
| 51479 | ANKFY1 | P40T-E | Human | Esophagus | ESCC | 4.20e-05 | 2.08e-01 | 0.109 |
| 51479 | ANKFY1 | P42T-E | Human | Esophagus | ESCC | 3.26e-22 | 3.21e-01 | 0.1175 |
| 51479 | ANKFY1 | P44T-E | Human | Esophagus | ESCC | 1.72e-06 | 1.96e-01 | 0.1096 |
| 51479 | ANKFY1 | P47T-E | Human | Esophagus | ESCC | 1.58e-09 | 1.79e-01 | 0.1067 |
| 51479 | ANKFY1 | P48T-E | Human | Esophagus | ESCC | 2.00e-10 | 1.89e-01 | 0.0959 |
| 51479 | ANKFY1 | P49T-E | Human | Esophagus | ESCC | 3.54e-06 | 6.53e-01 | 0.1768 |
| 51479 | ANKFY1 | P52T-E | Human | Esophagus | ESCC | 2.34e-16 | 2.19e-01 | 0.1555 |
| 51479 | ANKFY1 | P54T-E | Human | Esophagus | ESCC | 1.17e-22 | 2.97e-01 | 0.0975 |
| 51479 | ANKFY1 | P57T-E | Human | Esophagus | ESCC | 2.83e-14 | 1.81e-01 | 0.0926 |
| 51479 | ANKFY1 | P61T-E | Human | Esophagus | ESCC | 6.18e-17 | 3.03e-01 | 0.099 |
| Page: 1 2 3 4 5 |
| Tissue | Expression Dynamics | Abbreviation |
| Esophagus | 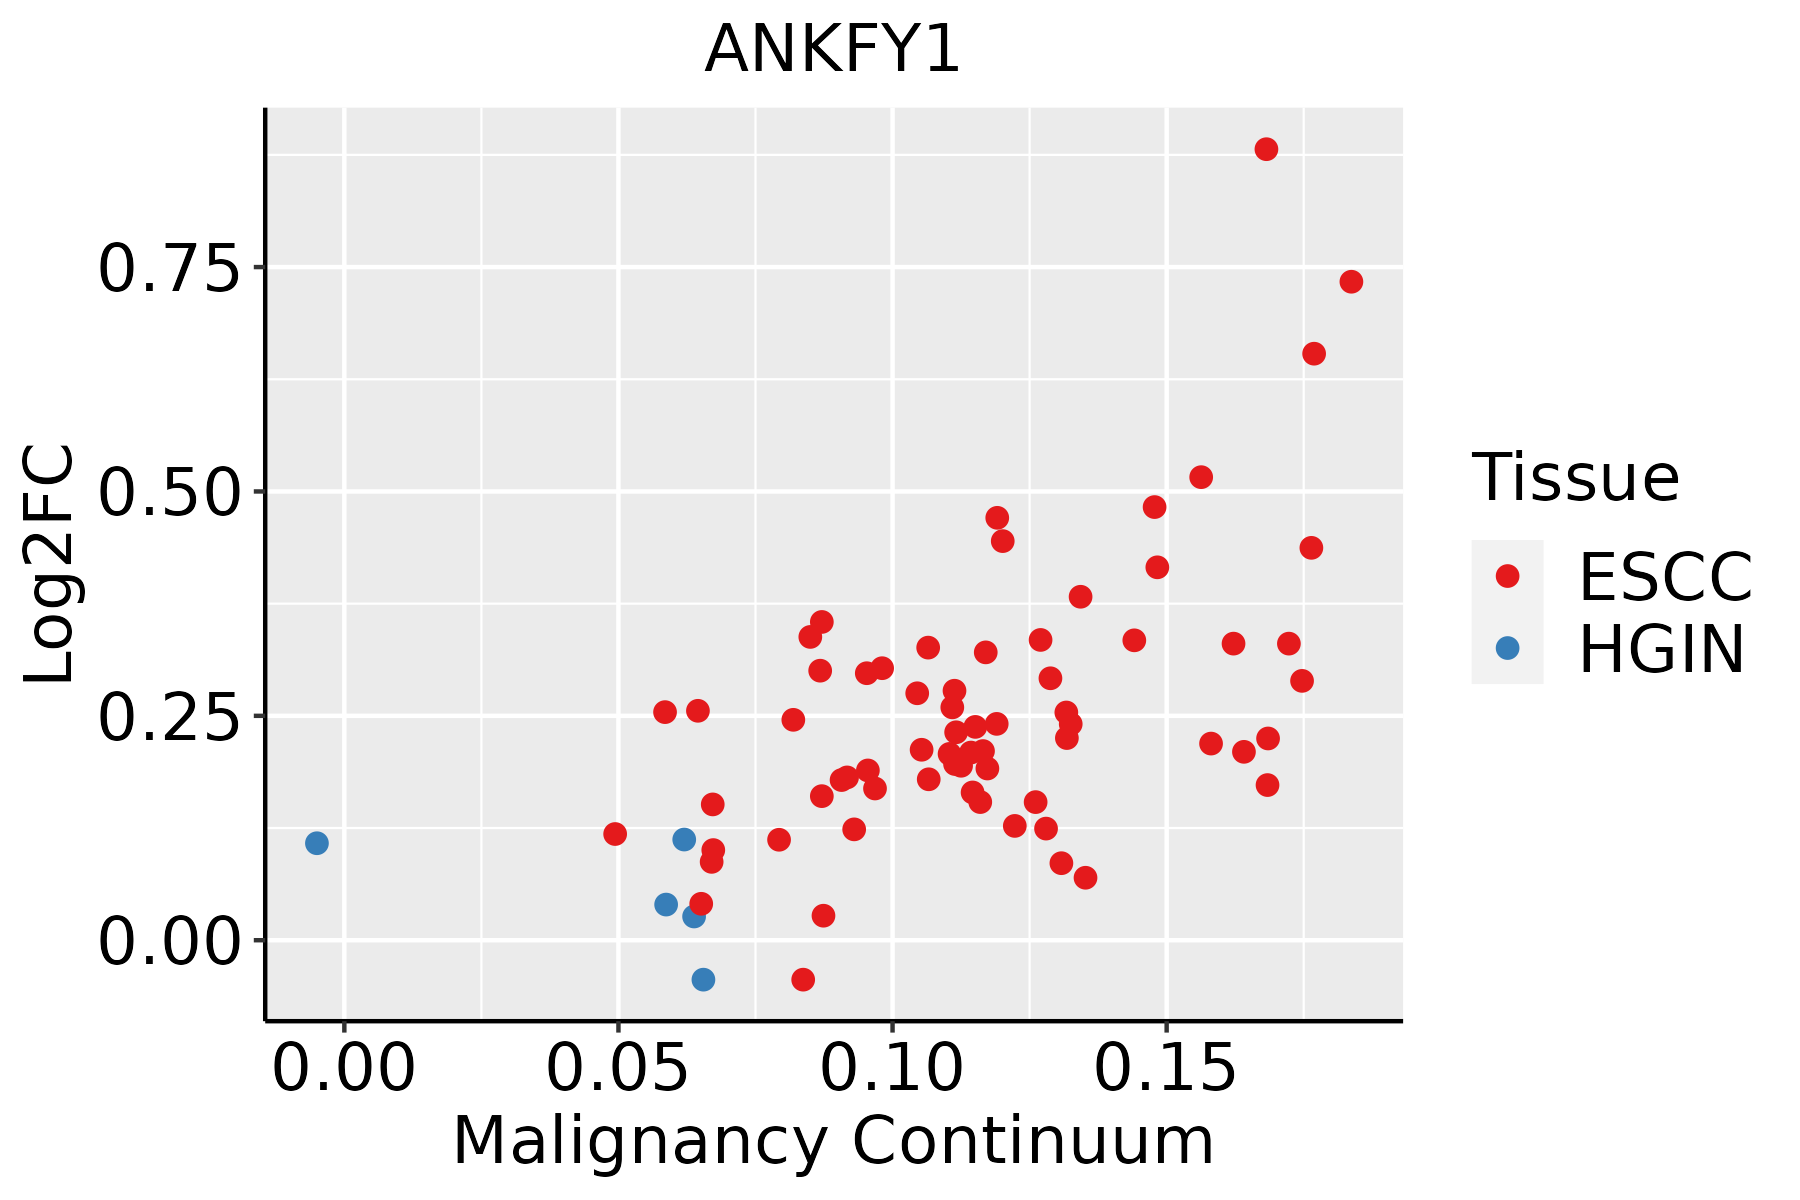 | ESCC: Esophageal squamous cell carcinoma |
| HGIN: High-grade intraepithelial neoplasias | ||
| LGIN: Low-grade intraepithelial neoplasias | ||
| Oral Cavity | 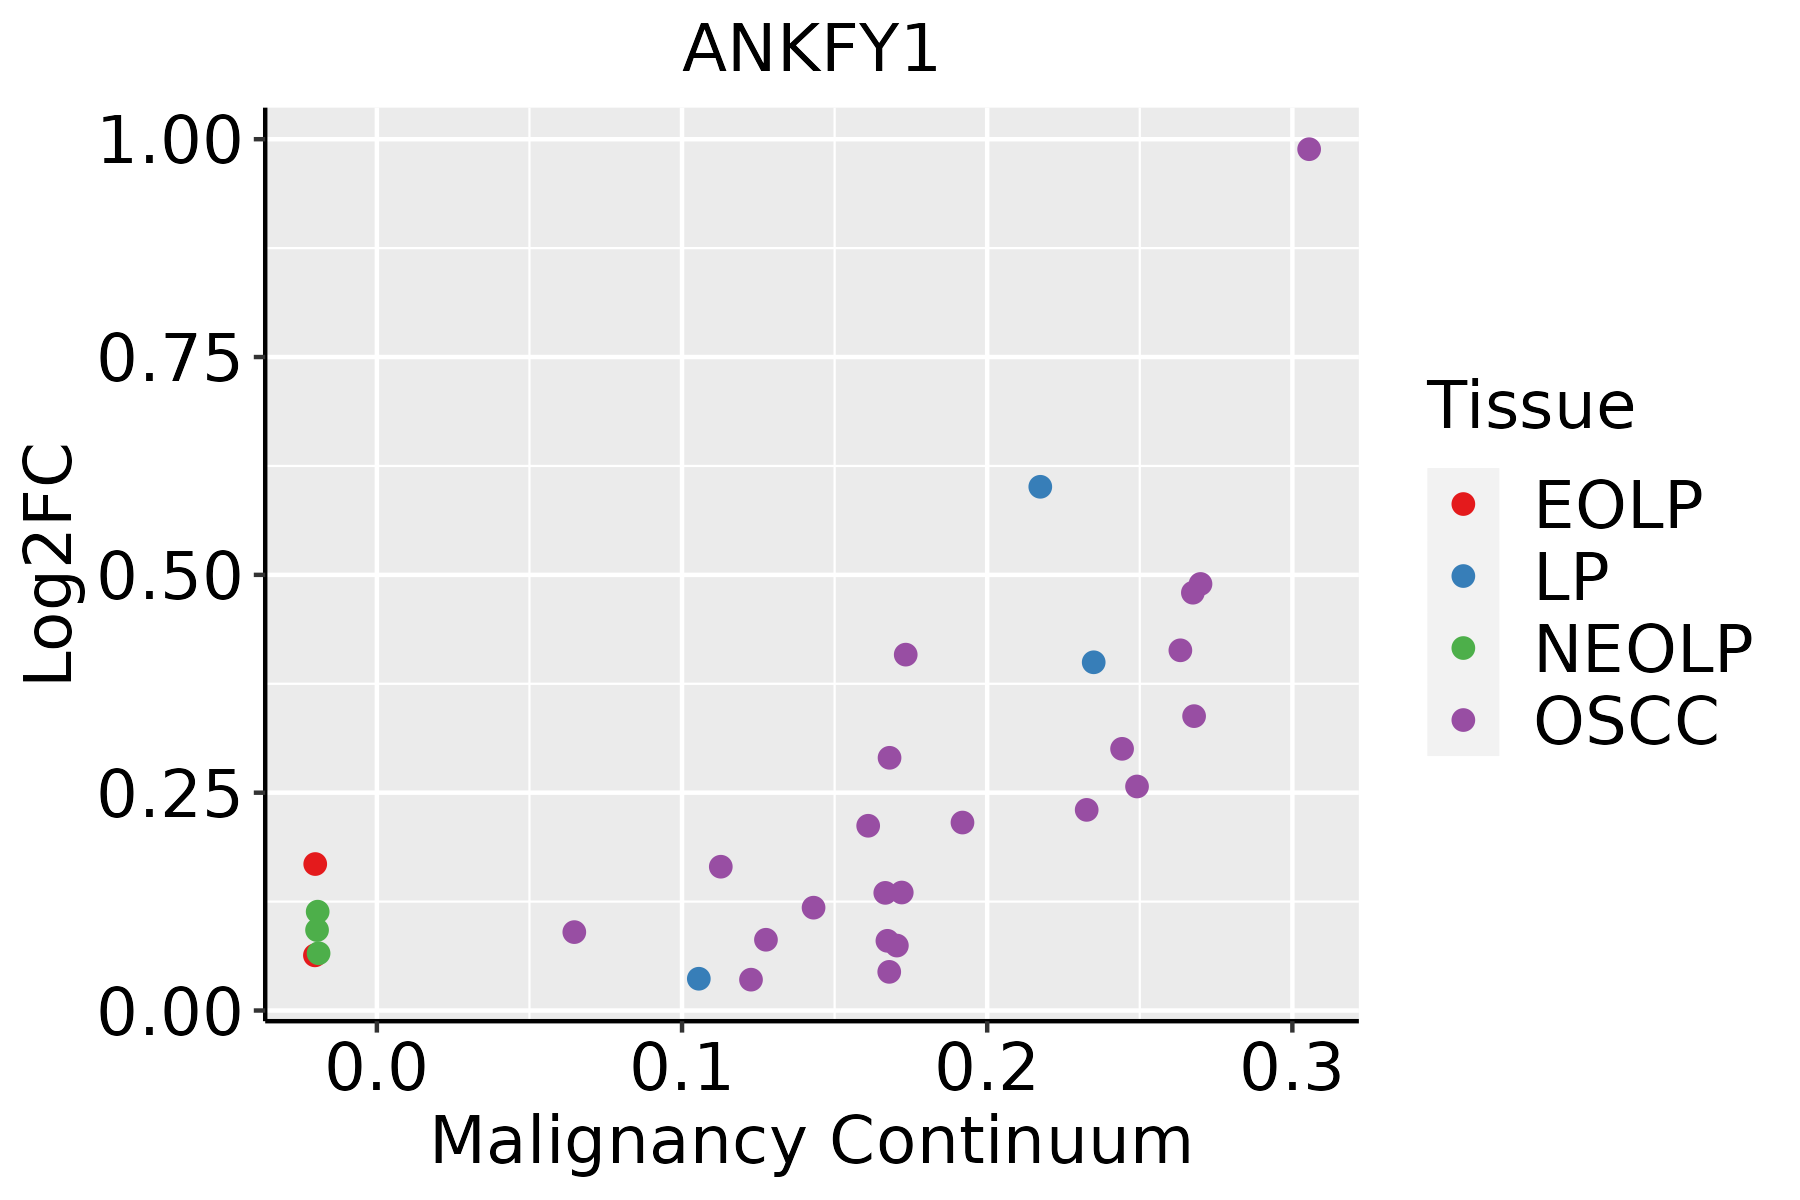 | EOLP: Erosive Oral lichen planus |
| LP: leukoplakia | ||
| NEOLP: Non-erosive oral lichen planus | ||
| OSCC: Oral squamous cell carcinoma | ||
| Prostate | 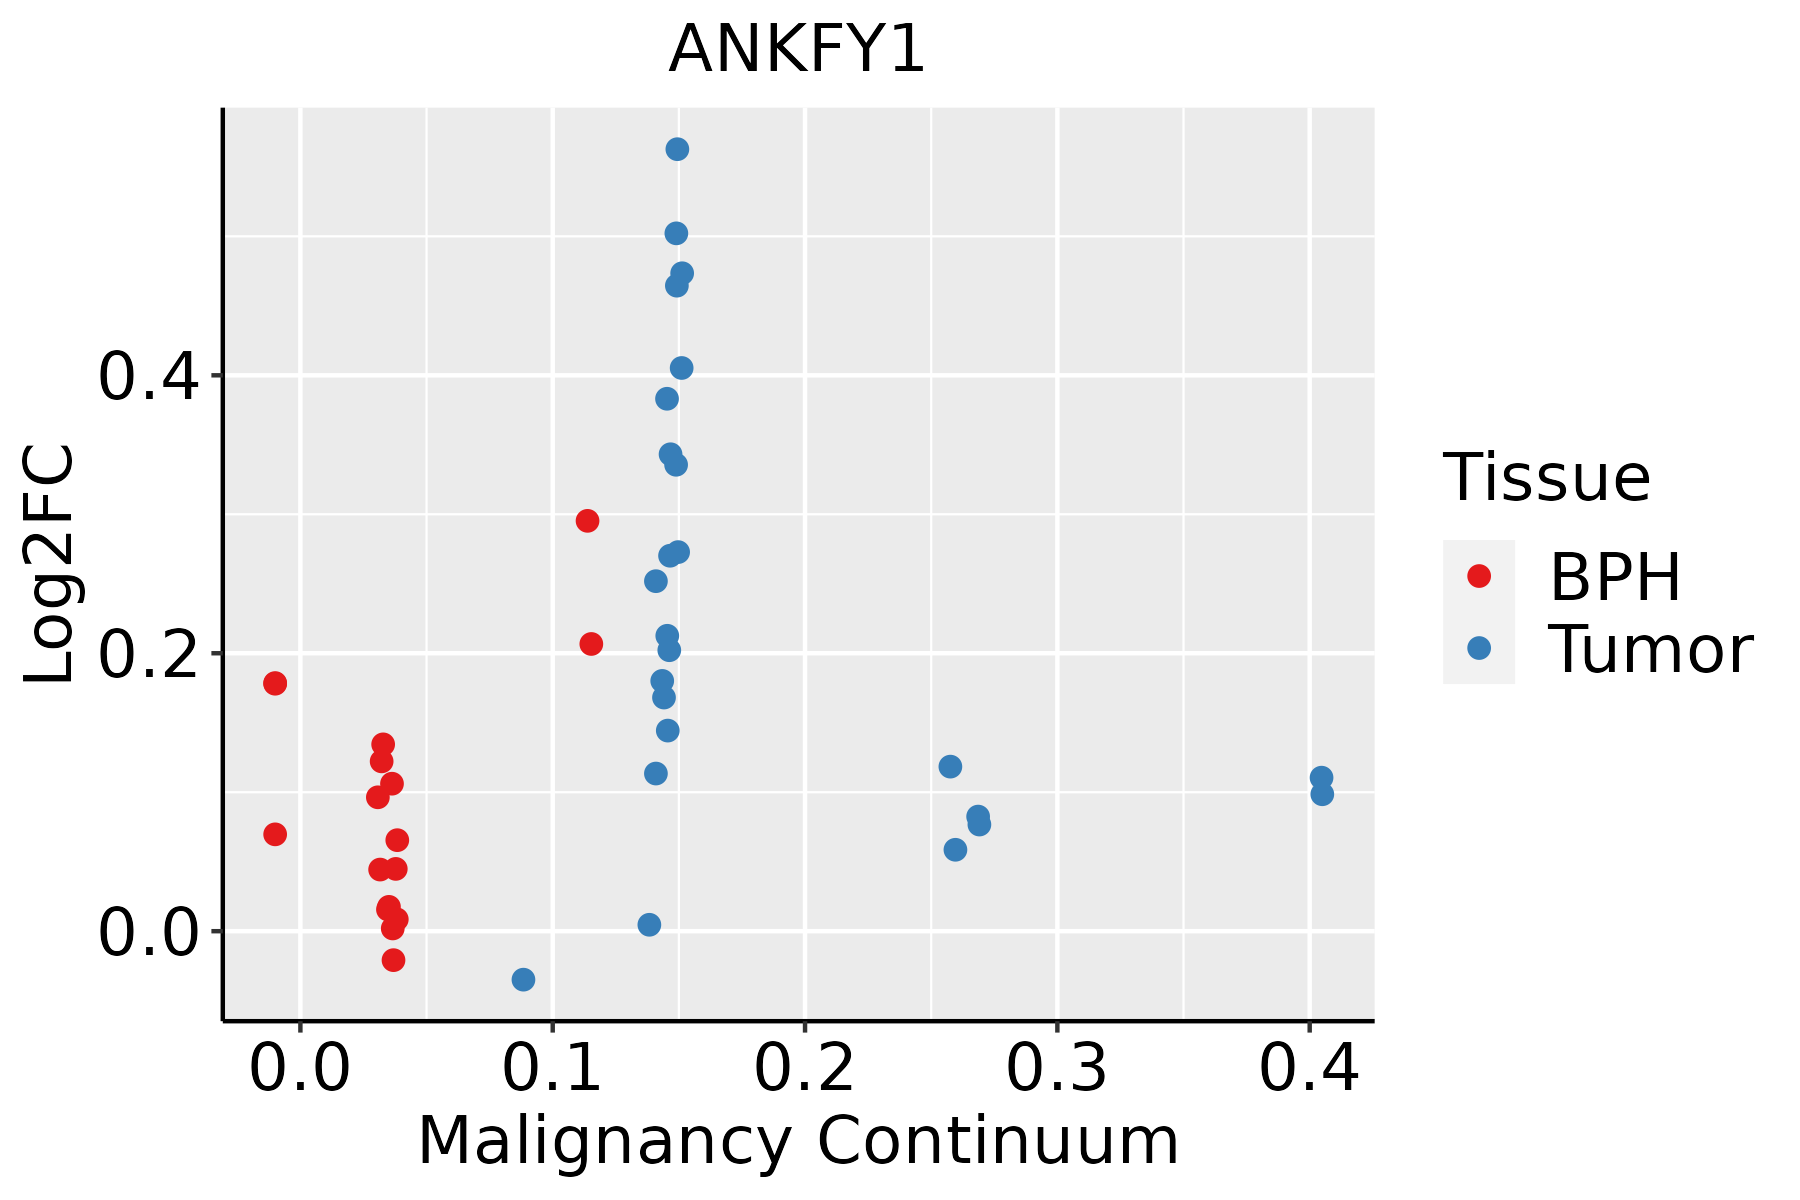 | BPH: Benign Prostatic Hyperplasia |
| Thyroid | 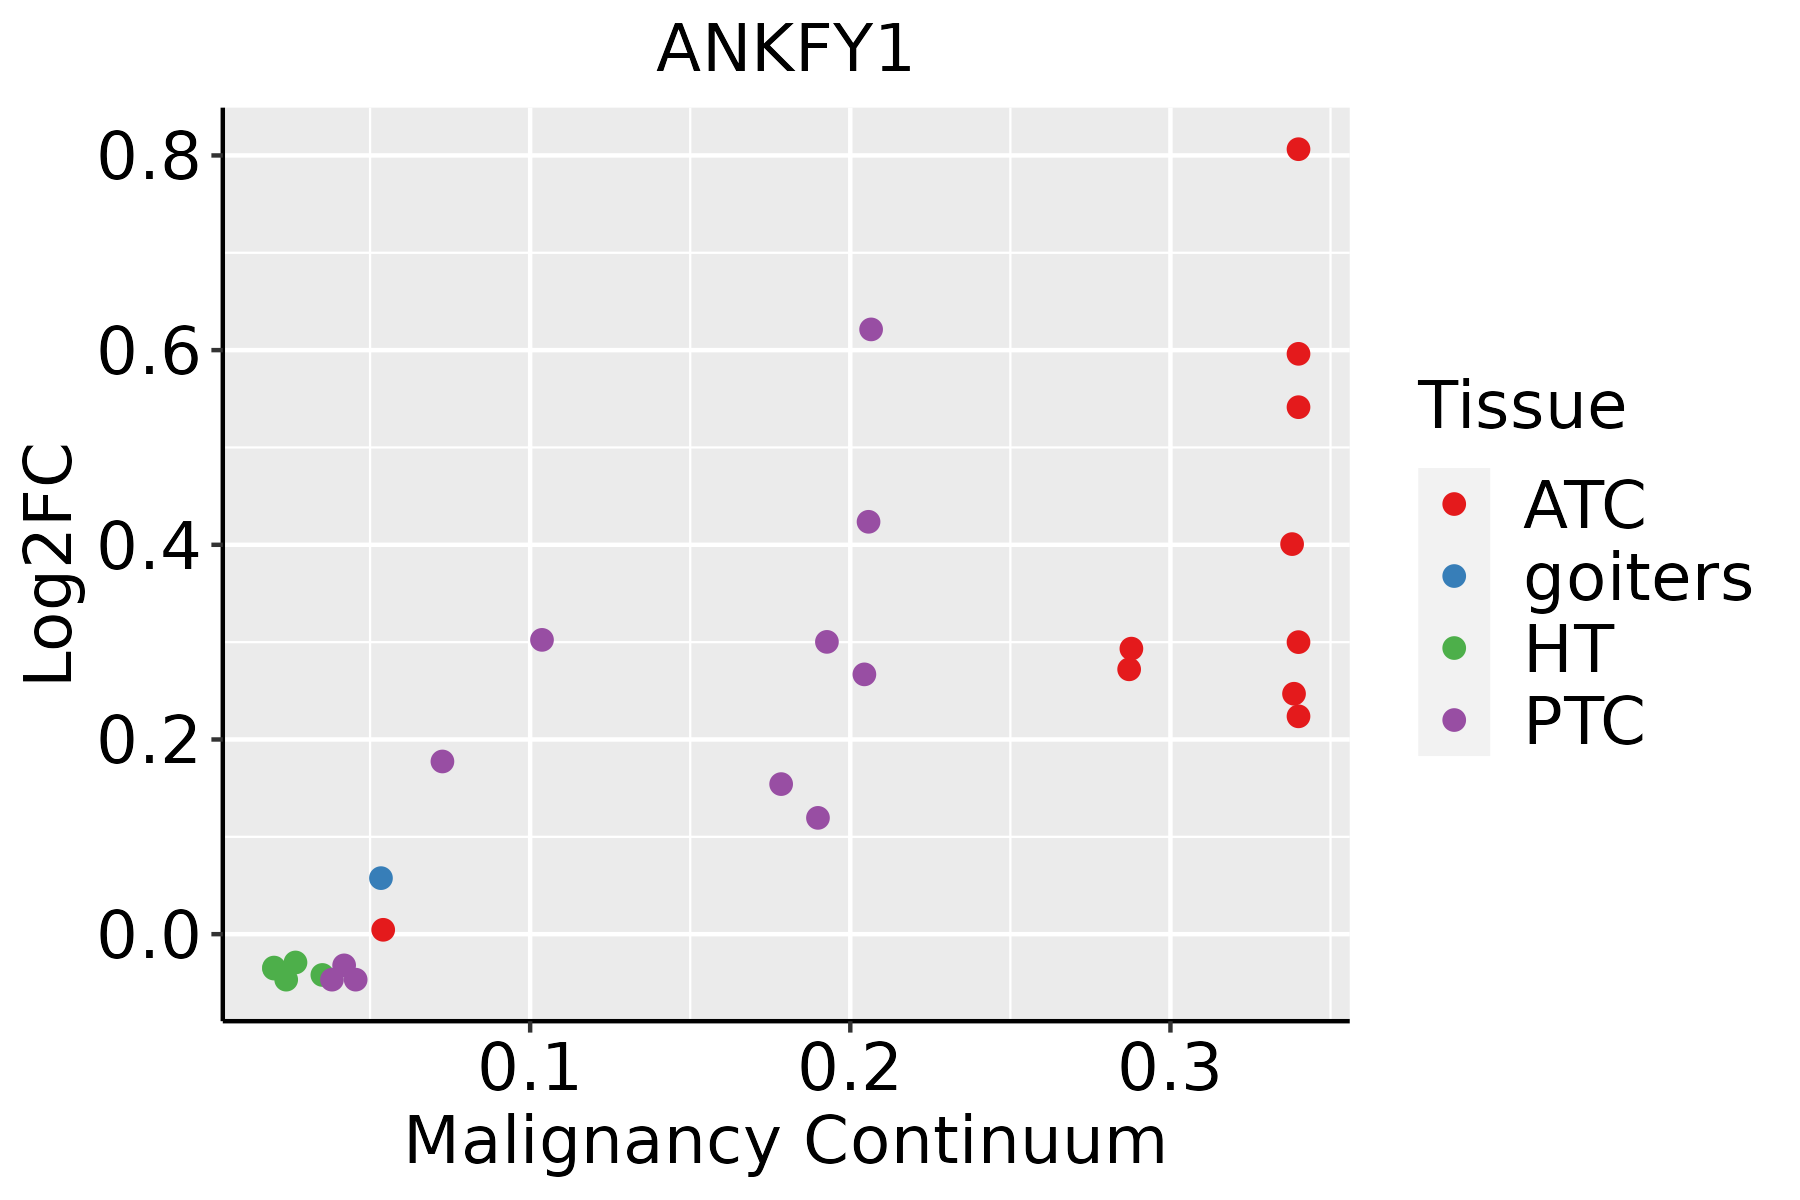 | ATC: Anaplastic thyroid cancer |
| HT: Hashimoto's thyroiditis | ||
| PTC: Papillary thyroid cancer |
| ∗log2FC in expression of this searched gene in stem-like cells from each diseased tissue sample relative to stem-like cells in normal samples in each tissue plotted against the malignancy continuum. Samples are colored based on if they are from different disease stage. |
Top |
Malignant transformation related pathway analysis |
| Find out the enriched GO biological processes and KEGG pathways involved in transition from healthy to precancer to cancer |
| Tissue | Disease Stage | Enriched GO biological Processes |
| Colorectum | AD |  |
| Colorectum | SER |  |
| Colorectum | MSS |  |
| Colorectum | MSI-H |  |
| Colorectum | FAP |  |
| ∗Top 15 enriched GO BP terms are showed in the bar plot of each disease state in each tissue. Each row represents a significant GO biological process which is colored according to the -log10(p.adjust). |
| Page: 1 2 3 4 5 6 7 8 9 |
| GO ID | Tissue | Disease Stage | Description | Gene Ratio | Bg Ratio | pvalue | p.adjust | Count |
| GO:004819318 | Esophagus | ESCC | Golgi vesicle transport | 231/8552 | 296/18723 | 1.82e-30 | 9.63e-28 | 231 |
| GO:001605014 | Esophagus | ESCC | vesicle organization | 211/8552 | 300/18723 | 2.85e-18 | 2.87e-16 | 211 |
| GO:001619715 | Esophagus | ESCC | endosomal transport | 168/8552 | 230/18723 | 2.28e-17 | 1.93e-15 | 168 |
| GO:000703417 | Esophagus | ESCC | vacuolar transport | 119/8552 | 157/18723 | 1.16e-14 | 6.30e-13 | 119 |
| GO:001648210 | Esophagus | ESCC | cytosolic transport | 124/8552 | 168/18723 | 9.69e-14 | 4.69e-12 | 124 |
| GO:000689215 | Esophagus | ESCC | post-Golgi vesicle-mediated transport | 82/8552 | 104/18723 | 4.00e-12 | 1.55e-10 | 82 |
| GO:00070419 | Esophagus | ESCC | lysosomal transport | 83/8552 | 114/18723 | 3.52e-09 | 7.41e-08 | 83 |
| GO:003010018 | Esophagus | ESCC | regulation of endocytosis | 135/8552 | 211/18723 | 5.75e-08 | 1.02e-06 | 135 |
| GO:00482844 | Esophagus | ESCC | organelle fusion | 94/8552 | 141/18723 | 3.72e-07 | 5.16e-06 | 94 |
| GO:004580718 | Esophagus | ESCC | positive regulation of endocytosis | 69/8552 | 100/18723 | 1.97e-06 | 2.29e-05 | 69 |
| GO:00421477 | Esophagus | ESCC | retrograde transport, endosome to Golgi | 63/8552 | 91/18723 | 4.58e-06 | 4.87e-05 | 63 |
| GO:00901743 | Esophagus | ESCC | organelle membrane fusion | 73/8552 | 110/18723 | 9.29e-06 | 8.88e-05 | 73 |
| GO:00069063 | Esophagus | ESCC | vesicle fusion | 70/8552 | 106/18723 | 1.82e-05 | 1.60e-04 | 70 |
| GO:00610254 | Esophagus | ESCC | membrane fusion | 98/8552 | 163/18723 | 1.39e-04 | 9.41e-04 | 98 |
| GO:00485483 | Esophagus | ESCC | regulation of pinocytosis | 11/8552 | 12/18723 | 1.26e-03 | 6.06e-03 | 11 |
| GO:00068963 | Esophagus | ESCC | Golgi to vacuole transport | 16/8552 | 20/18723 | 1.85e-03 | 8.40e-03 | 16 |
| GO:00069073 | Esophagus | ESCC | pinocytosis | 16/8552 | 22/18723 | 9.46e-03 | 3.28e-02 | 16 |
| GO:004819315 | Oral cavity | OSCC | Golgi vesicle transport | 209/7305 | 296/18723 | 1.39e-28 | 6.30e-26 | 209 |
| GO:00160508 | Oral cavity | OSCC | vesicle organization | 189/7305 | 300/18723 | 2.40e-17 | 2.14e-15 | 189 |
| GO:00161979 | Oral cavity | OSCC | endosomal transport | 141/7305 | 230/18723 | 5.40e-12 | 2.06e-10 | 141 |
| Page: 1 2 3 4 5 6 |
| Pathway ID | Tissue | Disease Stage | Description | Gene Ratio | Bg Ratio | pvalue | p.adjust | qvalue | Count |
| Page: 1 |
Top |
Cell-cell communication analysis |
| Identification of potential cell-cell interactions between two cell types and their ligand-receptor pairs for different disease states |
| Ligand | Receptor | LRpair | Pathway | Tissue | Disease Stage |
| Page: 1 |
Top |
Single-cell gene regulatory network inference analysis |
| Find out the significant the regulons (TFs) and the target genes of each regulon across cell types for different disease states |
| TF | Cell Type | Tissue | Disease Stage | Target Gene | RSS | Regulon Activity |
| ∗The dot plots of a searched regulon are shown for all cell subpopulations in each disease state of each tissue based on the regulon specific score inferred using pySCENIC and by calculating the average expression. |
| Page: 1 |
Top |
Somatic mutation of malignant transformation related genes |
| Annotation of somatic variants for genes involved in malignant transformation |
| Hugo Symbol | Variant Class | Variant Classification | dbSNP RS | HGVSc | HGVSp | HGVSp Short | SWISSPROT | BIOTYPE | SIFT | PolyPhen | Tumor Sample Barcode | Tissue | Histology | Sex | Age | Stage | Therapy Types | Drugs | Outcome |
| ANKFY1 | SNV | Missense_Mutation | c.470T>C | p.Met157Thr | p.M157T | Q9P2R3 | protein_coding | tolerated(0.41) | benign(0.023) | TCGA-A2-A0D2-01 | Breast | breast invasive carcinoma | Female | <65 | I/II | Chemotherapy | adriamycin | SD | |
| ANKFY1 | SNV | Missense_Mutation | c.793N>T | p.His265Tyr | p.H265Y | Q9P2R3 | protein_coding | deleterious(0) | benign(0.421) | TCGA-A8-A08R-01 | Breast | breast invasive carcinoma | Female | <65 | I/II | Unknown | Unknown | SD | |
| ANKFY1 | SNV | Missense_Mutation | rs768383868 | c.923G>A | p.Arg308Gln | p.R308Q | Q9P2R3 | protein_coding | tolerated(0.58) | benign(0.003) | TCGA-A8-A0A7-01 | Breast | breast invasive carcinoma | Female | <65 | I/II | Unknown | Unknown | SD |
| ANKFY1 | SNV | Missense_Mutation | novel | c.1851N>A | p.Asn617Lys | p.N617K | Q9P2R3 | protein_coding | tolerated(0.27) | benign(0.124) | TCGA-AC-A3W6-01 | Breast | breast invasive carcinoma | Female | >=65 | III/IV | Unknown | Unknown | SD |
| ANKFY1 | SNV | Missense_Mutation | rs745379002 | c.712N>A | p.Asp238Asn | p.D238N | Q9P2R3 | protein_coding | tolerated(0.08) | benign(0.311) | TCGA-AN-A046-01 | Breast | breast invasive carcinoma | Female | >=65 | I/II | Unknown | Unknown | SD |
| ANKFY1 | SNV | Missense_Mutation | c.2159G>C | p.Gly720Ala | p.G720A | Q9P2R3 | protein_coding | deleterious(0) | probably_damaging(0.999) | TCGA-AN-A0AJ-01 | Breast | breast invasive carcinoma | Female | >=65 | I/II | Unknown | Unknown | SD | |
| ANKFY1 | insertion | Nonsense_Mutation | novel | c.2211_2212insGCTGCCTGAGCTCCTGTAGTCACG | p.Ala737_Leu738insAlaAlaTerAlaProValValThr | p.A737_L738insAA*APVVT | Q9P2R3 | protein_coding | TCGA-A2-A0CP-01 | Breast | breast invasive carcinoma | Female | <65 | I/II | Chemotherapy | cytoxan | SD | ||
| ANKFY1 | insertion | Nonsense_Mutation | novel | c.2161_2162insTCTTGGCATGCCAGTAGCCGGCTTGACTTTCACAGTTAAGGTTATCA | p.Ala721ValfsTer6 | p.A721Vfs*6 | Q9P2R3 | protein_coding | TCGA-A8-A07J-01 | Breast | breast invasive carcinoma | Female | <65 | I/II | Chemotherapy | 5-fluorouracil | CR | ||
| ANKFY1 | insertion | Nonsense_Mutation | novel | c.915_916insACGTAGACATCAAAGAGAGAATCTA | p.Leu306ThrfsTer2 | p.L306Tfs*2 | Q9P2R3 | protein_coding | TCGA-AN-A0AS-01 | Breast | breast invasive carcinoma | Female | >=65 | III/IV | Unknown | Unknown | SD | ||
| ANKFY1 | insertion | Frame_Shift_Ins | novel | c.3043_3044insTTTATCCACCATCACAGAGTTCAGAAAATTCT | p.Asn1015IlefsTer31 | p.N1015Ifs*31 | Q9P2R3 | protein_coding | TCGA-BH-A0H7-01 | Breast | breast invasive carcinoma | Female | >=65 | III/IV | Chemotherapy | doxorubicin | SD |
| Page: 1 2 3 4 5 6 7 8 9 10 11 |
Top |
Related drugs of malignant transformation related genes |
| Identification of chemicals and drugs interact with genes involved in malignant transfromation |
| (DGIdb 4.0) |
| Entrez ID | Symbol | Category | Interaction Types | Drug Claim Name | Drug Name | PMIDs |
| Page: 1 |

Copyright 2023-Present -The University of Texas Health Science Center at Houston |